Abstract
Lysosomes must maintain integrity of their limiting membrane to ensure efficient fusion with incoming organelles and degradation of substrates within their lumen. Pancreatic cancer cells upregulate lysosomal biogenesis to enhance nutrient recycling and stress resistance, but whether dedicated programs for maintaining lysosomal membrane integrity facilitate pancreatic cancer growth is unknown. Using proteomic-based organelle profiling, we identify the Ferlin family plasma membrane repair factor, Myoferlin, as selectively and highly enriched on the membrane of pancreatic cancer lysosomes. Mechanistically, lysosome localization of Myoferlin is necessary and sufficient for maintenance of lysosome health and provides an early-acting protective system against membrane damage that is independent from the endosomal sorting complex required for transport (ESCRT)-mediated repair network. Myoferlin is upregulated in human pancreatic cancer, predicts poor survival, and its ablation severely impairs lysosome function and tumour growth in vivo. Thus, retargeting of plasma membrane repair factors enhances pro-oncogenic activities of the lysosome.
Introduction
Lysosomes function as critical nodes for macromolecular recycling, vesicle trafficking, metabolic reprogramming, and pro-growth signaling in the cell1–3. Pancreatic ductal adenocarcinoma (PDA), are highly reliant on enhanced lysosome function to facilitate degradation, clearance and recycling of cellular material delivered by increased rates of vesicle trafficking through autophagy and macropinocytosis4–9. To cope with the increased flux of substrates delivered to the lysosome for degradation, PDA cells upregulate transcriptional programs for lysosome biogenesis, which are mediated by the MiT/TFE factors6,10. Although enhanced MiT/TFE activity leads to a dramatic increase in the number of lysosomes6, whether qualitative differences endow PDA lysosomes with unique structural and functional properties to cope with higher rates of vesicle trafficking and substrate clearance remains unknown.
Lysosomes are susceptible to membrane damage due to various cellular stressors and several mechanisms ensure proper lysosomal integrity and function by facilitating repair or removal of dysfunctional lysosomes11,12. These pathways include repair via the Endosomal Sorting Complex Required for Transport (ESCRT), a multi-subunit membrane-remodeling machinery that performs membrane bending and scission away from the cytoplasm12. ESCRT components were recently shown to polymerize on the limiting membrane of lysosomes challenged with membrane-damaging agents, where they facilitate repair of ‘microtears’ likely through scission and resealing of the free membrane edges13,14. When ESCRT recruitment to damage sites is blocked, more permanent and severe damage to lysosomes results. A second pathway facilitates clearance of irreversibly damaged lysosomes via a selective autophagy process, termed lysosphagy11,15–17.
PDA cells are unusual in their ability to import and degrade a large variety and quantity of intracellular and extracellular substrates in the lysosomal lumen to sustain unrestrained growth in nutrient-poor microenvironments. However, it remains unknown whether cancer-specific mechanisms for lysosomal membrane stabilization enable PDA cells to cope with higher substrate intake and susceptibility to organelle stress. To answer this question, we conducted mass spectrometry-based profiling of immuno-isolated lysosomes captured from PDA and non-PDA cells. We identified members of the Ferlin family of membrane repair factors, Myoferlin (MYOF) and Dysferlin (DYSF) as membrane proteins uniquely enriched in PDA lysosome fractions, with MYOF being broadly upregulated in PDA cell lines and patient samples. We find that lysosomal MYOF protects against a variety of membrane stressors to sustain enhanced lysosome function in PDA. Accordingly, MYOF depletion in PDA cells triggers constitutive lysosomal membrane damage, leading to profound defects in lysosome morphology and function and arrested PDA tumour growth. Importantly, MYOF is upregulated in patient PDA specimens and high levels are predictive of poor patient prognosis, thus implicating MYOF as a key regulator of lysosome function and PDA tumour growth.
Results
Organelle proteomics identifies the Ferlin repair factors as PDA specific lysosomal membrane proteins.
To identify proteins specific to PDA lysosomes, we captured intact lysosomes via affinity purification from cells stably expressing the lysosome membrane protein TMEM192 fused to mRFP and 3x HA tag (T192-mRFP-3xHA; LysoTag) (Fig. 1a; Extended Data 1a) and performed mass spectrometry-based proteomics analysis18,19. Comparative analysis of lysosome proteins from PDA cells (PaTu8988T) versus non-PDA cells (HEK293T) identified 376 proteins with ≥ 2-fold enrichment in PDA lysosomal elutes (Supplementary Table 1). The biological processes and pathways associated with these enriched PDA lysosomal proteins included metabolism (“fatty acid degradation”, “valine, leucine, isoleucine degradation”, “central carbon metabolism in cancer”), cell adhesion (“focal adhesion”, “ECM-receptor interaction”) (Fig. 1b) as well as “vesicle-mediated trafficking” (eg. RAB22A, SNX11) and “endocytosis” (eg. CLTB, DNML1, PACSIN3, ITSN1, EZR) consistent with heightened rates of vesicle trafficking converging on the lysosome in PDA cells (Fig. 1b,c; Supplementary Table 2). Moreover, several autophagy related proteins (LC3B, GABARAP2) and autophagy receptors (NBR1, WDFY3, SEC62, TEX264, SQSTM1), were enriched in PDA lysosomes, consistent with increased rates of autophagy in PDA (Fig. 1d,e). As a control, levels of LAMP1 were similar in HEK293T and PaTu8988T lysosomes (Fig. 1d,e).
Fig. 1 |. Organelle proteomics identifies the Ferlin repair factors as PDA specific lysosome associated membrane proteins.
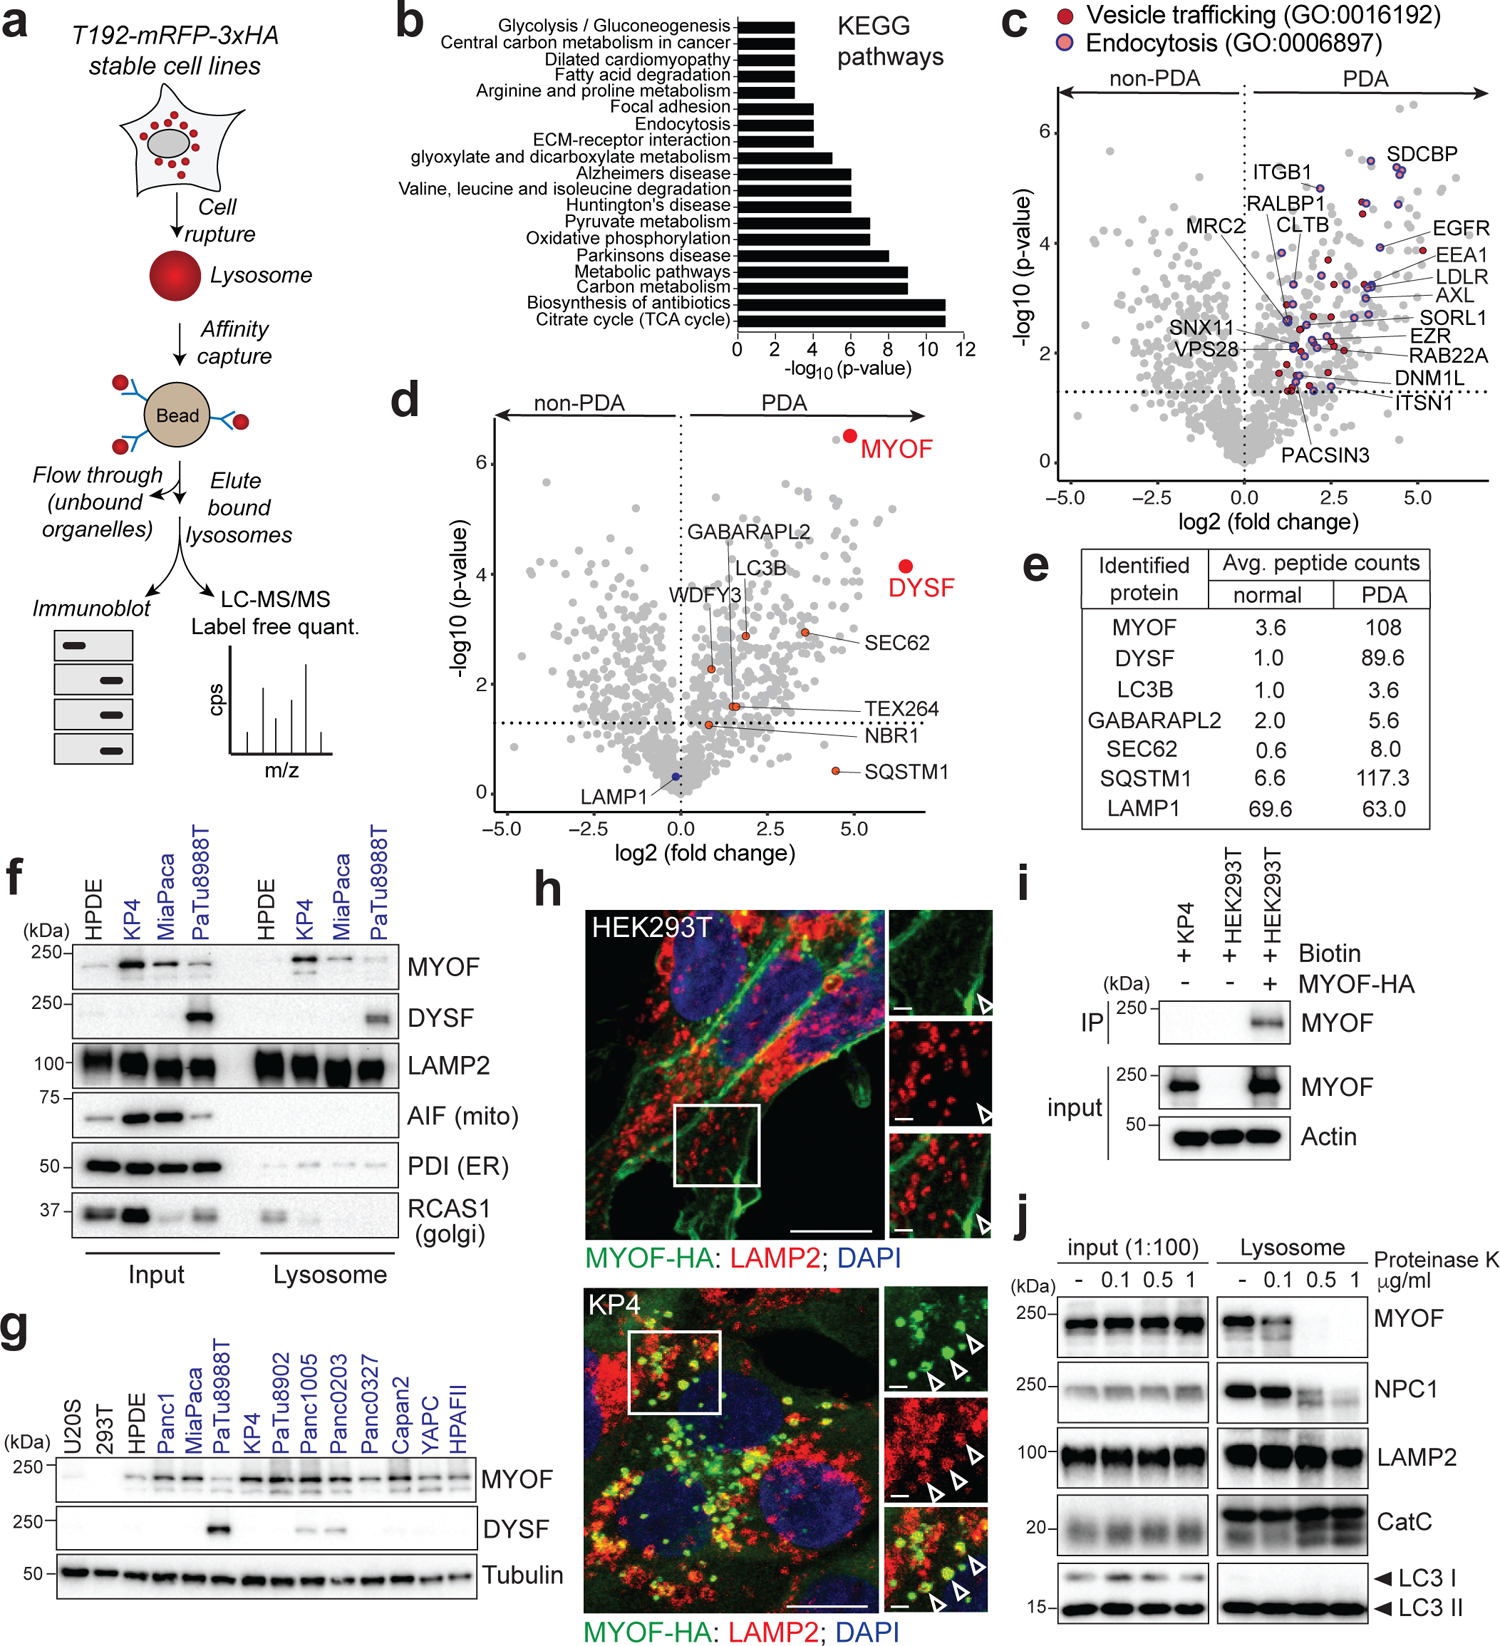
a. Schematic showing lysosome purification using affinity-based capture from cells stably expressing T192-mRFP-3xHA. b. KEGG pathway analysis of ≥2-fold enriched PDA lysosome associated proteins. c. Volcano plot of lysosome proteomics data from non-PDA (HEK293T) and PDA (PaTu8988T) cells. Data are plotted as log2 fold change (PDA/non-PDA) versus the -log10 of the p-value. ≥2-fold enriched proteins associated with “vesicle mediated trafficking” are indicated in dark red and overlapping proteins associated with ”endocytosis” are indicated in pink/blue (see supplementary table 1). d. Identical volcano plot as in (c) indicating autophagy related proteins (orange) and MYOF and DYSF (red). e. Average peptide counts for the indicated proteins from n = 3 biological replicates. f. Immunoprecipitation of purified lysosomes from the indicated cell lines showing enrichment of MYOF and DYSF in PDA lysosome fractions. LAMP2 serves as a loading control while absence of AIF, PDI and RCAS1 confirm organelle purity. g. Immunoblot showing levels of MYOF and restricted expression of DYSF in the indicated human cell lines (PDA highlighted in blue). h. Immuno-fluorescence staining of MYOF-HA (green) and LAMP2 (red) in HEK293T (left) and KP4 (right) cells. Arrowheads indicate plasma membrane localization of MYOF in HEK293T cells and lysosome localization in KP4 cells. Scale, 20μm, inset scale, 2μm. i. Biotinylation of cell surface proteins in KP4 and HEK293T cells expressing MYOF-HA. Biotinylated proteins were immuno-precipitated and western-blotted for MYOF. Note, MYOF is not on the cell surface of KP4 cells while MYOF-HA is present on the cell surface when expressed in HEK293T cells. j. Affinity purified lysosomes were treated with increasing concentrations of Proteinase K as indicated. Intraluminal proteins are protected from degradation (LAMP2, Cathepsin C, LC3B) while extra-luminal proteins are sensitive to digestion (NPC1 and MYOF). Statistics source data are provided in Source data. Unmodified blots are provided in Source Data Figure 1. Experiments depicted in i, g, j are representative of two independent experiments.
Two of the most significantly enriched proteins in PDA lysosome fractions were Myoferlin (MYOF; 30-fold enriched) and Dysferlin (DYSF; 89.6-fold enriched) (Fig. 1d,e), which belong to the Ferlin family of membrane repair factors20–22. We confirmed PDA-specific enrichment of MYOF and DYSF via direct immunoblotting of lysosomal fractions from HPDE (human pancreatic ductal epithelial cells) and several PDA-LysoTag cell lines. Consistent with our proteomics data, PaTu8988T lysosomes expressed both MYOF and DYSF (Fig. 1f)., while KP4 and MiaPaca lysosomes also displayed high levels of MYOF relative to HPDE lysosomes (Fig. 1f). Moreover, MYOF transcript and protein levels were broadly upregulated in virtually all human PDA cell lines relative to a panel of non-PDA cells while DYSF upregulation was restricted to 3 PDA lines (Fig. 1g; Extended Data 1b) with PaTu8988T cells having higher levels of DYSF relative to MYOF.
Prior studies have shown that Ferlin proteins localize to the plasma membrane, where they facilitate repair of the lipid bilayer in tissues subjected to heightened mechanical stress, particularly in skeletal muscle cells21,23,24. Accordingly, mutations in DYSF are associated with two forms of muscular dystrophy; Limb Girdle Muscular Dystrophy type 2B and Miyoshi Myopathy, whereby impaired membrane resealing compromises myoblast maturation, fusion and plasma membrane repair20,25,26. Our data suggests that, in PDA cells, Ferlin proteins may be retargeted to the lysosomal membrane. Consistent with this hypothesis, transient expression of MYOF-HA in PDA cells confirmed a punctate distribution of MYOF, which colocalized with LAMP2 positive lysosomes, with little or no detectable signal on the plasma membrane (Fig. 1h; Extended Data 1b). In contrast, MYOF-HA localized to the plasma membrane or was cytoplasmic in non-PDA cells with no visible overlap with LAMP2-positive structures (Fig. 1h; Extended Data 1c). To further confirm the differential subcellular targeting of MYOF in PDA versus non-PDA cells we performed biotin labeling of surface proteins in KP4 cells and HEK293T cells transiently expressing MYOF-HA followed by streptavidin-mediated immunoprecipitation. Consistent with the immunofluorescence results, MYOF transiently expressed in HEK293T cells was efficiently biotinylated, consistent with its plasma membrane localization in these cells while endogenous MYOF is not biotinylated in KP4 cells and therefore absent from the plasma membrane (Fig. 1h,i). Thus, Myoferlin is both upregulated and shows substantial retargeting to the lysosome in PDA cells.
To exclude the possibility that Ferlin proteins are being trafficked to the lysosomal to be degraded, we treated cells with the lysosome V-ATPase inhibitor Bafilomycin A1 (BafA1) to inhibit lysosomal degradation and quantified Ferlin levels. BafA1 treatment led to a progressive accumulation of known cargo proteins such as the autophagy receptor p62 (Extended Data 1c). In contrast MYOF and DYSF did not accumulate upon BafA1 treatment suggesting that it is unlikely to be a lysosomal cargo protein.
To prove that MYOF is anchored to the outer (cytoplasmic-facing) leaflet of the lysosomal membrane, we treated affinity-captured PDA lysosomes with increasing concentrations of proteinase K, with the expectation that cytoplasmic facing proteins would be sensitive to proteinase K digestion while lumenal proteins would be protected. As expected, lumenal proteins (LC3, Cathepsin C) and lumenal facing proteins (LAMP2) were protected from proteinase K digestion, whereas membrane proteins exposed to the cytoplasm (NPC1) were progressively digested (Fig. 1j). MYOF showed rapid digestion by proteinase K, confirming that it is a membrane protein present on the outer surface of the lysosome (Fig. 1j). These data indicate that MYOF is topologically anchored via its C-terminal transmembrane domain to the outer lysosomal membrane, with its N-terminus extending into the cytoplasm.
PDA lysosomes display enhanced protection against membrane damage.
Given a known function for Ferlin proteins in maintenance and repair of membrane, we sought to determine whether MYOF might confer enhanced protection against lysosome membrane damage. To do so, we compared the response of PDA versus non-PDA lysosomes to conditions that mimic various forms of lysosomal stress, such as following treatment with LLOMe (L-Leucyl-L-leucine O-methyl ester), a well-established lysosomotropic agent commonly used to rupture endolysosomal membranes13,14,27. LLOMe rapidly accumulates within the lumen of acidic organelles and is converted by the lysosomal protease Cathepsin C into a polymer capable of causing small ruptures in the membrane27. To test the response of lysosomes to the LLOMe challenge, cells were preloaded with Lysotracker red dye, which accumulates within intact lysosomes, and the rate of dye leakage induced by LLOMe was measured over time. While lysosomes in non-PDA cells (HPDE, U20S and HEK293T) lost virtually all lysotracker red staining within 15min of LLOMe treatment (Fig. 2a; Extended Data 2a), PDA lysosomes retained Lysotracker dye for longer time periods (Fig. 2a,b). This effect was not due to reduced Cathepsin C-dependent activation of LLOMe in PDA lysosomes, as Cathepsin C levels and cathepsin activity were similar, if not higher in PDA relative to HPDE cells (Extended Data 2b,c). Prior studies have also established that particulate material such as crystals of silica, alum and uric acid are capable of damaging vesicles and lysosomal membrane14. Similarly, changes in osmolarity have also been shown to cause changes in endo-lysosome membrane tension and permeability28. Consistent with our observations with LLOMe, PDA lysosomes are more resistant to silica-induced or hypertonic sucrose-induced membrane damage as measured by reduced loss of Lysotracker signal (Extended Data 2d–g), suggesting that, relative to normal pancreatic counterparts, PDA lysosomes are capable of withstanding diverse membrane perturbing agents.
Fig. 2 |. PDA lysosomes are more resistant to lysosome membrane damage.
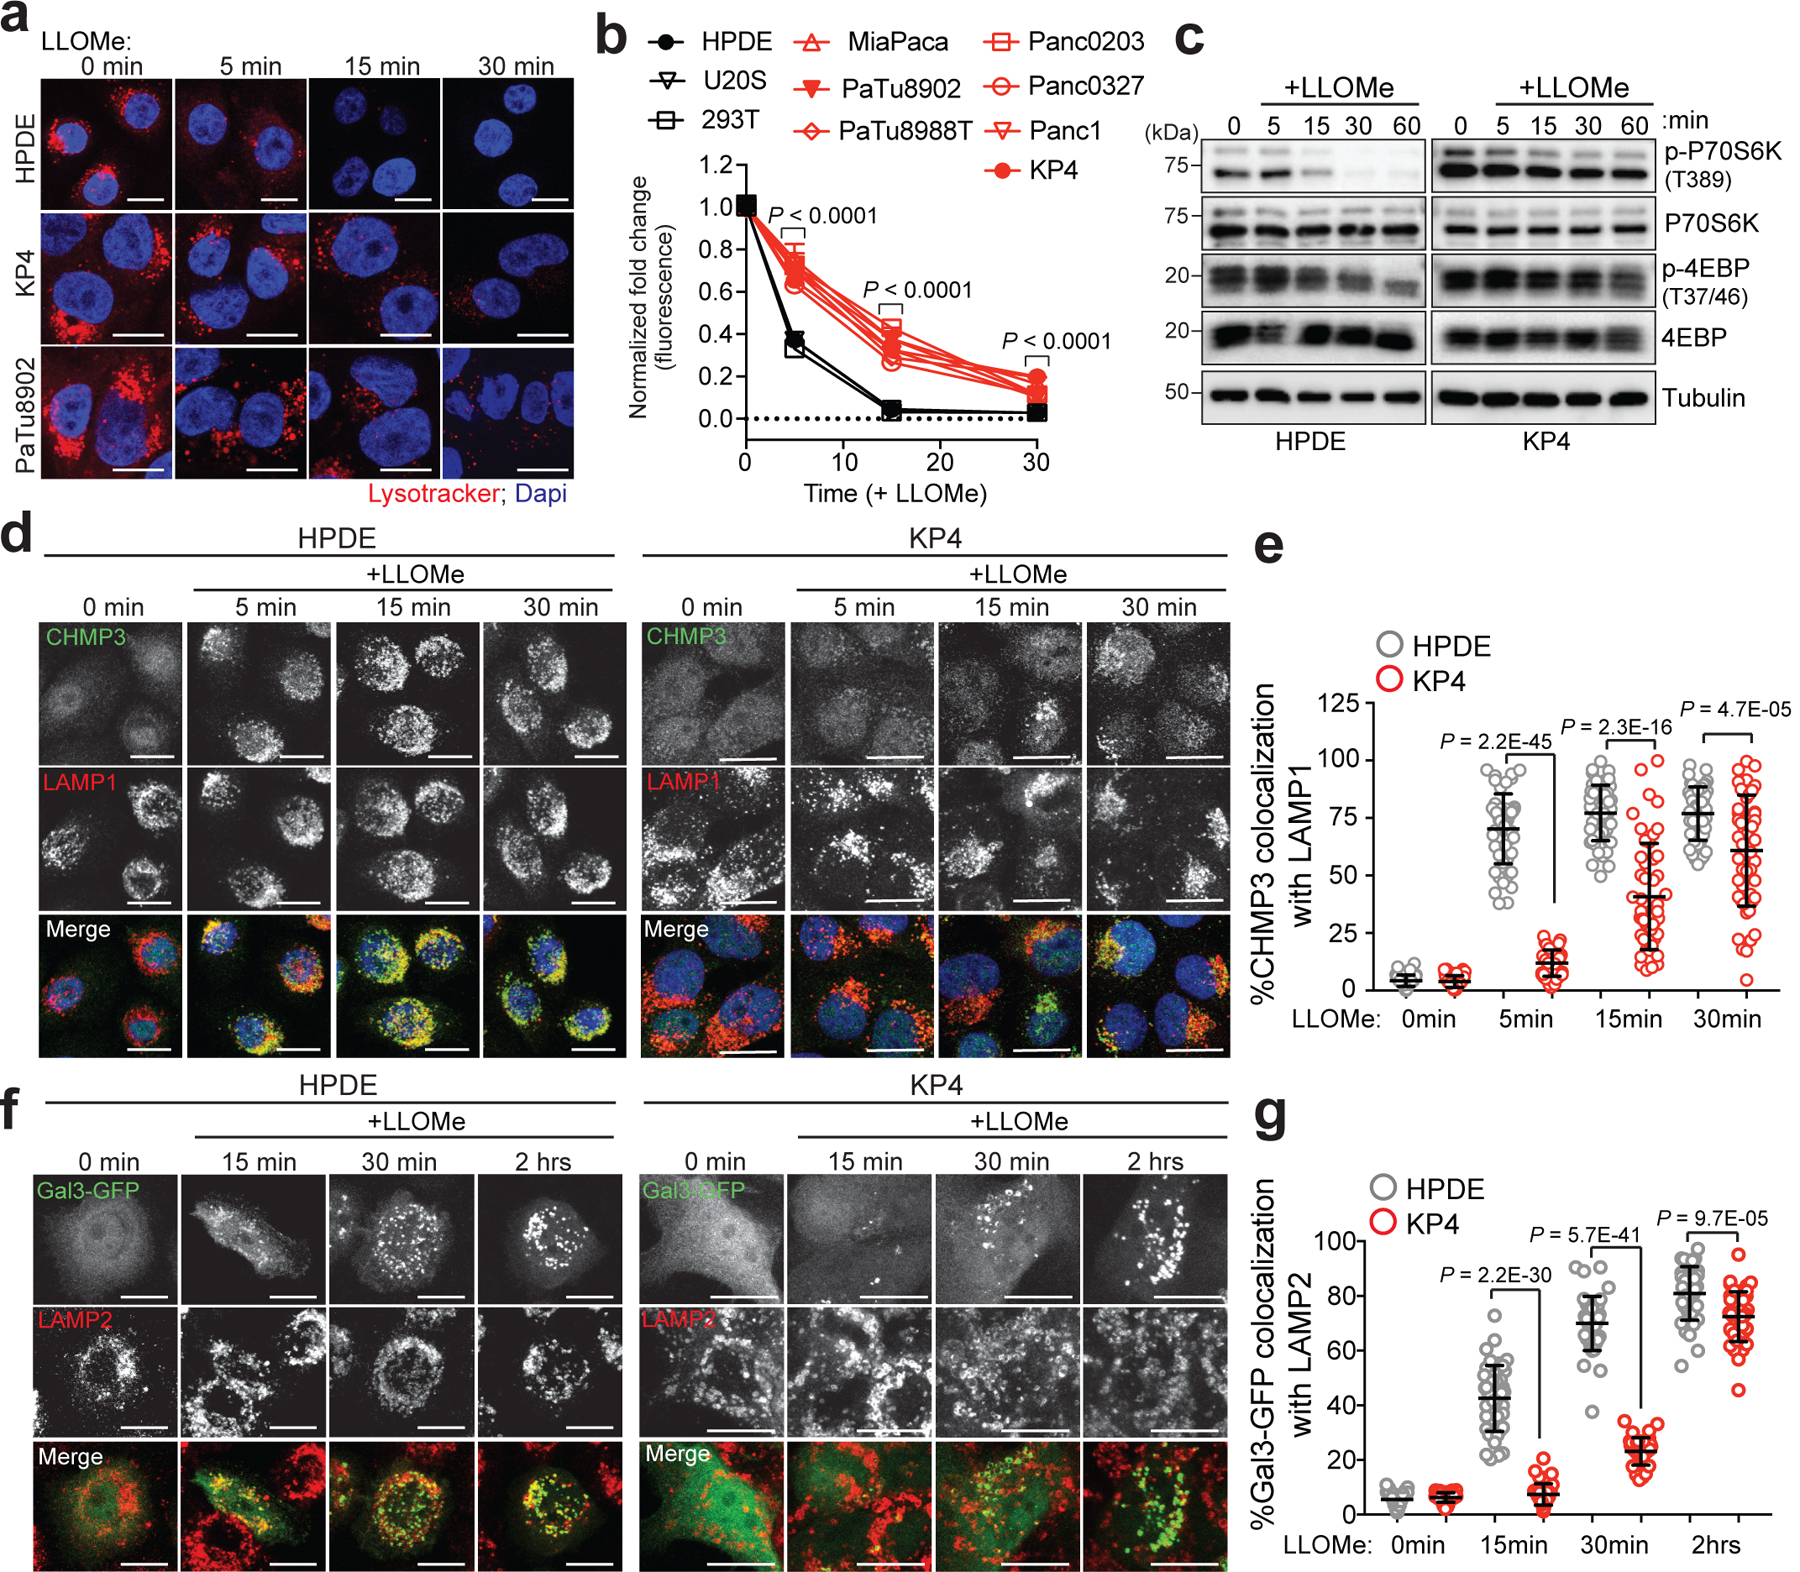
a. Time-course of lysotracker red staining in HPDE, KP4 and PaTu8902 following treatment with LLOMe. b. Quantification of normalized fold change in lysotracker red stain in the indicated cell lines treated with LLOMe. Data are mean ± s.e.m (HPDE n = 76, 80, 81, 80; KP4 n = 80, 77, 80, 82; PaTu8902 n = 96, 96, 81, 82 cells; HEK293T n= 81, 83, 83, 82; U2OS n= 64, 58, 64, 60 cells per time point; MiaPaCa; Panc0203; PaTu8988T; Panc0327, Panc1 n= 60 cells per time point). P values determined by two-way ANOVA. c. Immunoblots for the indicated proteins in HPDE and KP4 cells following time course treatment with LLOMe. d. HPDE and KP4 cells with and without LLOMe treatment were co-stained for CHMP3 (green) and LAMP1 (red). e. Quantification of percentage co-localization in control and LLOMe treated cells. (HPDE n = 50, 51, 50, 51; KP4 n = 51, 50, 50, 50 cells per time point). f. HPDE and KP4 cells expressing GFP-Galectin 3 (green) were treated with LLOMe for the indicated times and co-stained for LAMP2 (red). g. Quantification of percentage co-localization in control and LLOMe treated cells. (HPDE n = 39, 43, 40, 42; KP4 n = 43, 42, 40, 42 cells per time point). Scale, 20μm for all panels. Data are mean ± s.d. P values determined by unpaired two-tailed t-tests. Statistics source data are provided in Source data. Unmodified blots are provided in Source Data Figure 2. Experiments depicted in d, f are representative of two independent experiments.
Along with its degradative functions, the lysosome serves as the platform for nutrient signaling via the mechanistic target of rapamycin complex 1 (mTORC1), which must localize to the lysosome surface1,19 and requires an intact lysosomal membrane in order to be activated16. Treatment with LLOMe led to a rapid decrease in mTORC1 signaling as measured by phosphorylation of downstream targets p70S6K and 4EBP1 (Fig. 2c) in HPDE cells, while PDA cells retained mTORC1 signaling activity in the presence of LLOMe (Fig. 2c; Extended Data 2h). Similarly, a 4-fold lower dose of LLOMe was sufficient to suppress mTORC1 signaling in HPDE cells, compared to PDA cells (Extended Data 2i).
Lysosomal membrane disruption is accompanied by rapid recruitment of ESCRT machinery that facilitates membrane repair13,14. ESCRT proteins are organized into sub-complexes; ESCRT III proteins (CHMPs 1–7 and IST1) are responsible for mediating membrane constriction and fission whereas ALIX (ESCRT II) facilitates recruitment of ESCRT III components to the site of damage13,14. LLOMe, Silica or hypertonic sucrose treatment showed that HPDE cells rapidly recruit ALIX to lysosomes (Extended Data 3a–c). In contrast, identically treated KP4 cells showed a significant delay in ALIX recruitment (Extended Data 3a–c). Similarly, LLOMe treatment lead to rapid requirement of ESCRT III proteins CHMP3 and CHMP1A as early as 1min post treatment in HPDE cells but was significantly delayed in PDA cells (Fig. 2d,e; Extended Data 3d,e). Additional markers of lysosomal membrane damage include the Galectins – cytoplasmic proteins that bind to inappropriately exposed glycans on the lumenal side of lysosomal membrane proteins15,17,29,30,31. Within 15min of LLOMe treatment 45% of LAMP2 positive lysosomes in HPDE cells recruited Galectin 3 (GAL3), while only 8% of lysosomes in PDA cells recruited GAL3 (Fig. 2f,g). Similarly, intact lysosomes captured from HPDE cells following treatment with LLOMe for 10 minutes showed higher levels of GAL3, compared to lysosomes purified from identically treated KP4 cells (Extended Data 3f). These findings support the notion that PDA lysosomes display enhanced protection against acute membrane damage compared to their non-PDA counterparts.
Myoferlin is required to maintain lysosome function in PDA cells.
Based on the known membrane repair functions of the Ferlins, we next tested whether lysosomal localization of MYOF could explain the increased stress resistance observed of PDA lysosomes. Suppression of MYOF via shRNA mediated knockdown or CRISPR mediated knockout in PDA cell lines led to lysosomes with aberrant morphology and increased diameter (Fig. 3a; Extended Data 4a–d) – a phenotype commonly associated with lysosome dysfunction32,33. Electron microscopy analysis of PDA cells following knockdown of MYOF confirmed an abundance of enlarged lysosomes which lacked intraluminal content (Fig. 3b). This phenotype is distinct from general inhibition of lysosome digestion following treatment with lysosomotropic agents (Chloroquine), V-ATPase inhibitors (BafA1)34 or knockdown of MiT/TFE transcription factors6, which commonly result in distended lysosomes filled with undigested, electron-dense content. Consistent with this idea, MYOF deficient lysosomes were unable to accumulate intraluminal Lysotracker dye (Extended Data 4e). Importantly, MYOF loss triggered a spontaneous lysosomal membrane stress response, associated with constitutive localization of ESCRT proteins ALIX, CHMP3 and CHMP1A to LAMP1 positive lysosomes (Fig. 3c,d; Extended Data 4f).
Fig. 3 |. MYOF is essential for lysosome function in PDA cells.
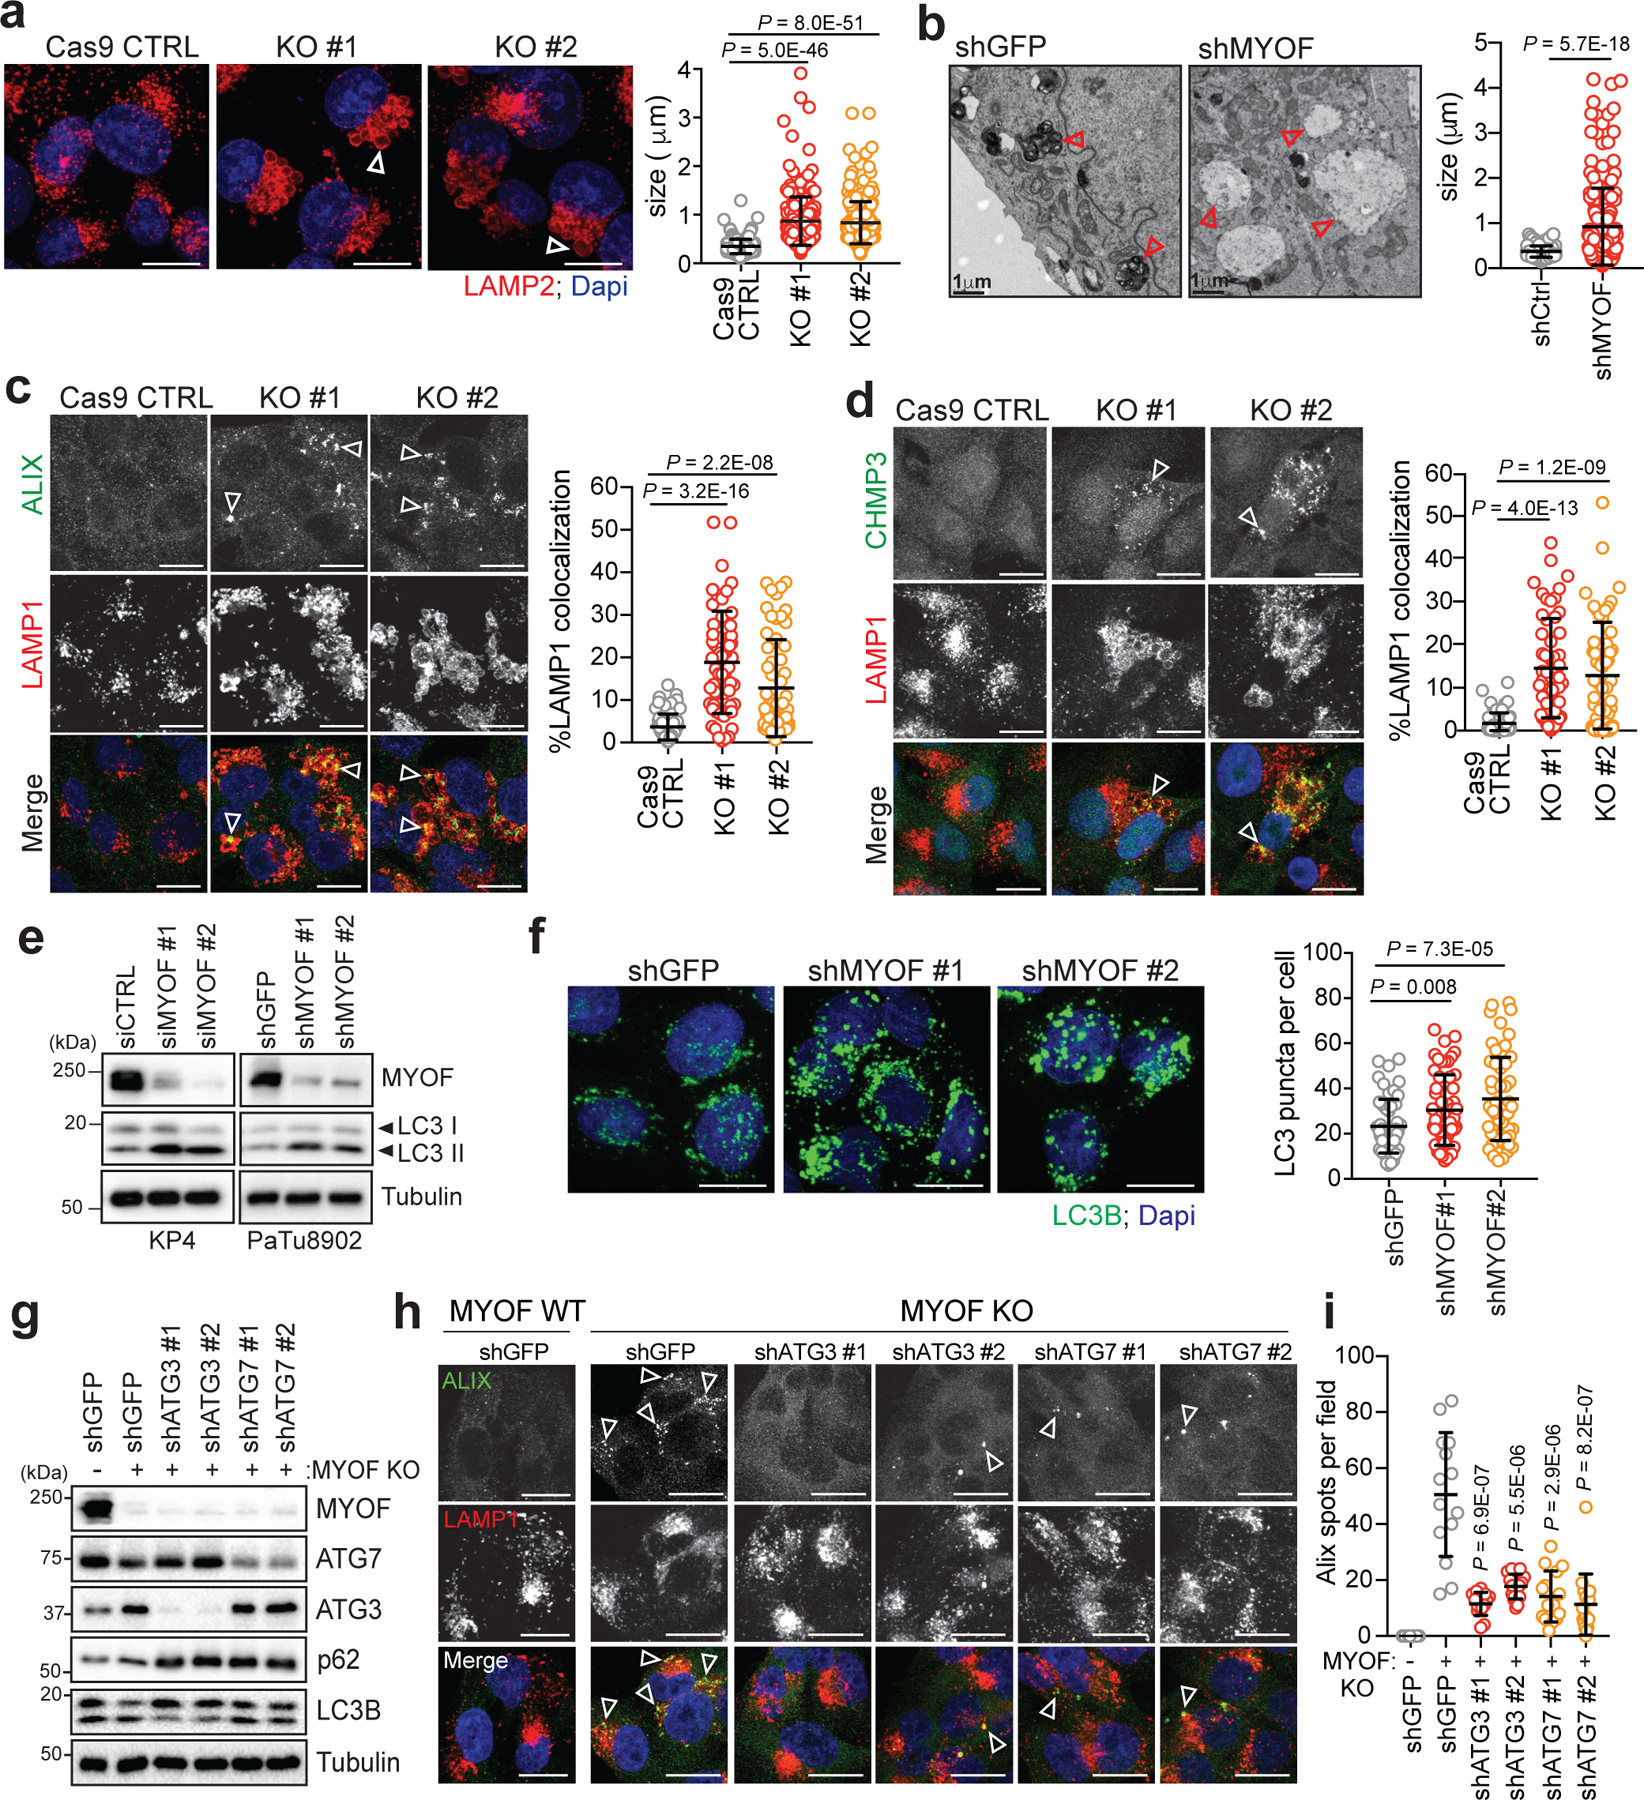
a. Immunofluorescence staining of LAMP2 (red) following CRISPR mediated knockout of MYOF and Cas9 control KP4 cells. Graph at right shows measurement of lysosome diameter from n = 252 (Cas9 control), 251 (KO#1, KO#2). b. Representative electron microscopy images showing aberrant lysosome morphology in KP4 cells following shRNA mediated knockdown of MYOF. Arrowheads highlight differential lysosome morphology in shGFP versus shMYOF conditions. Graph on the right shows quantification of lysosome diameter (n = 200 lysosomes from control; n = 202 lysosomes from MYOF KD cells). Scale bar 1μm. c, d. Increased recruitment of ALIX (green; arrowheads) (c) and CHMP3 (green; arrowheads) (d) to LAMP1 positive lysosomes (red) following KO of MYOF in KP4 cells relative to Cas9 control cells. Graphs show the quantification of percentage ALIX (n = 60 fields per condition) and CHMP3 (n = 57 fields per condition) co-localization with LAMP1. e. Immunoblot showing increased LC3B lipidation (arrowheads) in KP4 and 8902 cells upon siRNA or shRNA mediated knockdown of MYOF. f. Immunofluorescence staining for LC3B (green) showing increase accumulation of LC3B positive autophagosomes in KP4 cells following shRNA mediated knockdown of MYOF compared to control cells. Graph on the right shows quantification of LC3B puncta (n = 14 fields/condition). g. Immunoblot confirming shRNA mediated knockdown of ATG3 and ATG7 and autophagy blockade in KP4 MYOF KO cells. h. Recruitment of ALIX (green; arrowheads) to lysosomes (LAMP1; red) in KP4 cells in the presence (WT; n = 14) and absence (KO; n = 14) of MYOF. shRNA mediated knockdown of ATG3 (n = 14 (#1), 15 (#2) fields per condition) or ATG7 (n = 15 (#1), 16 (#2) fields per condition) to suppress autophagy causes a decrease in lysosome localization of ALIX in MYOF KO cells. i. Graph on the right shows quantification of ALIX puncta per condition. Scale, 20μm. Data are mean ± s.d. P values determined by unpaired two-tailed t-tests. Statistics source data are provided in Source data. Unmodified blots are provided in Source Data Figure 3. Experiment depicted in g are representative of two independent experiments.
Lysosomal recruitment of ESCRT proteins can also counter loss of membrane tension following endo-lysosome damage28. Based on this finding, we tested whether the constitutive recruitment of ESCRT to MYOF KO lysosomes reflects a loss of membrane tension. Consistent with this hypothesis, a fluorescent reporter of membrane tension, Lyso-Flipper28,35,36, indicated a decrease in lysosome membrane tension following knockdown of MYOF in KP4, consistent with a membrane stabilizing action of MYOF (Extended Data 4g,h). Similarly, in MYOF KO KP4 cells, while not statistically significant, a similar decrease in lysosome membrane tension was seen relative to Cas9 control cells (Extended Data 4i). This loss of membrane tension further sensitized MYOF KO lysosomes to LLOMe induced permeabilization as shown by increased recruitment of GAL3 (Extended Data 4j).
Together, the altered lysosome morphology, lack of Lysotracker dye retention, decrease in lysosome membrane tension and constitutive recruitment of ESCRT proteins suggests that MYOF serves to protect against lysosome dysfunction in PDA cells. Accordingly, knockdown of MYOF caused a marked accumulation of lipidated LC3B (Fig. 3e) and increased LC3B-positive puncta (Fig. 3f; Extended Data 4k) as well as delayed clearance of macropinocytosed albumin, indicating defective lysosomal proteolysis (Extended Data 4l). Moreover, loss of MYOF also led to reduced baseline mTORC1 signaling as measured by phosphorylation of p70S6K and 4EBP1, which was suppressed further following treatment with LLOMe (Extended Data 4m). These data support a role for MYOF in maintenance of lysosome integrity, catabolism and signaling in PDA cells.
The increased cargo trafficking characteristic of PDA cells may create a unique dependency on MYOF to maintain membrane stability and efficient lysosome function. Therefore, reducing the incoming flux of membrane trafficking should decrease the dependency of PDA cells on MYOF. To explore this idea, we tested whether blocking autophagosome formation and trafficking via knockdown of ATG3 or ATG7 might prevent the lysosomal membrane stress observed in MYOF KO cells. Autophagy suppression in MYOF KO cells led to accumulation of p62 and unlipidated LC3B-I (Fig. 3g) and resolved the lysosome stress response induced by MYOF loss, as indicated by reduced ALIX, CHMP3 and CHMP1A recruitment to LAMP1 positive lysosomes (Fig. 3h,i; Extended Data 5a–c). These data suggest that the elevated vesicle trafficking characteristic of PDA cells imparts heightened stress on the lysosome in order to fuse, process and clear incoming cargo; this stress is counteracted by increased expression and lysosomal targeting of MYOF.
Inducible lysosome targeting of MYOF is sufficient to protect against acute membrane damage.
To test whether MYOF is sufficient to protect against LLOMe-mediated damage, we generated a heterodimerization system (FKBP-FRB) to inducibly recruit a variant of MYOF lacking its C-terminal transmembrane domain (MYOFΔTM), to the lysosome membrane of non-PDA cells lacking MYOF (Fig. 4a,b). U2OS cells were first engineered to stably express FKBP conjugated to the C-terminus of the lysosomal membrane protein TMEM192 (T192-Flag-FKBP)37,38, which we confirmed localizes to LAMP2 positive lysosomes (Fig. 4c). These cells were then transiently transfected with MYOFΔTM conjugated to FRB* (referred to as MYOF-FRB*). In the absence of the chemical dimerizer AP21967 (AP)37,38, MYOF-FRB* was cytoplasmic (Fig. 4d; top) in T192-Flag-FKBP expressing U2OS cells. Upon treatment with AP, MYOF-FRB* was massively recruited to LAMP2 positive lysosomes (Fig. 4d; bottom). Without AP treatment, addition of LLOMe to U2OS cells led to recruitment of ALIX (Fig. 4e) and GAL3 (Extended Data 6a) to lysosomes as expected. However, following addition of AP and recruitment of MYOF-FRB* to lysosomes, recruitment of ALIX and GAL3 to lysosomes was significantly reduced in response to LLOMe (Fig. 4e; Extended Data 6a). These data suggest that targeting MYOF to the membrane of non-PDA lysosomes is sufficient to confer protection against chemically induced membrane damage.
Fig. 4 |. The N terminal C2 domains of MYOF are required for membrane protection.
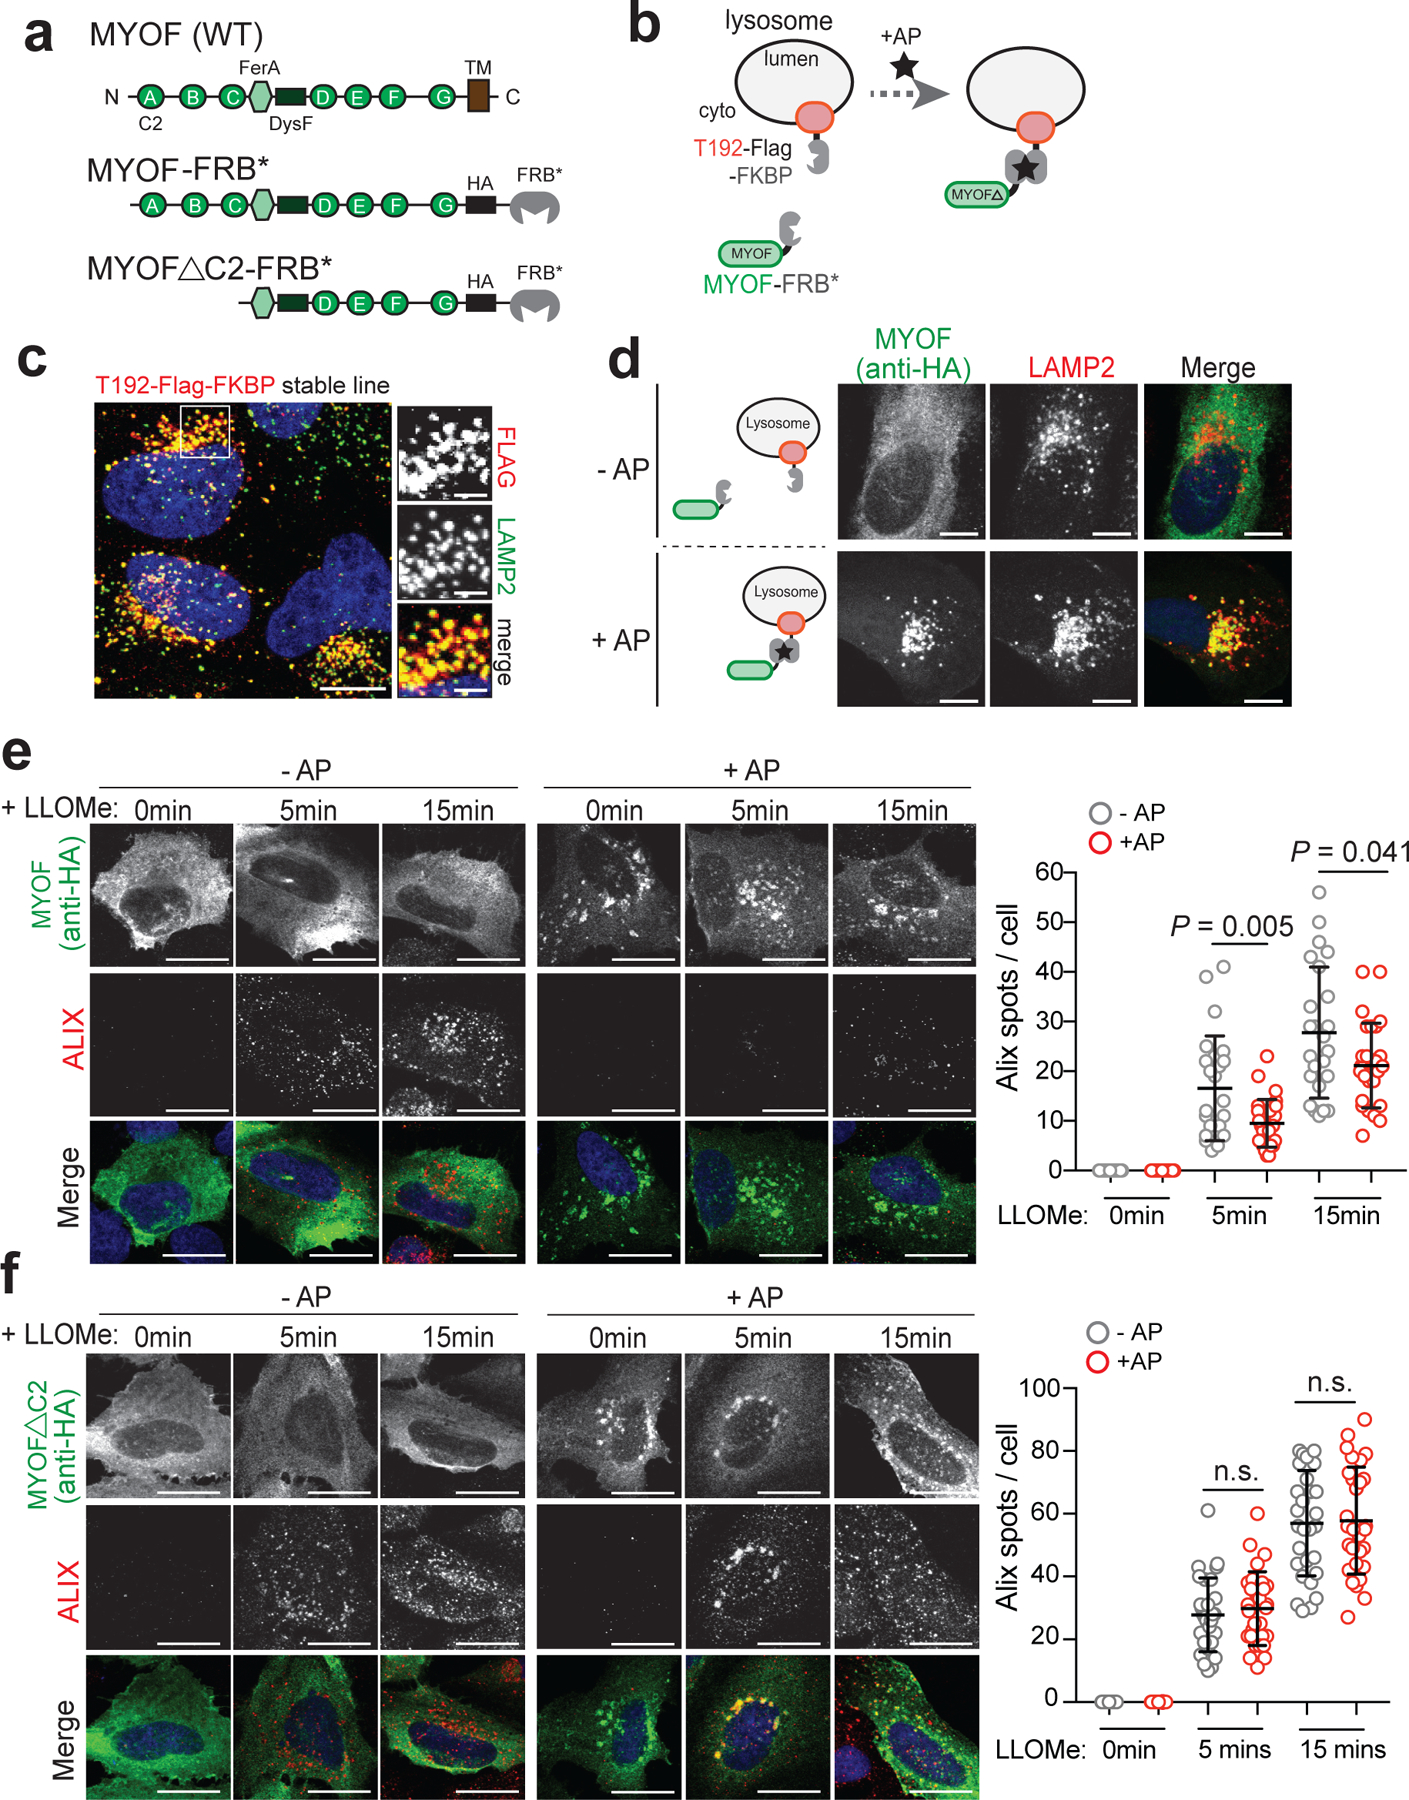
a. Domain structure of MYOF and MYOF-FRB* variants. b. Schematic showing heterodimerization of MYOF-FRB* to lysosome membrane anchored T192-Flag-FKBP following addition of the rapalogue (AP21967; AP). TM, transmembrane domain. c. Lysosomal localization of T192-Flag-FKBP (Flag) in stably expressing U20S cells. d. Transient expression of MYOF-FRB* (MYOF; detected with anti-HA antibody) in U20S cells stably expressing T192-Flag-FKBP. In the absence of AP, MYOF-FRB* is cytoplasmic while upon AP addition MYOFΔTM is recruited to LAMP2 positive lysosomes (red). e. Recruitment of MYOF-FRB* protects against LLOMe induced damage and ALIX recruitment. U20S-T192-Flag-FKBP expressing cells transfected with MYOF-FRB* were treated with LLOMe for the indicated time points in the absence of AP (- AP; n = 30, 24, 24 cells per time point) or presence of AP (+ AP; n = 30, 27, 27 cells per time point), followed by immuno-staining for HA (green) and ALIX (red). f. U20S-T192-Flag-FKBP cells transfected with MYOFΔC2-FRB were treated as in ‘e’ (- AP n = 29 cells per time point; + AP n = 29 cells per time point) followed by immuno-staining for HA (green) and ALIX (red). Lysosomal recruitment of MYOFΔC2 does not protect against LLOMe induced ALIX recruitment. Graphs at right show quantification of ALIX spots per cell in response to LLOMe. Scale for all panels, 20μm. Data are mean ± s.d. P values determined by unpaired two-tailed t-tests. Statistics source data are provided in Source data.
The first three C2 domains of MYOF have been shown to bind membrane lipids, alter their distribution39,40 and recruit accessory proteins41, thereby functioning as key mediators of its membrane resealing activity. We tested whether a variant of MYOF lacking these C2 domains (MYOFΔC2) would lead to loss of membrane protection following LLOMe-mediated damage in U2OS cells. Unlike MYOF-FRB*, AP mediated lysosome recruitment of MYOFΔC2-FRB* was unable to prevent LLOMe-induced damage, as shown by unchanged ALIX and GAL3 staining irrespective of the AP dimerizer (Fig. 4f; Extended Data 6b). These data establish the N-terminal C2 domains of MYOF as mediating its protective function at the lysosome.
Loss of MYOF leads to impaired in vivo tumour growth.
We next determined the impact of MYOF loss on PDA growth in vitro and in vivo. Similar to human PDA cell lines (Fig. 1g), tumours isolated from a genetically engineered mouse model of PDA (p48-Cre;LSL-KrasG12D;Trp53L/+; referred to here as KPC)42 expressed Myof at higher levels than normal pancreas and liver, and comparable to mouse C2C12 muscle cells (Fig. 5a). Dysf also showed higher levels in KPC tumours relative to normal pancreas (Fig. 5a). Importantly, Myof expression was restricted to CK19 positive tumour epithelia and did not show significant overlap with α-SMA positive stromal cells (Fig. 5b). CRISPR mediated knockout of Myof in murine KPC cells43 led to accumulation of LC3B-II, reduced accumulation of Lysotracker dye and reduced in vivo growth following transplantation in syngeneic hosts (Extended Data 7a–f). Similarly, suppression of MYOF in human KP4 cells significantly reduced colony forming ability (Fig. 5c) and in vivo tumour growth (Fig. 5d,e). Resected MYOF KO tumours also showed an accumulation of LC3B positive structures indicative of delayed autophagic clearance (Fig. 5f) and a decrease in proliferation as measured by Ki67 staining (Fig. 5g). Together these data strongly support a critical role for MYOF as a lysosomal membrane protein essential for maintenance of organelle function during tumour growth in vivo.
Fig. 5 |. MYOF is required for PDA tumour growth.
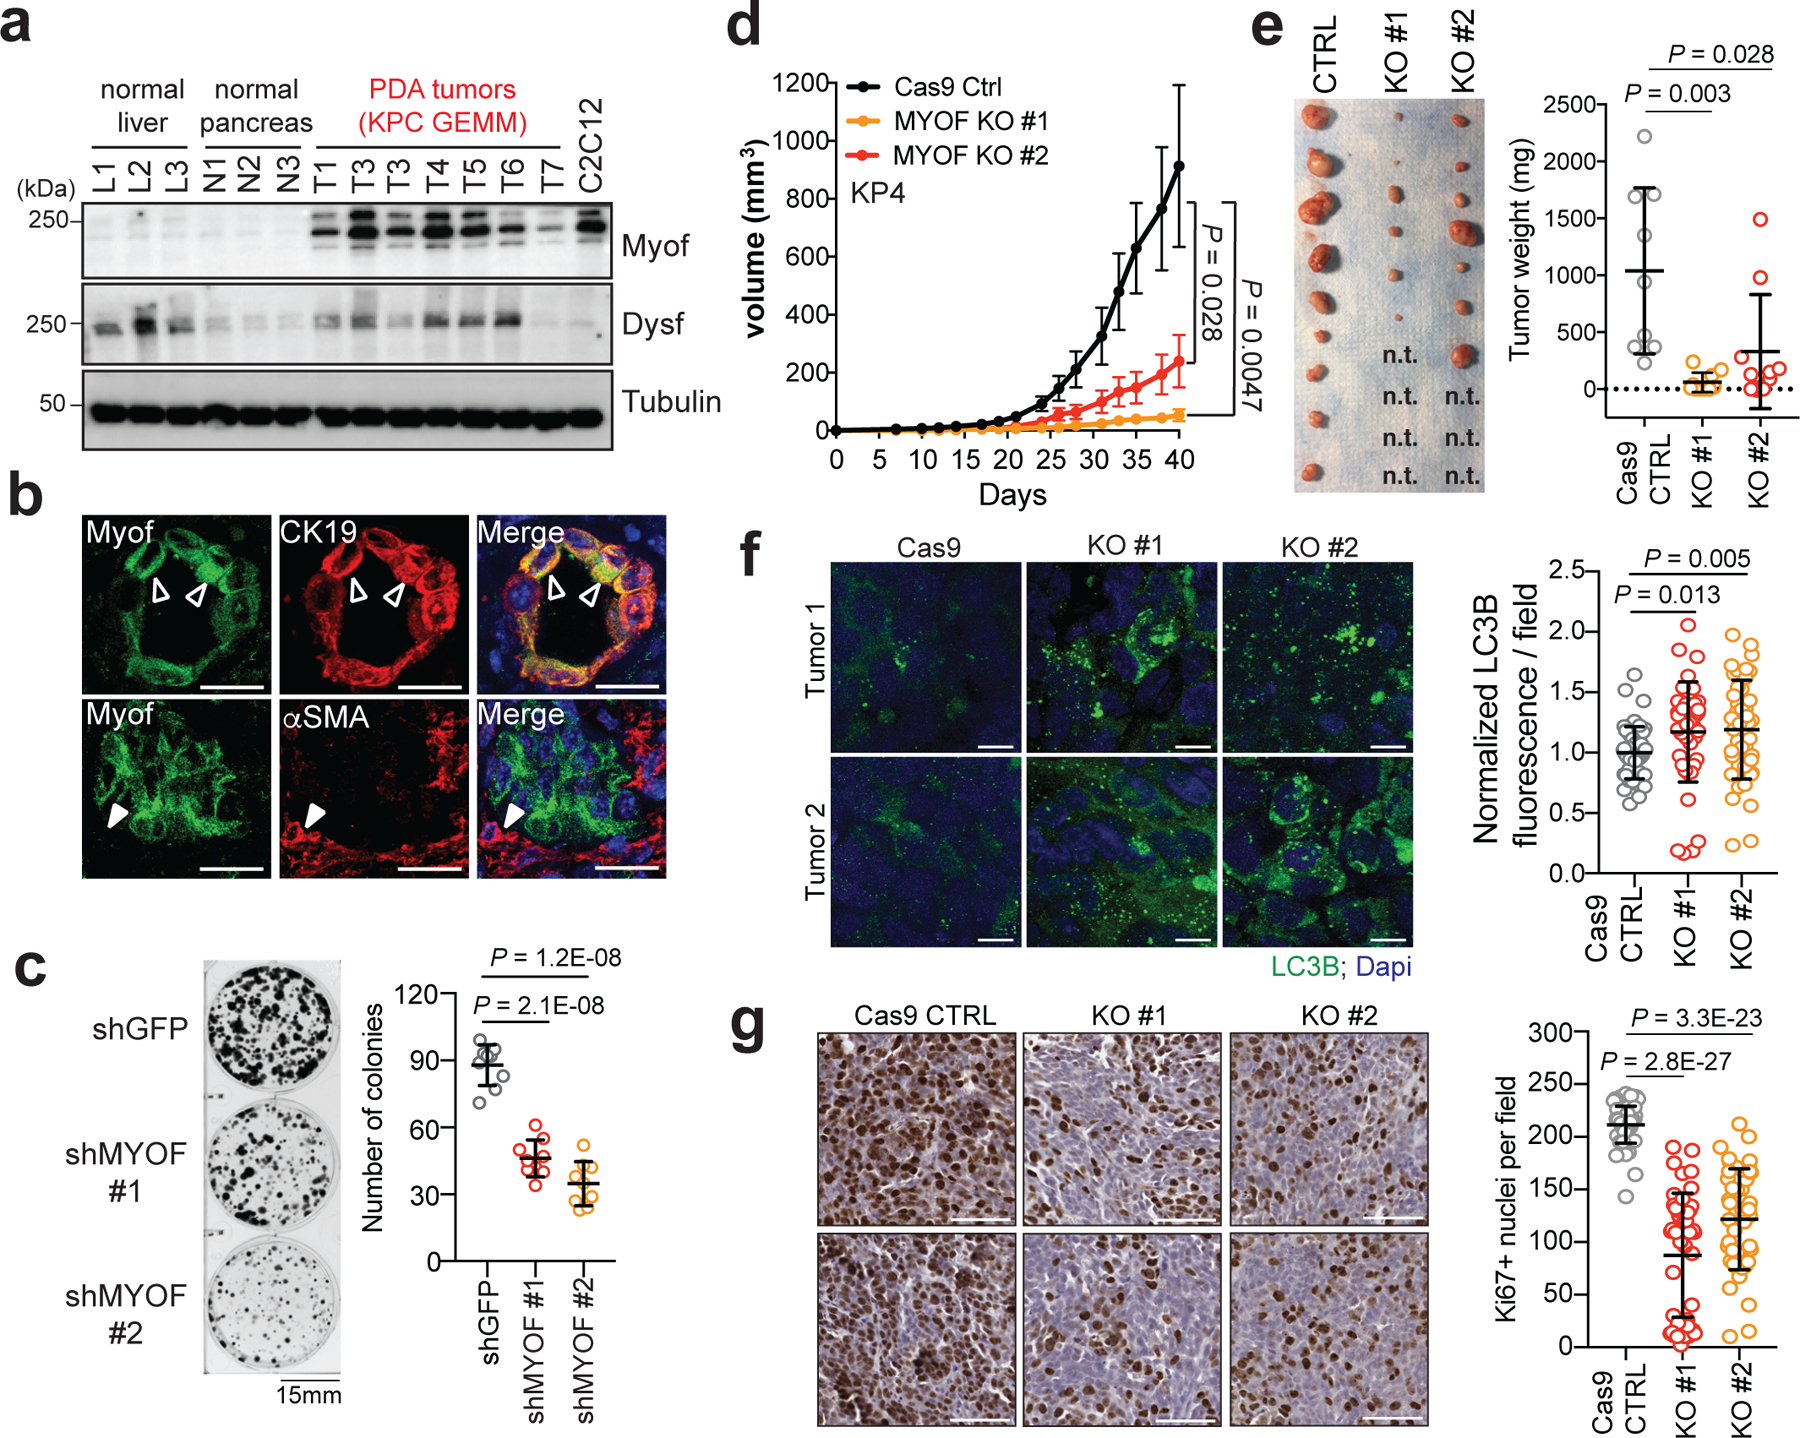
a. Expression levels of Myof and Dysf in mouse KPC derived PDA tumours (n = 7 mice) relative to normal liver (n = 3 mice), normal pancreas (n = 3 mice) and the mouse myoblast cell line, C2C12. b. Immuno-fluorescence staining of Myof (green), the epithelial marker CK19 (red; top) and the stromal marker α-SMA (red, bottom) in mouse KPC tumours (representative images of n = 2 independent tumors) showing co-localization of Myof with CK19 (open arrowheads) but not α-SMA (close arrow heads). Scale, 50μm. c. Colony formation of shGFP or shMYOF infected KP4 cells. Graph shows quantification of colony area per condition from n = 9 independent experiments. d. In vivo growth in nude mice of s.c. KP4 xenografts following CRISPR mediated KO of MYOF. N = 9 (CTRL), 10 (KO#1), 10 (KO#2) tumours per group. Error bars represent s.e.m. e. Images (left) and tumour weight (right) of control and MYOF KO KP4 xenografts resected at day 42. n.t. no macroscopic tumour identified upon resection. f. Immunostaining for LC3B in resected tumors (n = 4 tumors per group) showing increased staining in the KO tumors. Graph shows quantification of LC3B staining in Cas9 control tumors (n = 48 fields), MYOF KO#1 (n = 44 fields) and MYOF KO#2 (n = 45 fields). Scale, 20μm. g. Ki67 staining of control and MYOF KO xenografts. Graph shows quantification of Ki67 positive nuclei from Cas9 control tumors (n = 56 fields) from 4 tumors, MYOF KO#1 (n=46 fields), MYOF KO#2 (n = 46 fields) from 3 tumours per group. Scale, 100 μm. Data are mean ± s.d. P values determined by unpaired two-tailed t-test. Statistics source data are provided in Source data. Unmodified blots are provided in Source Data Figure 5.
MYOF is upregulated in patient PDA and high levels dictate worse prognosis.
Analysis of publicly available patient PDA datasets showed that MYOF transcript levels were significantly higher in human PDA tumours relative to normal pancreas or adjacent non-neoplastic tissue (Fig. 6a), consistent with our findings in human and mouse cell lines and tumors, respectively. In contrast, DYSF levels were modestly higher in only 2 of 4 human PDA tumour datasets (Extended Data 8). Interestingly, analysis of patient tumor datasets from 3 additional common cancer types – colorectal cancer, non-small cell lung cancer and breast – did not show a consistent upregulation of MYOF or DYSF relative to normal tissue (Extended Data 9), suggesting a PDA specific role for MYOF.
Fig. 6 |. High MYOF expression levels correlate with aggressive disease.
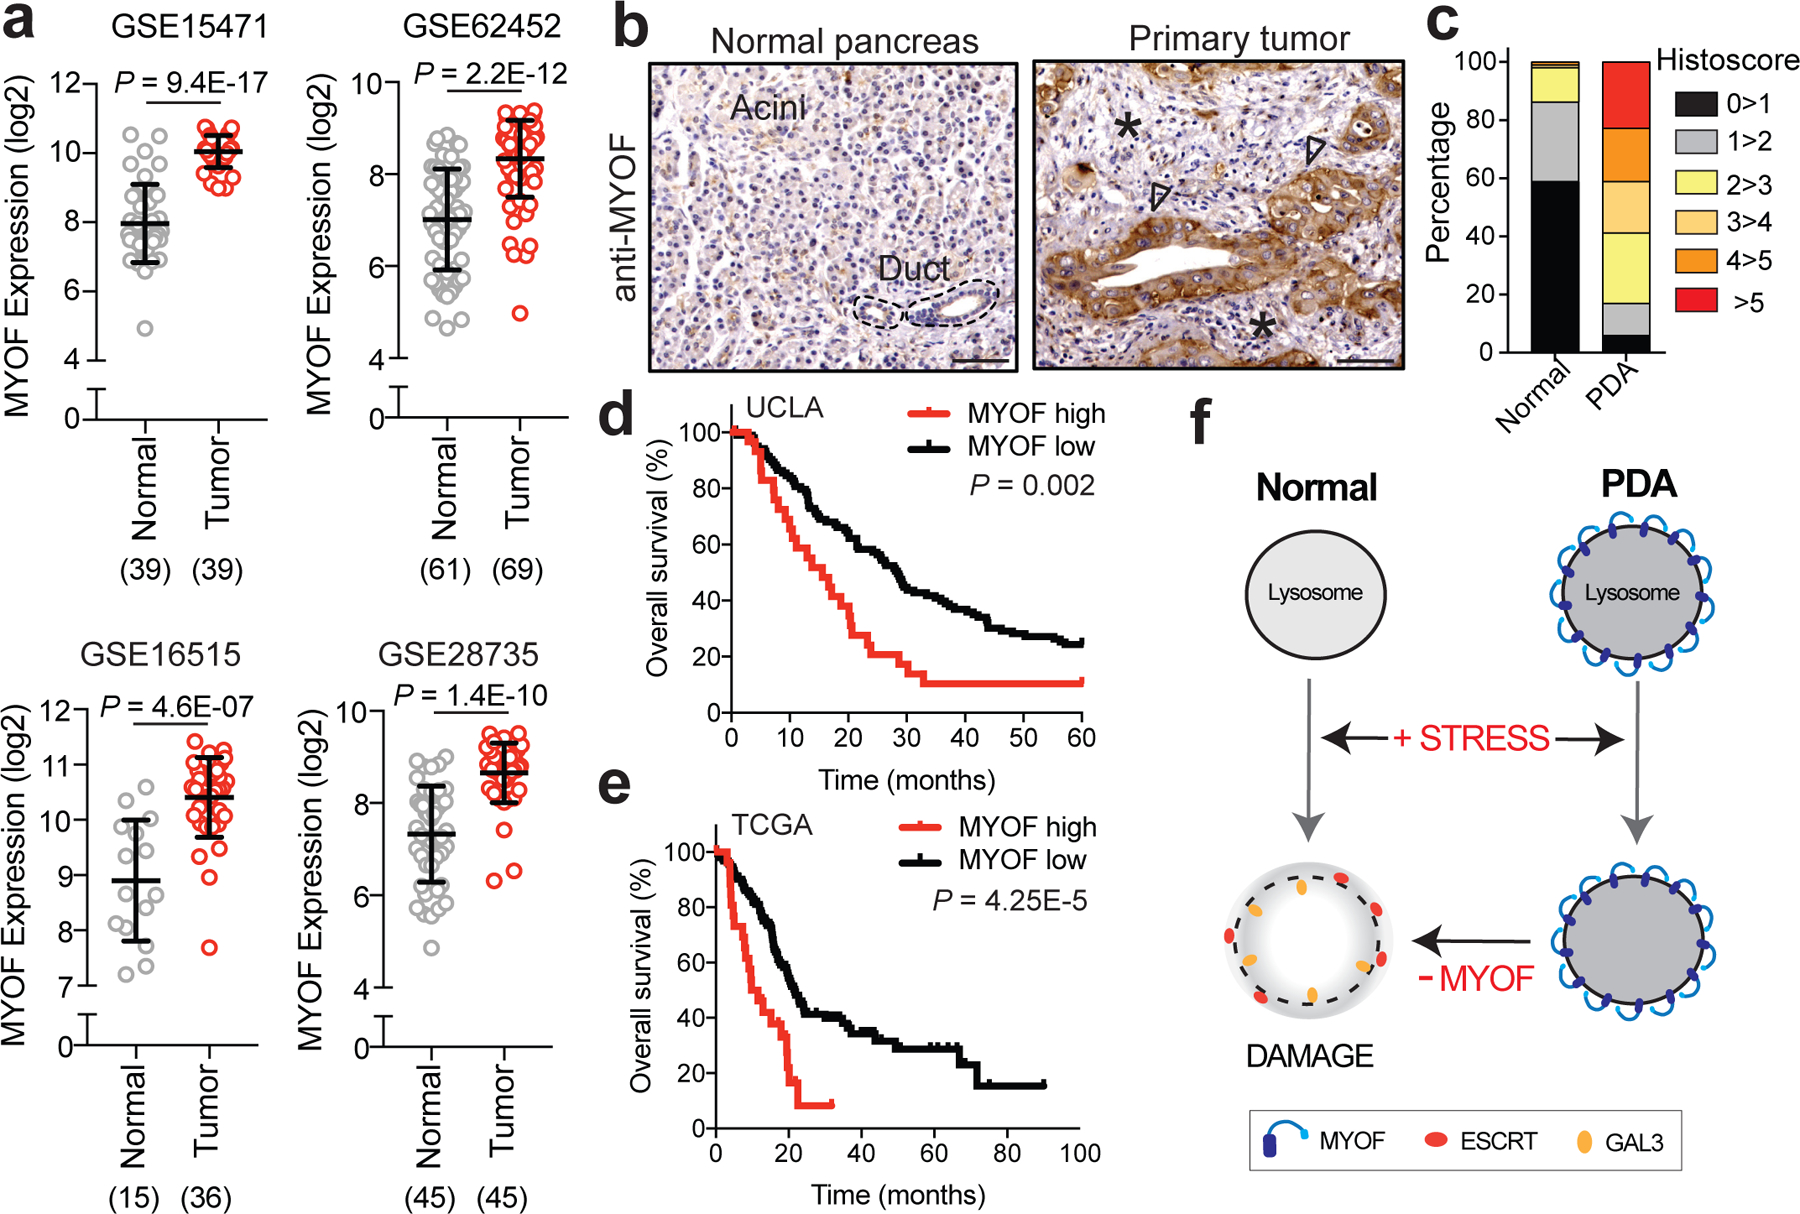
a. MYOF transcript levels in human PDA specimens and normal pancreas (adjacent non-neoplastic tissue) from the indicated datasets. The number of samples are indicated under each graph in parentheses. b. Immuno-histochemistry showing increased expression of MYOF in primary patient PDA tumour epithelia (arrowheads) compared to normal pancreas or adjacent stroma (asterisk). Scale, 100μm. c. Percentage distribution of semi-quantitative histoscore of MYOF staining across normal adjacent (n = 102 patient samples) and primary PDA (n = 136 patient samples). d, e. High expression of MYOF predicts shorter overall survival in two patient cohorts. N = 136 patients in the UCLA cohort (MYOF high n=31, MYOF low n=105) and n = 185 in The Cancer Genome Atlas (TCGA) cohort (MYOF high; Z score > 1, n = 27 pateint samples; MYOF low Z score < 1, n = 158 patient samples). p-Value calculated by Log-rank test. f. Model comparing lysosomal response to stress in normal (left) and PDA (right) cells. Lysosomal retargeting of MYOF in PDA cells provides protection against membrane stress caused by increased rates of vesicular traffic. Loss of MYOF renders PDA lysosomes more vulnerable to damage. Data are mean ± s.d. P values determined by unpaired two-tailed t-tests. Statistics source data are provided in Source data.
Consistent with increased MYOF mRNA levels in patient PDA, semi-quantitative immunohistochemical analysis revealed significantly increased MYOF protein expression in patient-matched neoplastic versus non-neoplastic epithelium (n = 102, P < 2.2×10⁻²⁵) with average histoscores of 3.95 ± 2.3 versus 0.57 ± 0.82, respectively. Further dichotomization (histoscores >5 versus ≤5) revealed high MYOF in 23% of PDA versus 0% of adjacent normal pancreas, (n = 102; P < 0.0001) (Fig. 6b,c). No significant associations were noted between high MYOF PDA and clinicopathologic parameters except for a significant correlation with female gender (P = 0.008; Supplementary Table 3). Notably, high MYOF PDA was associated with worse overall survival in univariate analysis (hazard ratio = 2.03; 95% CI = 1.29–3.19; Supplementary Table 4a) with a median overall survival of 19.4 months compared to 32 months for patients with low MYOF PDA (log rank P = 0.002, Fig. 6d). High MYOF expression was also an independent predicator of worse overall survival in multivariate Cox regression analysis (Supplementary Table 4b). High MYOF expression similarly correlated with worse overall survival in an independent PDA patient cohort from The Cancer Genome Atlas (Fig. 6e). Together, these analyses support a role for MYOF and enhanced lysosome function as predictors of shortened survival in PDA patients.
Discussion
Our findings demonstrate that PDA lysosomes are intrinsically more capable of withstanding membrane stress than lysosomes in normal cells. Retargeting of MYOF, a known plasma membrane repair factor, to the lysosomal membrane is critical for this ability and helps to maintain the structural integrity and pro-tumourigenic activities of this organelle. Lysosomal targeting of MYOF appears to be an adaptive mechanism in response to the increased degradative burden placed on PDA lysosomes by elevated influx of autophagic and macropinocytic vesicle trafficking (Fig. 6f). Consistent with this model, inhibition of autophagy relieves the lysosomal membrane stress that accumulated following MYOF loss.
The nature of the membrane stress that PDA lysosomes undergo may derive from the specific cargo being degraded, such as large protein aggregates, oxidative damage as well as alterations in membrane composition due to continuous vesicle fusion. MYOF may counteract this stress through several mechanisms, including structural stabilization of the lipid bilayer, thus preventing its rupture, or promoting fusion with other vesicles that act as membrane donors to reseal damage that has already occurred. Both mechanisms have been proposed to underlie Ferlin-mediated repair of the plasma membrane of skeletal muscle cells and may operate at the lysosomal membrane in PDA cells as well21,23,24,40.
Our findings also suggest that MYOF either replaces or delays activation of a major membrane repair system mediated by the ESCRT complex. In the simplest model, the membrane-stabilizing action of MYOF may inhibit or delay ESCRT recruitment by preventing the formation of microtears. Consistent with this idea, loss of MYOF in PDA cells triggers spontaneous ESCRT recruitment to the lysosome. ESCRT recruitment also occurs in response to a decrease in membrane tension28 and our findings using a fluorescent membrane-tension probe indicate that loss of MYOF leads to a decrease in lysosome membrane tension and constitutive ESCRT recruitment. More direct mechanisms of MYOF mediated ESCRT regulation may also occur, such as competition for a common binding partner. Alternatively, MYOF may represent a protective mechanism in cells highly reliant on the lysosome for growth. Given that ESCRT proteins have diverse functions at multiple cellular locations12, a dedicated lysosomal program may confer more efficient monitoring and maintenance of lysosomal health.
Accordingly, loss of MYOF leads to severe lysosomal dysfunction and significantly impairs PDA tumour growth in vivo, establishing a critical role for this protein in promoting the pro-oncogenic functions of the lysosome in cancer. PDA cells rely on lysosomes as a source of metabolites2 and the lysosome regulates levels of essential micronutrients including iron44,45 and calcium46 that can be exchanged with other organelles in the cell including the ER47,48 and mitochondria44,45. Thus, lysosome dysfunction following MYOF loss could indirectly impact additional organelles and cellular metabolic processes. In line with this hypothesis, prior studies49,50 showed that MYOF loss in cancer cells caused respiratory defects in mitochondria, an organelle where MYOF is not found. However, whether MYOF is necessary for lysosomal function in additional cancers remains unknown, as its upregulation relative to normal tissue appears to be unique to PDA. This finding may reflect a unique reliance on the lysosome in PDA cells or suggest that alternative mechanisms for maintaining organelle membrane integrity12 or differences in organelle composition51 exist in different cancer types. Accordingly, high MYOF expression distinguishes a cohort of patient PDA tumours that predict worse overall survival.
Our findings highlight unique features of PDA cancer lysosomes and identify a dedicated protective mechanism essential for maintenance of lysosomal health. Blocking this protective function of MYOF may pave the way for future lysosome-centered strategies for inhibiting PDA.
Methods
Cell culture and reagents.
The cell lines HPDE, PaTu8988T, KP4, MiaPaca, Panc0203, PaTu8902, Panc1, HPAFII, YAPC, Panc0327, Panc1005, Capan2 were obtained from the American Type Culture Collection (ATCC) or the DSMZ. Cells were cultured in the following media: PaTu8988T, KP4, MiaPaca, PaTu8902, Panc1, HPAFII, YAPC, Capan2, HEK293T in DMEM supplemented with 10% FBS; Panc0203, Panc0327, and Panc1005 in RPMI with 10% FBS; HPDE cells were cultured in keratinocyte serum-free (KSF) medium supplemented by epidermal growth factor and bovine pituitary extract (Life Technologies, Inc., Grand Island, NY). U2OS cells were cultured McCoy’s 5a Medium with 10% FBS. Cell lines were regularly tested and verified to be mycoplasma negative using MycoAlert Detection Kit (Lonza) and culture media contained 10% penicillin/streptomycin.
FC1245 cells were established from Pdx1-Cre+, KrasLSL-G12D/+, Trp53lR172H/+ mice that were backcrossed into a C57BL/6 background and were a gift from David Tuveson (CSHL). Murine PDA cells were maintained in DMEM (Corning) supplemented with 10% FBS (Atlanta Biologicals S11550H) and 1% Pen/Strep (Gibco). Cells were grown in a humidified incubator with 5% CO2 at 37°C. Cultures were routinely verified to be negative for mycoplasma by PCR. Cell lines were authenticated by fingerprinting, and low passage cultures were carefully maintained in a central lab cell bank. L-leucyl-L-leucine methyl ester (L7393) and Bafilomycin A1 (B1793) were purchased from Sigma and used at 1mM concentration and 100nM respectively. Concentrated stock solutions were prepared in dimethyl sulfoxide (DMSO) and stored at −80 °C in single-use aliquots. Silica nanoparticles (cat.no. tlrl-sio; InvivoGen, San Diego, CA, USA) were suspended in ultrapure water according to manufactures instructions and diluted in complete growth medium to 100 μg/ml. The resulting suspension was added to sub-confluent cells on glass coverslips coated with fibronectin, and cells were incubated for indicated times and fixed for immunofluorescence analysis. For hypertonic shock, 0.5M sucrose was made in complete growth medium and cells were incubated for the indicated time points. Lysotracker Red-DND-99 (L7528) was purchased from Thermo scientific and used at 75nM. DQ-BSA purchased from Thermo scientific (D12050). Stock solutions of Magic Red (no. 938; ImmunoChemistry Technologies, Bloomington, MN, USA) were prepared in DMSO according to the manufacturer’s instructions and stored at −20°C. A working stock of Magic red reagent was added to sub-confluent cells on glass coverslips for 60 mins at 37°C. Following incubation, media was removed and cells were rinsed with PBS and fixed with 4% PFA. Fluorescence intensity was measured from independent fields. Colony formation was assessed following plating of 2,000 cells per well (Control and MYOF knockdown) in six well plate which were fixed with 4% paraformaldehyde and stained with 0.1% crystal violet after 14 days of growth.
Constructs.
pcDNA3.1-Myoferlin-HA and peGFP-hGalectin-3 was purchased from Addgene (plasmid no. 22443 and 73080 respectively). T192-RFP-3xHA - was generated by subcloning the cDNA of TMEM192 (Origene) together with monomeric Red Fluorescent Protein (mRFP) and 3xHA tag into the Nhe1 and EcoR1 sites of pLJM1 lentiviral vector (addgene plasmid no. 134631) as previously described1. To generate MYOFΔTM-HA-FRB*, first an AgeI cut-site was knocked into the pcDNA3.1-Myoferlin-HA plasmid immediately prior to the transmembrane domain by site-directed mutagenesis (Agilent: 210518). Second, a gBlock (IDT) containing HA fused to FRB* was subcloned into the AgeI and KpnI sites of MYOF-HA (Addgene plasmid, #22443) to generate MYOFΔTM-HA-FRB* (referred to as MYOF-FRB*). MYOFΔC2 was generated via PCR amplification from the MYOF-FRB* parent vector. The T192-FLAG-FKBP was a gift from Roberto Zoncu at UC Berkeley.
shRNAs and siRNAs
shRNA vectors (pLKO.1 puro) were obtained from the Sigma MISSION TRC shRNA library. The sequences and RNAi Consortium clone IDs for the shRNAs used are as follows: shMYOF#1 (human): 5’- GAAAGAGCTGTGCATTATAAA-3’ (TRCN0000320397); shMYOF#2 (human): 5’- GAAAGAGCTGTGCATTATAAA-3’ (TRCN0000001522); shATG3#1 (human): 5’-GATGTGACCATTGACCATATT-3’ (TRCN0000148120); shATG3#2 (human): 5’-GCTGTCATTCCAACAATAGAA-3’ (TRCN0000147381); shATG7#1 (human): 5’-CCCAGCTATTGGAACACTGTA-3’ (TRCN0000007587); shATG7#2 (human): 5’-GCCTGCTGAGGAGCTCTCCAT-3’ (TRCN0000007584); shGFP: 5’-TGCCCGACAACCACTACCTGA-3’ (TRCN0000072186). Pre-designed silencer select siRNAs against MYOF were ordered from Thermo Fischer (Cat# 4392420). shGFP was used as the control hairpin.
Lentiviral-mediated knockdown
For the transfection of lentiviral vectors (pLKO.1-puro), lentivirus was produced by co-transfection of HEK293T cells with a lentiviral vector and the packaging plasmids psPAX2 (Addgene, plasmid #12260) and pMD2.G (Addgene, plasmid #12259) at a 0.5:0.25:0.25 ratio. Transfection was performed using X-tremeGENE transfection (6365787001; Sigma Aldrich) reagent according to the manufacturer’s instructions. The viral supernatant was collected 48h after transfection and filtered through a 0.45 μm filter. Cells were infected with virus-containing media using Polybrene reagent (TR-1003-G; EMD Millipore) according to the manufacturer’s instructions and selected for 48 hr in 2 μg/mL of puromycin.
Immunoblotting
Cells were lysed in ice-cold lysis buffer (150 mM NaCl, 20 mM Tris [pH 7.5], 1 mM EDTA, 1 mM EGTA, 1% Triton X-100, 2.5 mM sodium pryophosphate, 1 mM β-glycerophosphate, 1 mM sodium vanadate, and one tablet of Pierce Protease Inhibitor Tablets, EDTA Free [Fisher Scientific-A32965] per 10 mL). Protein content was measured using Pierce BCA Protein Assay Kit (Life Technologies-23227), and 20–30 μg protein was resolved on 10 or 12% protein gels using SDS-PAGE and transferred onto PVDF membranes (EMD MIllipore-IPVH00010). Membranes were blocked in 5% bovine serum albumin (BSA, Sigma Aldrich-A4503) made up in Tris-buffered saline with 0.2% Tween 20 (TBS-T) prior to incubation with primary antibody overnight at 4°C in 5% bovine serum albumin. Membranes were washed in TBS-T and developed after 1h incubation in species-specific horseradish peroxidase-conjugated secondary antibody, visualized using supersignal west pico chemiluminescent substrate (Fisher Scientific-34080), and imaged using the ChemiDoc XRS + System (Biorad). Antibodies used for immunoblotting are listed in Supplementary Table 5.
RNA isolation and quantitative RT-PCR
Total RNA extraction was performed using the PureLink RNA Mini Kit (12183025; Thermo Fisher). Reverse transcription was completed using the iScript Reverse Transcription Supermix (1708841; Bio-Rad) followed by quantitative RT–PCR with iTaq Universal SYBR Green Supermix (1725122; Bio-Rad) using CFX384 Touch Real Time PCR Detection System (BioRad).
Primer Sequence
MYOF Fwd : 5’AGCCGGATCCTATCGTTTCT-3’
MYOF Rev : 5’-AATCCTGTGGCTTGTTGGAC-3’
DYSF Fwd : 5’-AAGAACAGCGTGAACCCTGTA −3’
DYSF Rev : 5’-CCTCTCGAGTGGGACCTT-3’
Lysosome Immunoprecipitation.
For lysosome immunoprecipitation experiments, human PDA or HPDE cell lines stably expressing T192-mRFP-3xHA were lysed and intact lysosomes were immunoprecipitated using anti-HA-conjugated Dynabeads (Thermo Sci. 88837). Briefly, cells were seeded in a 15cm plate at a density appropriate for them to reach confluency after 24h. Media was removed, cell monolayers were rinsed with ice-cold KPBS buffer (136 mM KCl, 10m M KH2PO4, pH 7.25, supplemented with Pierce protease inhibitor tablets), scraped into 10 ml of KPBS and collected by centrifugation at 1500 rpm for 5 min. Pelleted cells were resuspended in a total volume of 1ml KPBS (supplemented with 50 mM sucrose) and fractionated via dounce homogenization followed by centrifugation at 2700 rpm for 10 min. Post-nuclear supernatant was harvested and incubated with 50 μl of anti-HA magnetic beads with end-over-end rotation for 20 min. Lysosome-bound beads were washed two times with KPBS supplemented with 150 mM NaCl and once with KPBS. Lysosomal immuno-precipitates were eluted from beads using 0.1% NP-40 in KPBS for 30 min at 37°C and quantified by Pierce BCA Protein Assay Kit. Equal protein amounts from each elution fraction were used for mass spectrometry-based proteomics or immunoblotting.
For Proteinase K (Sigma P.2308) digestion experiments, digestion was performed when lysosomes were bound to anti-HA-beads. Increasing concentrations of Proteinase K (0.1, 0.5, 1, 2.5ug/ml) in Proteinase K buffer (33.3mM Hepes, 1mM CaCl2, pH:7.4) was added to lysosomes bound to anti-HA beads for 15min on ice. Digestion was terminated with 2mM phenylmethylsulfonyl fluoride (final concentration). Equal protein amounts from each elution fraction were used for immunoblotting.
Mass Spectrometry
Samples were precipitated using trichloroacetic acid and resuspended in a Tris/ Urea buffer, reduced, alkylated and digested with trypsin at 37°C overnight. This solution was subjected to solid phase extraction to concentrate the peptides and remove unwanted reagents prior to injection onto a Shimadzu HPLC and fraction collector equipped with a self-packed Aeris PEPTIDE XB-C18 analytical column (10 cm by 2.1 mm, Phenomenex). Peptides were eluted using standard reverse-phase gradients and pH=10 ammonium formate buffers with a total of 12 fractions collected across the analytical gradients. The resulting fractions were combined followed by injection onto a Waters NanoAcquity HPLC equipped with a self-packed Aeris 3 μm C18 analytical column 0.075 mm by 20 cm, (Phenomenex). The effluent from the column was analyzed using a Thermo Orbitrap Elite mass spectrometer (nanospray configuration) operated in a data dependent manner for the 120 minutes. The resulting fragmentation spectra were correlated against the known database using PEAKS Studio 8.5 (Bioinfomatic Solutions). Scaffold Q+S (Proteome Software; version 4.8.2) was used to provide consensus reports for the identified proteins.
Proteomics Analysis
For comparative analysis between HEK293T and PaTu8988T lysosome elutes, minimum peptide abundance was set to 1 for all replicates. Fold changes between experimental samples were then calculated, and the significance of these fold changes were calculated using a two-tailed unpaired t-test. Data in all volcano plots are displayed as the log2 of the fold change, and the -log10 of the p-value. A list of ≥2 fold significantly enriched (p-value ≤0.05; Log2 fold change ≥ 1) proteins present in PDA lysosome elutes was analyzed for significantly overrepresented gene ontology (GO) terms (Biological Processes) and biological pathways (KEGG) using g:Profiler g:GO St tool52 and The Database for Annotation, Visualization and Integrated Discovery (DAVID; version 6.8).
Surface Biotinylation assay
The cell surface of KP4 cells and MYOF-HA expressing HEK293T cells was biotinylated on ice using 0.5 mg/ml of EZ-Link™ Sulfo-NHS-SS-Biotin (Thermo Scientific: 21331) for 30min. Cells were washed twice with 20mM Glycine in HBSS on ice to remove excess biotin. Subsequently, cells were lysed in Biotinylation Lysis Buffer (1% Triton X-100, 130mM NaCl, 2.5mM MgCl2, 2mM EGTA, 25mM HEPES, pH 7.4, supplemented with protease inhibitor prior to use) on ice for 30min. Lysates were clarified by centrifugation at 13,300 rpm for 10min at 4˚C and supernatants were transferred to a new tube. Lysates were quantified by Pierce BCA Protein Assay Kit and equal amounts (~1mg) of protein were incubated with 100μl of triple-washed Dynabeads™ MyOne™ Streptavidin C1 beads (Invitrogen: 65002) for 2–3h with constant agitation. Beads and captured materials were washed twice in Wash Buffer 1 (2% SDS in dH2O), once in Wash Buffer 2 (0.1% deoxycholate, 1% Triton X-100, 500mM NaCl, 1mM EDTA, and 50mM HEPES, pH 7.5), once in Wash Buffer 3 (250mM LiCl, 0.5% NP-40, 0.5% deoxycholate, 1mM EDTA, and 10mM Tris, pH 8.1), and twice in Wash Buffer 4 (50mM Tris, pH 7.4, and 50mM NaCl). Washes were performed at RT for 5min with gentle agitation. Samples were eluted by boiling in Laemlli buffer.
FRB-FKBP heterodimerization assay.
U2OS cells stably expressing T192-Flag-FKBP were grown on coverslips and transiently transfected with either MYOF-FRB* or MYOFΔC2-FRB* using X-tremegene 9 DNA Transfection Reagent (Roche). After 24h, dimerization was induced by adding 100nM of AP21967 (Takara: 635056) for 1h to cells. Coverslips were then washed twice prior to treated with 1mM LLOME for the indicated timepoints. Cells were subsequently fixed for immunofluorescent staining.
Immunofluorescence
Human cells were cultured for two days on coverslips coated with fibronectin. After two PBS washes, cells were fixed with paraformaldehyde for 15min at room temperature or with ice-cold methanol for 5min at −20°C. PFA fixed cells were permeabilized with 0.1% Saponin or 0.3% Triton X-100 for 5min. Samples were then blocked with 5% normal goat serum for 15min at room temperature prior to incubation with primary antibodies overnight at 4°C (Supplementary Table 1). After washing three times with PBS, cells were incubated in secondary antibody (diluted 1:400 in PBS) at room temperature for 30min. Slides were mounted on glass slides using DAPI Fluoromount-G (0100–20, SouthernBiotech) and imaged on a Zeiss Laser Scanning Microscope (LSM) 710 using a 63x objective. Image processing and quantification were performed using ImageJ. For DQ-BSA experiments, cells were incubated with 200μg DQ-BSA for 3h and subsequently chased for 3h in DQ-BSA free media. Where indicated, treatment with BafA1 was for 1h at 100nM. The number of DQ-BSA spots co-localizing with LAMP2 positive lysosomes was quantified. For experiments requiring exposure to LLOMe, silica nanoparticles, hypertonic sucrose or Lysotracker, coverslips were bathed in medium containing the appropriate reagent as indicated, prior to fixing and staining. Measurement of colocalization was conducted using thresholded images using the image calculator function in Image J. Overlapping pixels in the red and green channels were measured and percentage overlap calculated from a minimal of 10 fields per condition. For measuring total cell fluorescence, analysis was performed on a per cell basis using Image J. Mean fluorescence intensities for each cell was determined by subtracting the mean fluorescence of the background in each image. Antibodies used for immunofluorescence are listed in Supplementary Table 5.
Fluorescence Lifetime Imaging Microscopy (FLIM).
The cells were grown on 35 mm glass bottom dishes (Mattek Corporation, P35G-0.170 14-C). 24 h after seeding, cells were incubated for 30min with 1μM Lyso Flipper53 in fluorobrite medium (Gibco, 21083027) supplemented with 10% FCS (without FCS for HPDE) for 30min before imaging. For live imaging, cells were maintained at 37°C and 5% CO2 in a micro-incubator (Okolab, Pozzuoli NA, Italy). LLOMe was used at 1mM. For FLIM imaging, a 100× 1.45 NA oil DIC Plan-Apochromat VC objective (Nikon) with a Nikon A1 scanning confocal microscope was used. Excitation was performed using a pulsed laser at 485 nm (PicoQuant, LDH-D-C-485) at 20 MHz, and the emission signal was collected between 550 and 650 nm using a gated PMA hybrid detector and a TimeHarp 260 Nano Dual TSCPC unit. FLIM images were analyzed using the magic wand tool in SymPhoTime 64 software (PicoQuant) and corresponding pixels were fitted with a dual exponential reconvolution model whereby the lifetime τ1 was extracted. Data are expressed as means ± SD.
Generation of Myoferlin knockout cell lines using CRISPR/Cas9
Myoferlin knockouts in KP4, Patu8902 and FC1245 cells were generated using the RNP-electroporation method as previously described (Liang et al., 2015). One million cells were electroporated using the Amaxa 4D Nucleofector kit (V4XC-9064, Lonza). Guide RNA and Cas9 complexes were pre-formed using 160μM crRNA annealed to 160μM tracrRNA (Dharmacon) and incubated with 40μM Cas9 protein (purchased from University of California, Berkeley). Cutting efficiency was assessed 48h post-electroporation using PCR and sanger sequencing. Myoferlin knockout was confirmed using quantitative RT-PCR and immunoblotting after clonal expansion of single cells.
Guide RNA Sequences (5’−3’):
Mouse Myoferlin exon 3 - TGACTT GAG GGG GAT ACC AC
Mouse Myoferlin exon 4 - CTC CCT GAA GGA CCT GAT TG
Human MYOFERLIN exon 1 – TTT CGT TTT AGG GAT ATT GC
Human MYOFERLIN exon 3 – ATT TTG GAG TTT GAC TTG AG
PCR Primer Sequences (5’−3’):
Ms Myof Ex3 Fwd – tgagtcagaggtttggtgaccc
Ms Myof Ex3 Rev – cagactcgtgacggctgagtat
Ms Myof Ex4 Fwd – agccaaagagaggagcatgtgt
Ms Myof Ex4 Rev – tatctcaacctcccaactgccg
Hu MYOF Ex1 Fwd – GGGAGTTCGGTATCAGTTTACA
Hu MYOF Ex1 Rev – CTGGAGAGACTTGGCTTCATC
Hu MYOF Ex 3 Fwd – TCAGCTGCCTTCAGGTTTAG
Hu MYOF Ex3 Rev – CCACATCTGCTATTGGCTTAGA
Histology and immunostaining
Tissue samples were fixed overnight in 10% formalin, and then embedded in paraffin and sectioned (5mm thickness) by the UCSF mouse histopathology core. Haematoxylin and eosin staining was performed using standard methods. Slides were baked at 60°C for a 1h, deparaffinized in xylenes (three treatments, 5 min each), rehydrated sequentially in ethanol (5min in 100%, 5min in 90%, 5min in 70%, 5min in 50%, and 5min in 30%), and washed for 5min in water twice. For antigen unmasking, specimens were cooked in a 10mM sodium citrate buffer (pH 6.0) for 10min at 95°C using conventional pressure cooker, rinsed three times with PBS, incubated for 1h with 3% H2O2 at room temperature to block endogenous peroxidase activity, washed three times with PBS, and blocked with 2.5% goat serum in PBS for 1h. Primary antibodies were diluted in blocking solution and incubated with the tissue sections at 4°C overnight. Specimens were then washed three times for 5min each in PBS and incubated with secondary anti-mouse/rabbit IgG (Vector Laboratories, MP-7500) or fluorescent-conjugated secondary antibodies (1:500) at RT for 1h. Following three washes in PBS, slides were stained for peroxidase for 3min with the DAB (di-aminebenzidine) substrate kit (SK-4100, Vector Laboratories), washed with water and counterstained with haematoxylin or mounted on glass slides using DAPI Fluoromount-G. Bright light images were obtained with a with a KEYENCE BZ-X710 microscope. Fluorescent images were obtained with Zeiss Laser Scanning Microscope (LSM) 710. Antibodies used for immunohistochemistry are listed in Supplementary Table 5.
Human Samples
The pancreatic cancer tissue microarray has been previously described54. Human PDAC specimens were obtained from patients who underwent surgical resection of the primary PDAC tumours. Clinical characteristics of the patients are described in Supplementary Table 3. Samples were collected at UCLA under IRB-approved protocol IRB#11–000512. No selection biases are noted. This study was conducted under strict compliance with institutional ethical regulations. The study had minimal risk per the IRB protocol and thus informed consent was not necessary.
Clinicopathologic variables used for analysis of the TMA were based on the 7th edition of the AJCC/UICC TNM staging system for pancreatic cancer. Immunohistochemical staining for MYOF was conducted using anti-MYOF ab (Sigma; Cat. No HPA014245). Multiple (2–3) 1.0 mm cores for each tumour in the TMA were independently scored for staining positivity by two pathologists (DWD and KWW) using modified histoscores (range 0–9), representing the product of staining intensity (0–3, 0-absent; 1-weak; 2-moderate; 3-strong) and percentage of tumour cell staining (0–3, 0, none; 1, 1–33%; 2, 34–66%; 3, 67–100%). For any core where histoscore differed by more than 2 between the two observers, a revised score was assigned based on consensus evaluation. The average histoscore for both observers was used for subsequent analysis. For dichotomization, each tumour was assigned to either a low (histoscore 0–5) or high (histoscore >5–9) staining group. Survival estimates were generated using the Kaplan-Meier method and compared using log-rank tests. Multivariate Cox proportional hazards models were used to test statistical independence and significance of multiple predictors with backward selection performed using the Akaike Information Criterion. Overall survival time was measured from the date of surgery to the date of death due to any cause or last clinical visit up to 60 months.
PDAC expression data was collected from the following databases: GSE62452, GSE28735, GSE15471, GSE16515, GSE43795. CRC expression data was collected from the following databases: GSE103512, GSE4183, GSE18105, GSE20916. NSCLC expression data was collected from the following databases: GSE19188, GSE18842, GSE33532, GSE31552. Breast cancer expression data was collected from the following databases: GSE42568, GSE29431, GSE10797, GSE103512. P values were calculated by unpaired, two-tailed t-test.
Animal Experiments
All experiments were carried out in a clean conventional facility, under ambient temperature and under standard light/dark cycle. All experiments were approved by the University of California, San Francisco Institutional Animal Care and Use Committee (IACUC) under protocol number AN181382–02. Male and female 8–10 week old C57BL/6 mice or nude mice were purchased from Jackson Laboratory and used for xenograft experiments. For subcutaneous xenografts, 2 million KP4 Cas9 control/MYOF KO or FC1245 Cas9 control/myof KO cells were injected into the flank of nude mice and C57Bl/6 mice respectively (5–6 mice per group). Tumour length and width were measured thrice a week and the volume was calculated according to the formula (length x width2)/2. Mice were euthanized when tumour volume reached 800–1000mm3 and tumours were harvested and submitted for histological examination. Mouse strains were obtained from Jackson Laboratories and kindly provided by colleagues: Ptf1a-Cre (Jax stock no. 019378) mice from C. Wright, LSL-KrasG12D (Jax stock no. 008179) mice from D. Tuveson and T. Jacks and Tp53Lox/Lox (Jax stock no. 008462) mice from A. Berns.
Transmission electron microscopy
KP4 cells (control and Myoferlin knockdown cells) grown on tissue culture plates were fixed in 2.5% glutaraldehyde 0.1M sodium cacodylate buffer, pH 7.4 (EMS, Hatfield, PA, USA) for 30min at room temperature and then gently scraped using a rubber policeman. Cell pellets were stabilized in 1% low melting point agarose, then cut into 1mm cubes. Samples were rinsed (3x; 10min, RT) in 0.1M sodium cacodylate buffer, pH 7.2, and immersed in 1% osmium tetroxide with 1.6% potassium ferricyanide in 0.1M sodium cacodylate buffer for 1 hour. Samples were rinsed (3x; 10min, RT) in buffer and then in distilled water (3x; 10min, RT). Sample were immersed in 0.5% aqueous uranyl acetate en bloc stain for 1h, protected from light and then rinsed in water (3x; 10min, RT). Samples were then subjected to an ascending acetone gradient (10min; 35%, 50%, 70%, 80%, 90%) followed by pure acetone (2x; 10min, RT). Samples were progressively infiltrated while rocking with Epon resin (EMS, Hatfield, PA, USA) and polymerized at 60 °C for 24–48h. Thin sections (70nm) were cut using a Reichert Ultracut E (Leica, Wetzlar, Germany). Sections were then collected onto formvar-coated 200 mesh copper grids. The grids were post-stained with 2% uranyl acetate followed by Reynold’s lead citrate, for 5min each. The sections were imaged using a Tecnai 12 120kV TEM (FEI, Hillsboro, OR, USA) and data recorded using an UltraScan 1000 with Digital Micrograph 3 software (Gatan Inc., Pleasanton, CA, USA).
Statistics and reproducibility
Experimental data were analyzed using GraphPad Prism and excel built-in tests and are indicated in the figure legends. For all graphs, error bars indicate mean ± standard deviation unless otherwise indicated. Numbers of samples analyzed per experiment are reported in the respective figure legends. Results depicted in figures 1f, h, 2c, 3e, 4c, d, 6b, Ext. data figures 1a, c, d, 2h, i, 4a, g are representative of 3 independent biological experimental repeats. Results depicted in figures 1i, g, j, 2d, f, 3g, Ext. data figures 2b, 3f, 4m, 5a, 7a are representative of 2 independent experimental biological repeats.
Extended Data
Extended Data Figure 1 |. MYOF is a novel lysosomal membrane protein in PDA cells.
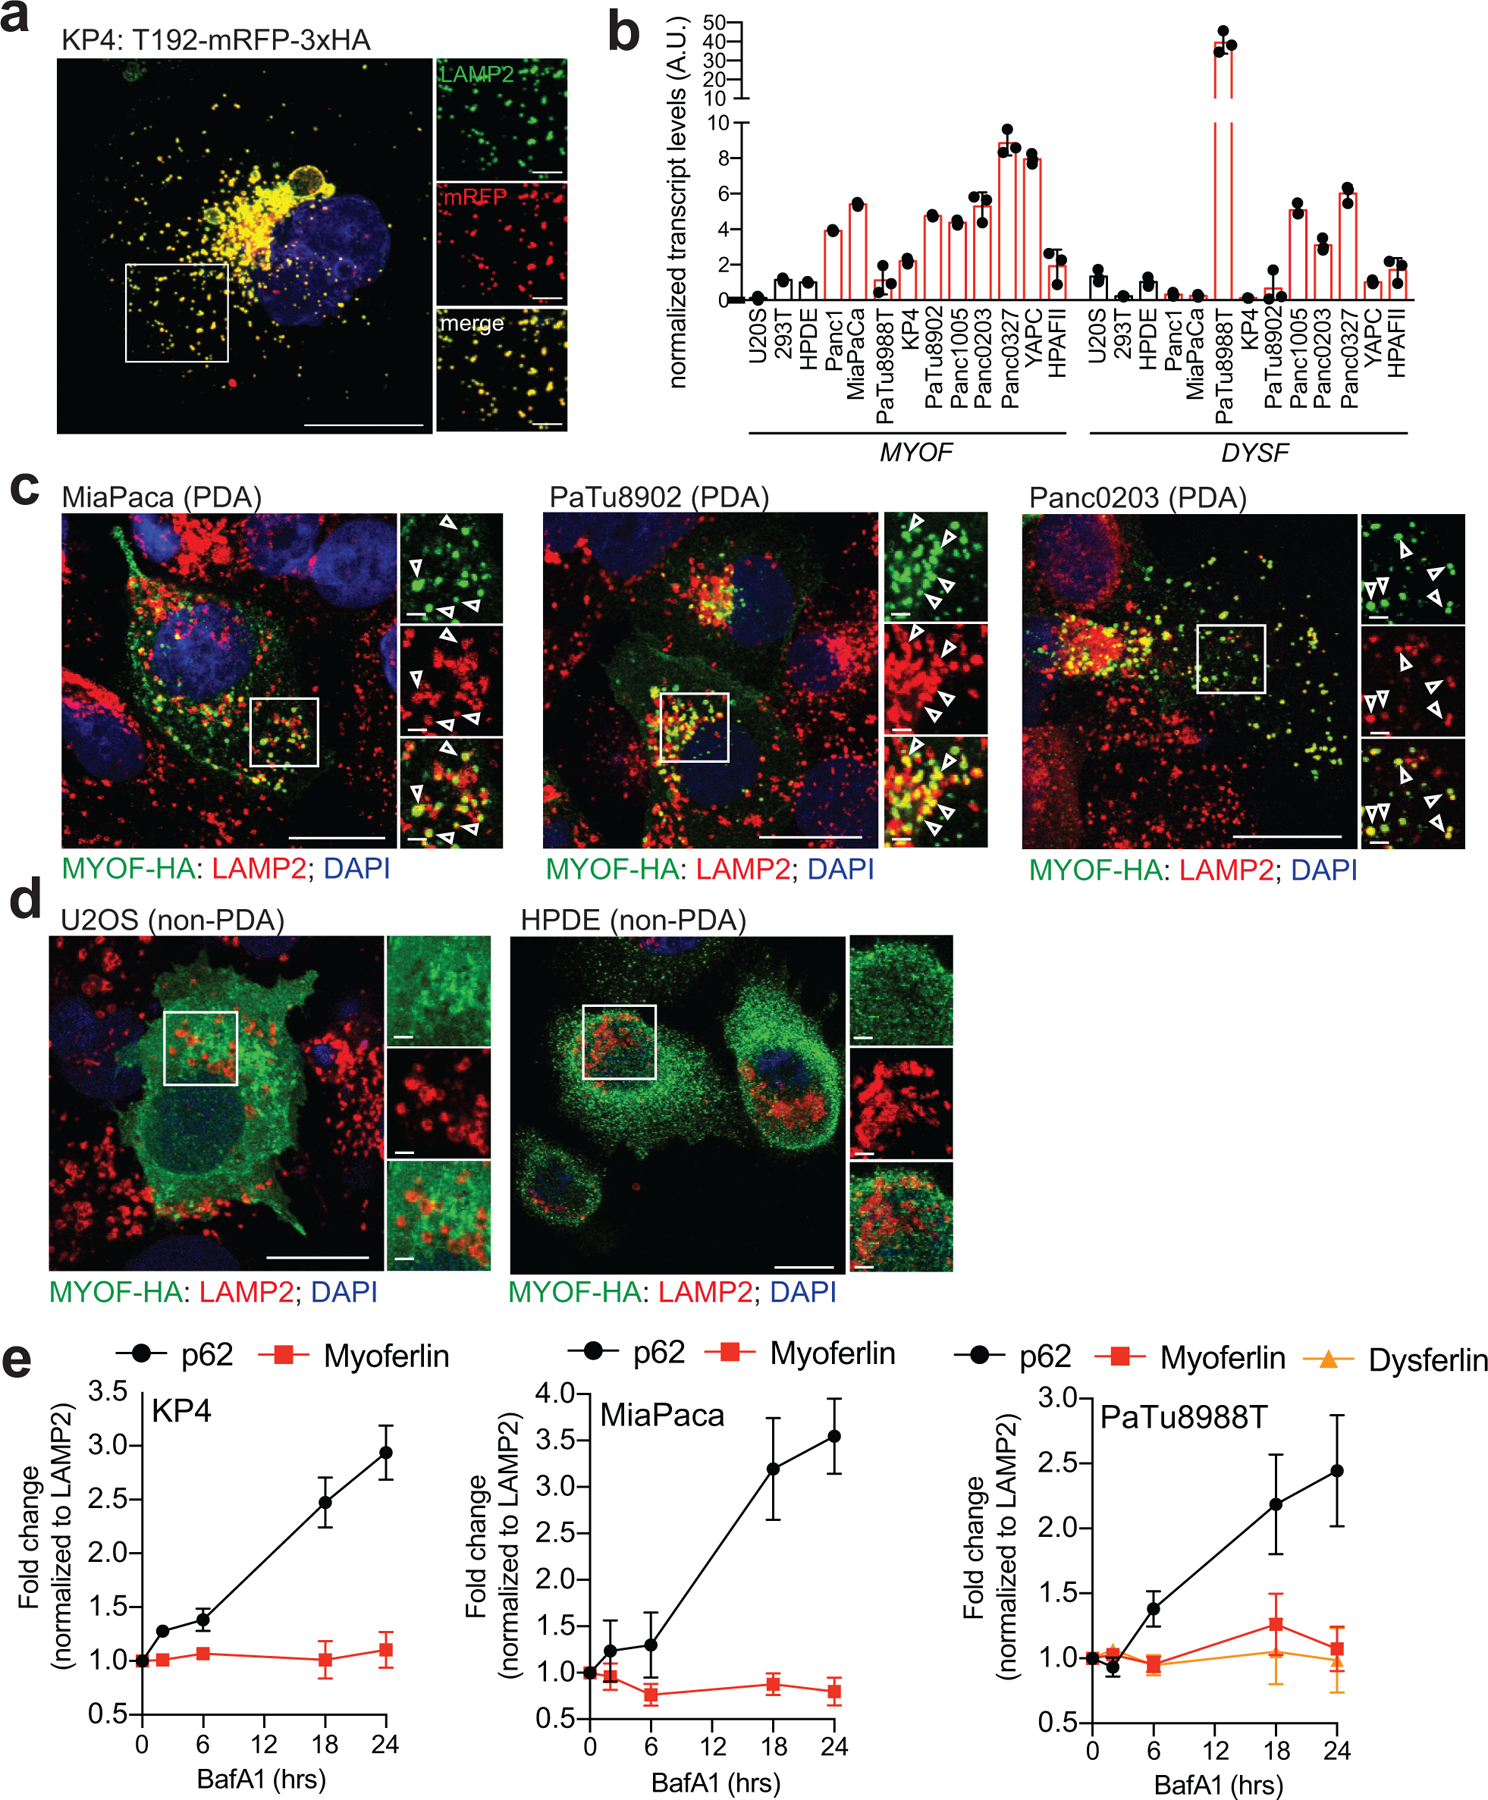
a. Co-localization of T192-mRFP-3xHA and endogenous LAMP2 in KP4 cells. b. qRT-PCR analysis of MYOF and DYSF mRNA levels across 10 human PDA cell lines and 3 non-PDA cell lines. Data is representative of n=3 biological replicates. c,d. Immuno-fluorescence staining of MYOF-HA (green) and LAMP2 (red) in PDA cell lines (MiaPaca, Patu8902 and Panc0203) (c) and non-PDA (U2OS and HPDE) cell lines (d). Arrowheads show examples of co-localization. e. Treatment of KP4, MiaPaCa and PaTu8988T cells with 75nM BafA1 for the indicated times causes an increase in p62 levels but not MYOF or DYSF. Graph shows the quantification of normalized fold change relative to LAMP1, averaged from 3 independent experiments. Data are mean ± s.d. Scale, 20μm for all panels.
Extended Data Figure 2 |. PDA lysosomes are resistant to multiple membrane perturbing agents.
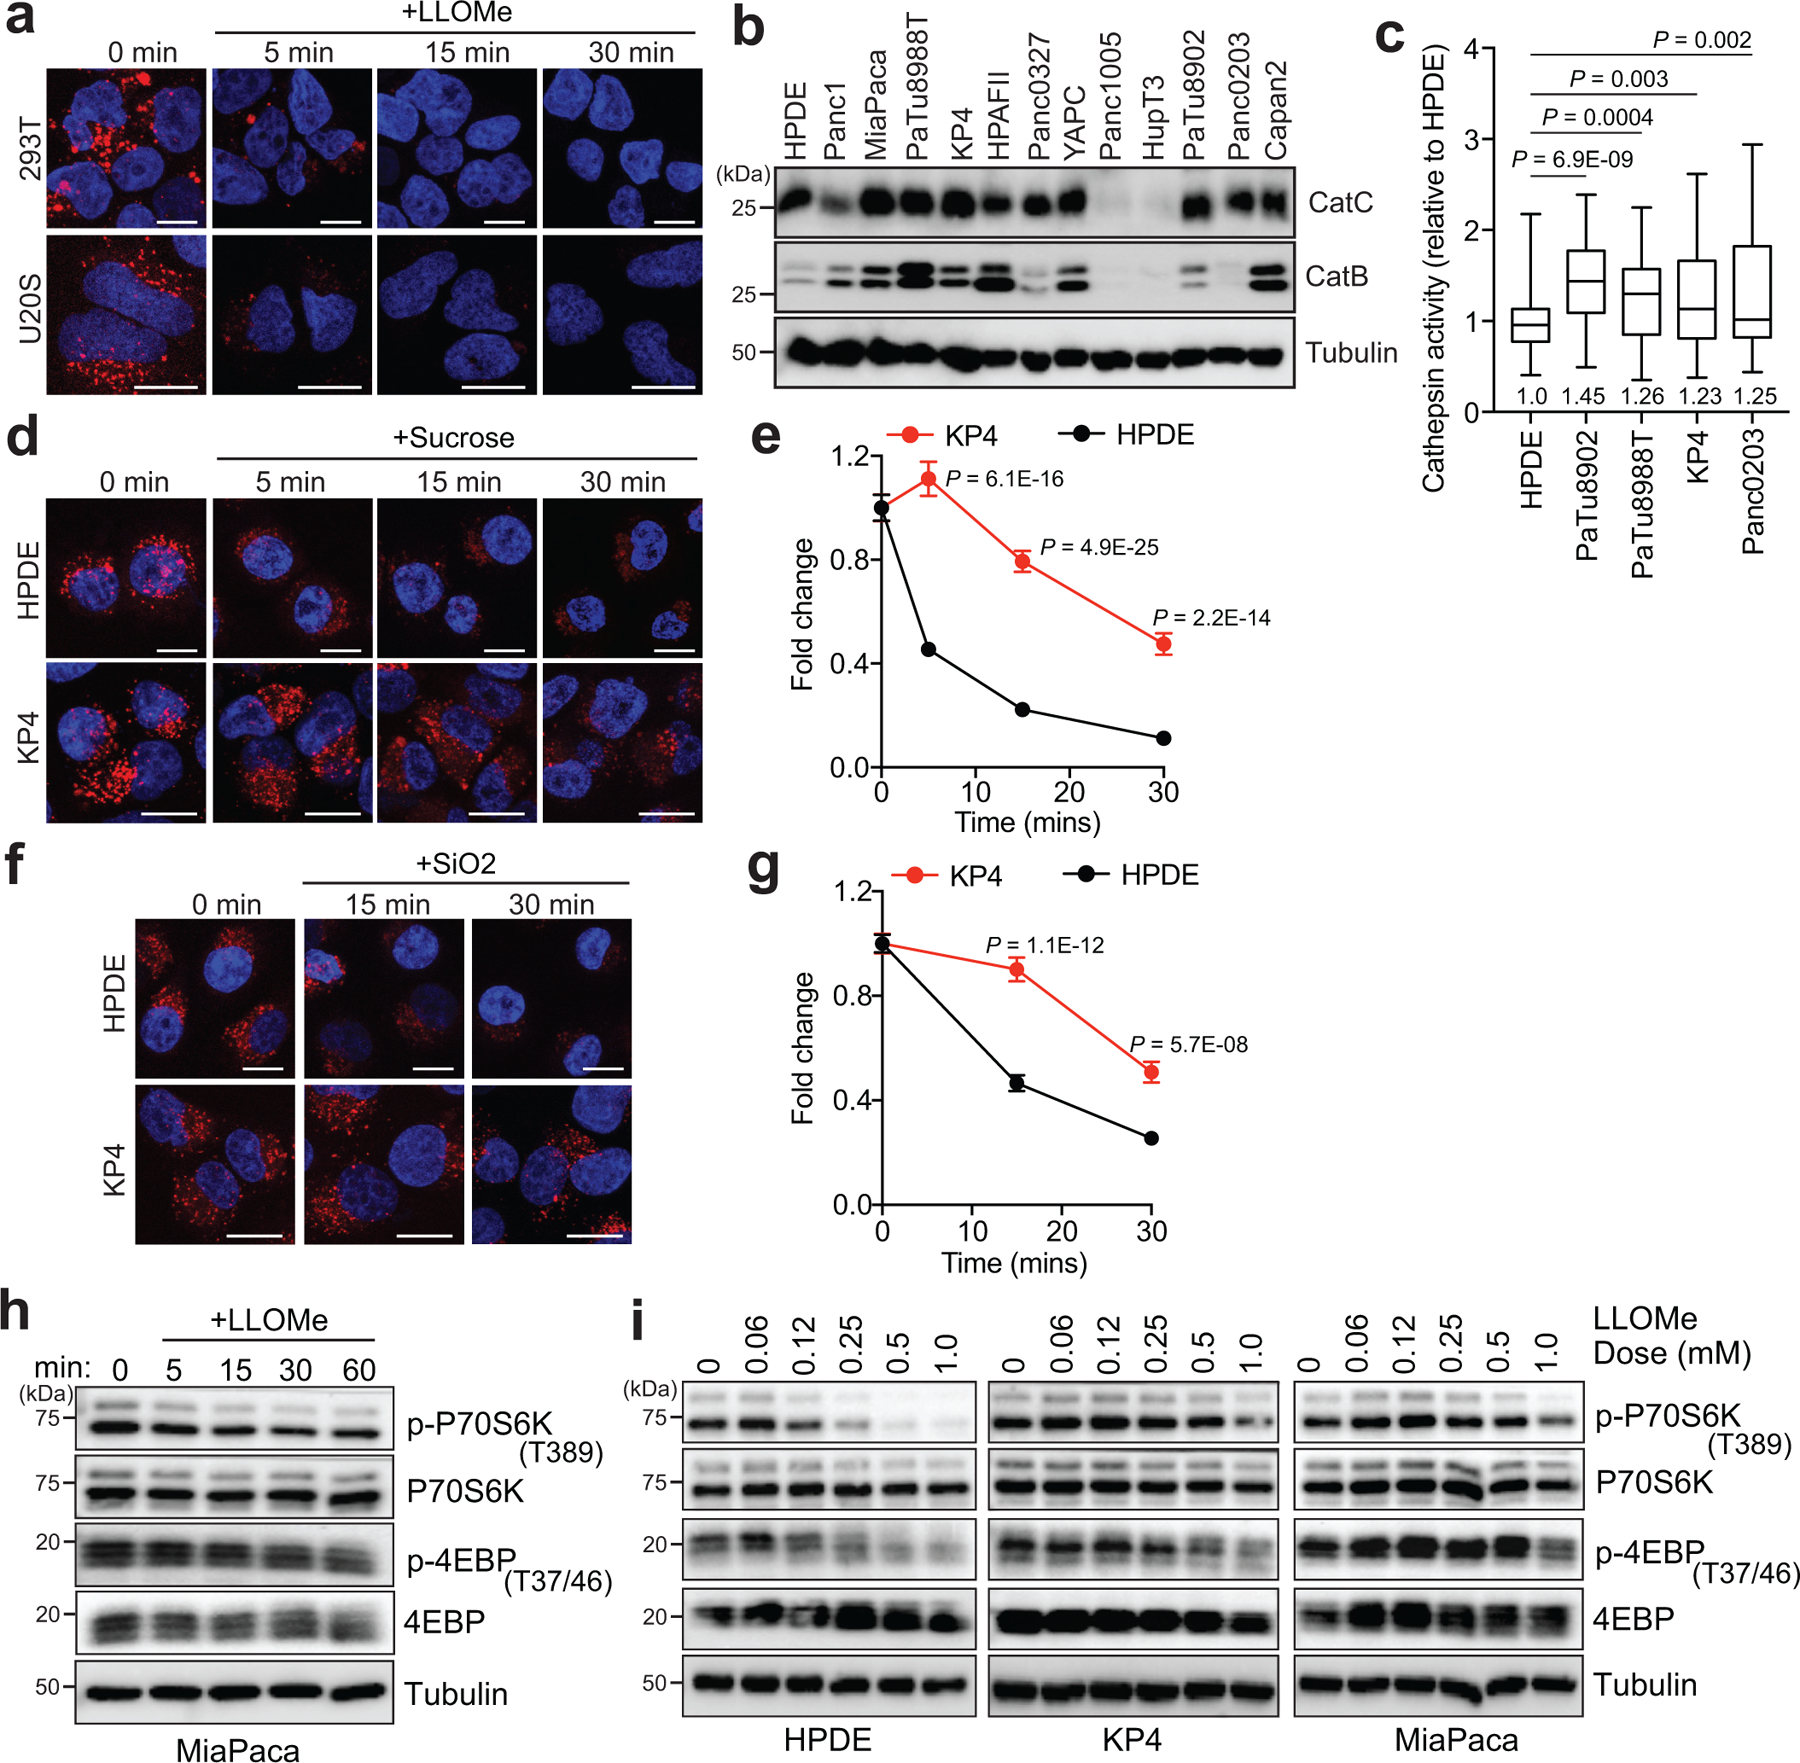
a. Time-course of lysotracker red staining in 293T and U20S cells following treatment with LLOMe. (293T, n= 86, 88, 88, 87 cells per time point ; U2OS n= 69, 63, 69, 65 cells per time point). b. Immunoblot showing the expression of Cathepsin C and Cathepsin B in the indicated cell lines. Asterisk denotes cell lines used throughout the study. c. Immunofluorescence quantification of Magic Red assay-based cathepsin protease activity in n = 65 cells per cell line. d. Time-course of lysotracker red staining in HPDE and KP4 cells following treatment with 0.5M sucrose. e. Normalized fold change of lysotracker staining. (HPDE, n = 64, 64, 65, 65 cells per time point; KP4, n = 64, 63, 63, 64 cells per time point). f. Time-course of lysotracker red staining in HPDE and KP4 cells following treatment with 100 μg/ml silica. g. Normalized fold change of lysotracker staining. (HPDE, n = 65 cells per time point; KP4, n = 65 cells per time point). h. Immunoblots for the indicated proteins in MiaPaca cells following a time course of 1mM LLOMe treatment. i. Immunoblots for the indicated proteins in HPDE, KP4 and MiaPaca cells following treatment for 1hr with increasing doses of LLOMe. Scale, 20μm for all panels. For box-and-whisker plots centre lines indicate median values and whiskers represent minimum and maximum values. Data are mean ± s.d. P values determined by unpaired two-tailed t-tests.
Extended Data Figure 3 |. Recruitment of ESCRT proteins to PDA lysosomes is delayed following acute damage.
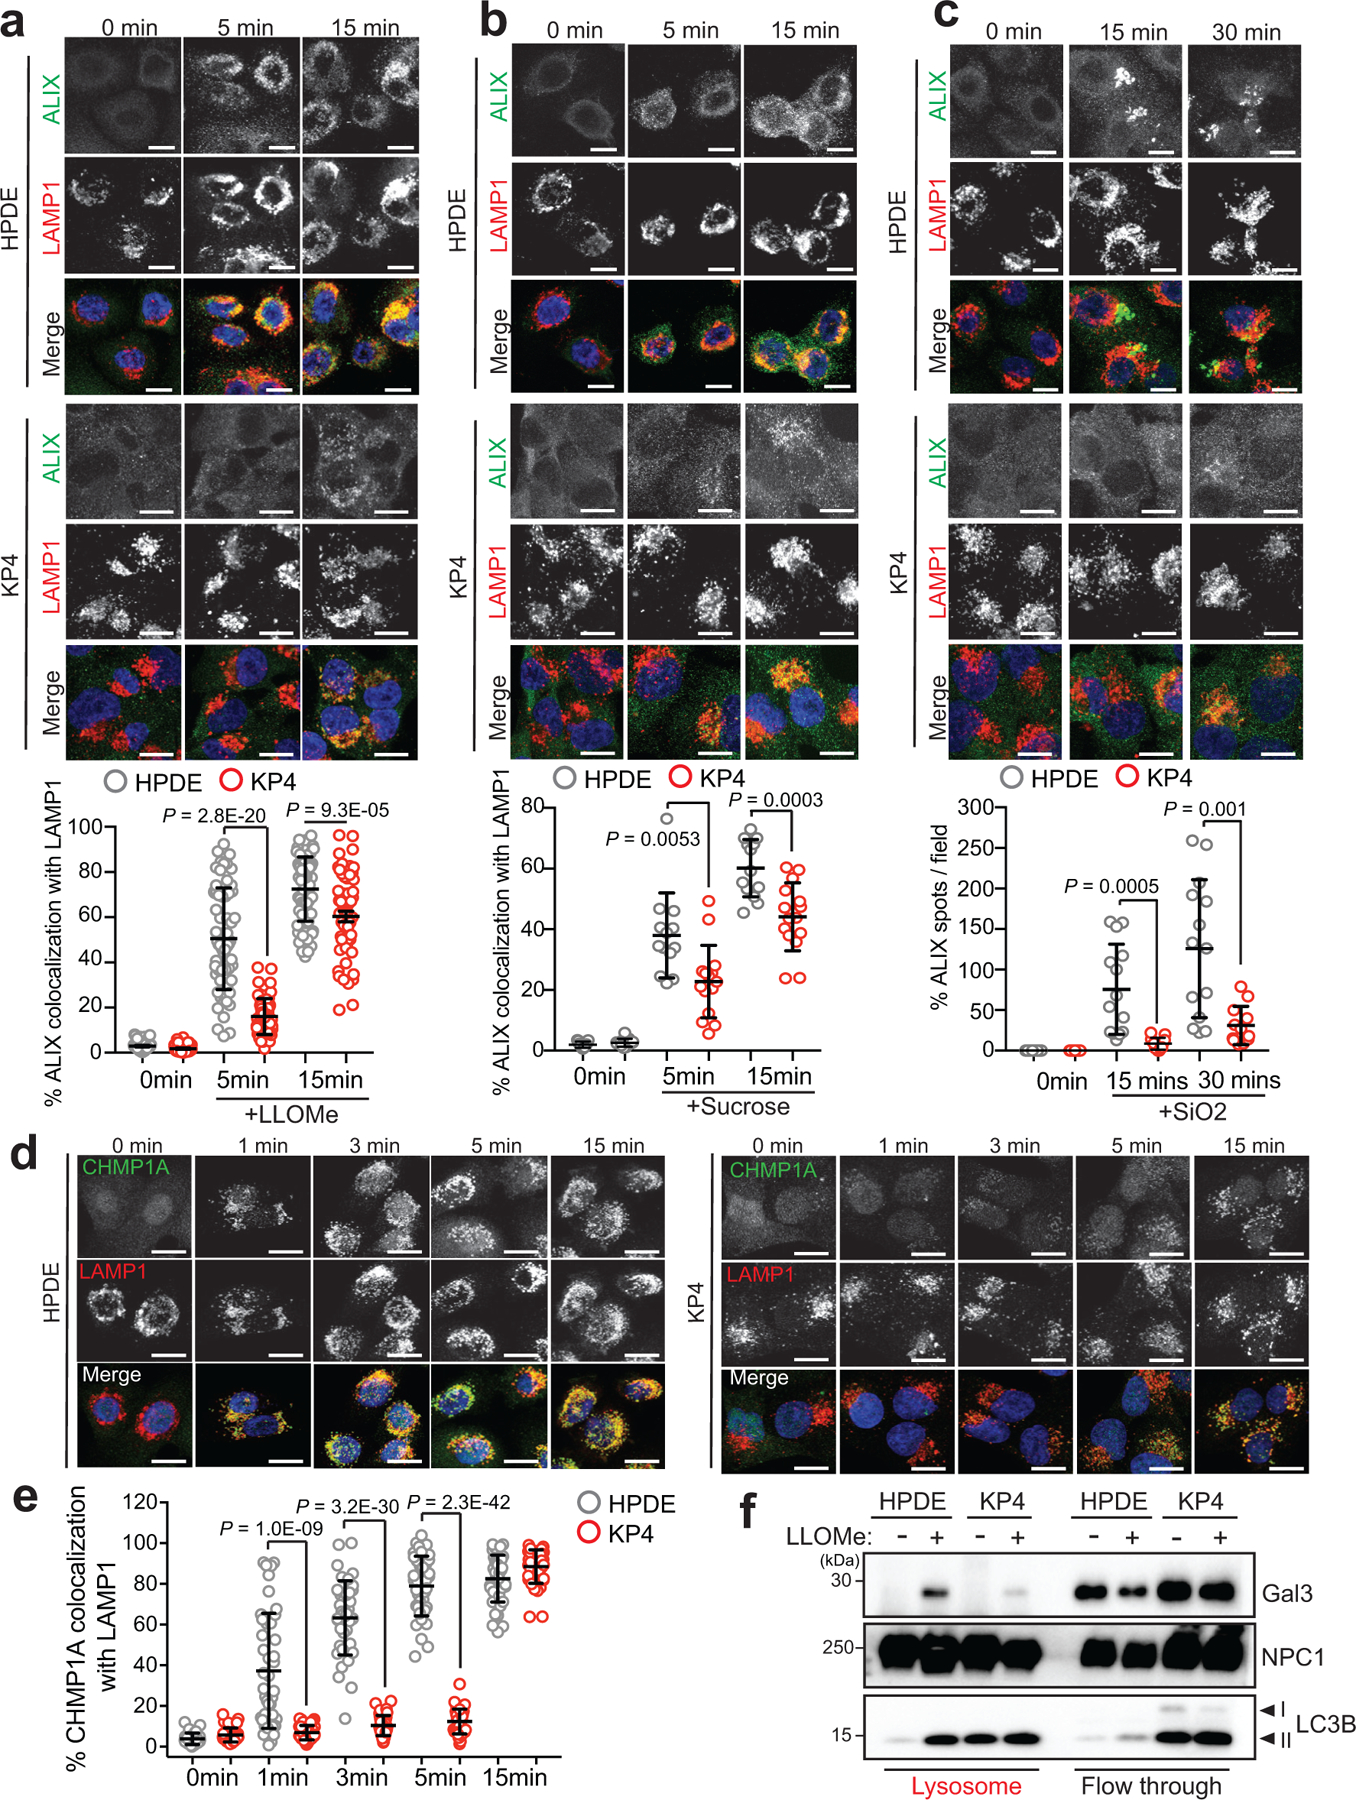
a-c. Time course of LLOMe (a), 0.5M sucrose (b), 100 μg/ml silica (c) treatment of HPDE and KP4 cells followed by immuno-fluorescence staining for ALIX (green) and LAMP1 (red). Graphs show the quantification of percentage co-localization of ALIX (LLOMe, n = 60 cells/condition for HPDE and KP4; sucrose, HPDE n = 13 fields/conditions, KP4 n= 13, 15, 15 fields/condition; silica, HPDE n = 14 fields/condition, KP4 n= 13, 13, 12 fields/condition) with LAMP1 positive lysosomes. d. Time course of LLOMe treatment of HPDE and KP4 cells followed by immuno-fluorescence staining for CHMP1A (green) and LAMP1 (red). e. Graph shows quantification of percentage co-localization of CHMP1A (n = 40 per cell line) with LAMP1 positive lysosomes. f. Immunoblot for the indicated proteins in lysosome fractions and flow through fractions isolated from HPDE- and KP4-T192-mRFP-3xHA stable cell lines treated with LLOMe for 10min. Scale, 20μm. Data are mean ± s.d. P values determined by unpaired two-tailed t-tests.
Extended Data Figure 4 |. MYOF loss leads to lysosome dysfunction in PDA cells.
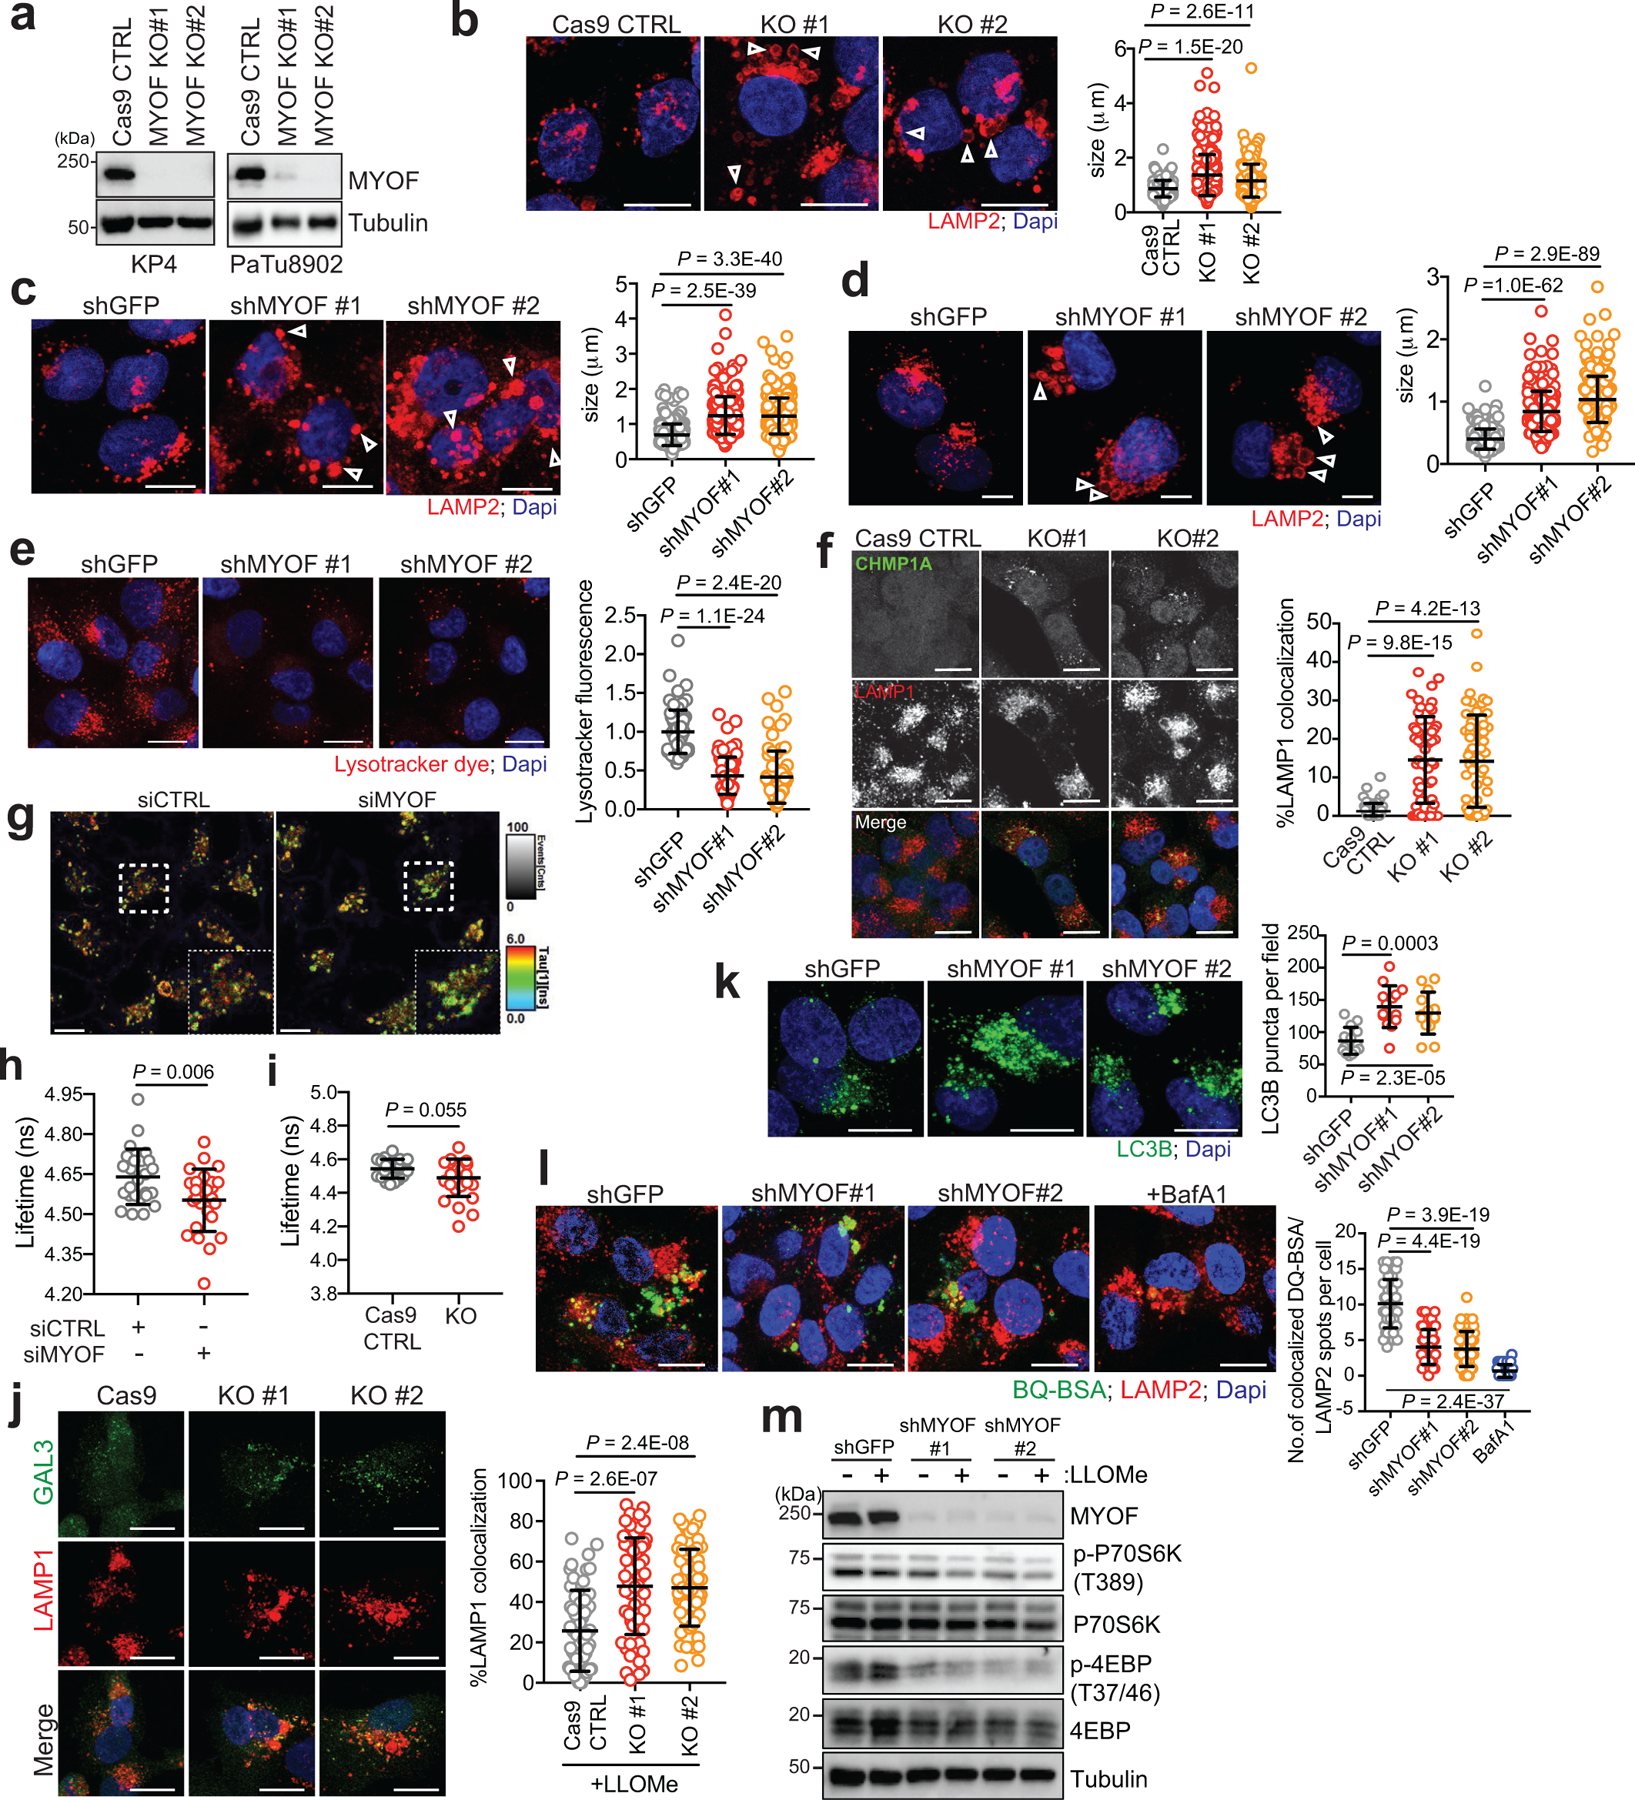
a. Immunoblot of MYOF in KP4 and PaTu8902 cells. b. LAMP2 staining (arrowheads) in MYOF KO PaTu8902 cells. Graph shows lysosome diameter control (Cas9; n = 252), MYOF KO #1 (n = 255) and MYOF KO #2 (n = 258) cells. c, d. LAMP2 staining (arrowheads) following knockdown of MYOF in PaTu8902 (c) and KP4 (d) cells. Graphs show lysosome diameter [PaTu8902 shGFP (n = 258), shMYOF#1 (n = 256), shMYOF#2 (n = 263); KP4 shGFP (n = 254), shMYOF#1 (n = 239), shMYOF#2 (n = 243) cells]. e. Lysotracker staining in KP4 cells following knockdown of MYOF. Graph shows normalized fold change in lysotracker fluorescence in control (shGFP, n = 70 cells) and KD (shMYOF#1, n = 65; shMYOF#2, n = 77) conditions. f. Recruitment of CHMP1A (green) to LAMP1 positive lysosomes (red) in MYOF KO (#1, n = 60; #2, n = 61) relative to Cas9 control (n = 58) KP4 cells. Graph shows the percentage CHMP1A co-localization with LAMP1. g,h. Representative FLIM images (g) of lysosomes labelled with Lyso-flipper in KP4 cells 72hrs post-transfection with siCTRL (left) or siMYOF (right). and lifetime (Tau 1) measurements (h) from siCTRL and siMYOF transfected cells (n = 4 experiments). Scale, 10 μm. i. Lyso Flipper lifetime measurements from KP4 Cas9 and MYOF KO cells (n = 3 experiments). j. Galectin 3 (GAL3; green) and LAMP1 (red) staining following LLOMe treatment of KP4 Cas9 or MYOF KO cells (n = 60 cells/condition). k. LC3B staining in PaTu8902 cells in shGFP (n = 55 cells) or shRNA MYOF (#1, n = 57; #2, n = 58) knockdown cells. Graph shows LC3B puncta per field. l. Degradation of macropinocytosed DQ-BSA in lysosomes [n = 54 (shGFP), 57 (shMYOF#1), 52 (shMYOF#2), n = 54 (BafA1) fluorescent spots/cell co-localizing with LAMP2 positive lysosomes]. m. Immunoblots from KP4 control (shGFP) or MYOF knockdown cells treated with or without 1mM LLOMe. Data are mean ± s.d. Scale, 20μm unless otherwise indicated. P values determined by unpaired two-tailed t-tests.
Extended Data Figure 5 |. Autophagy suppression reverses lysosome damage response in MYOF KO cells.
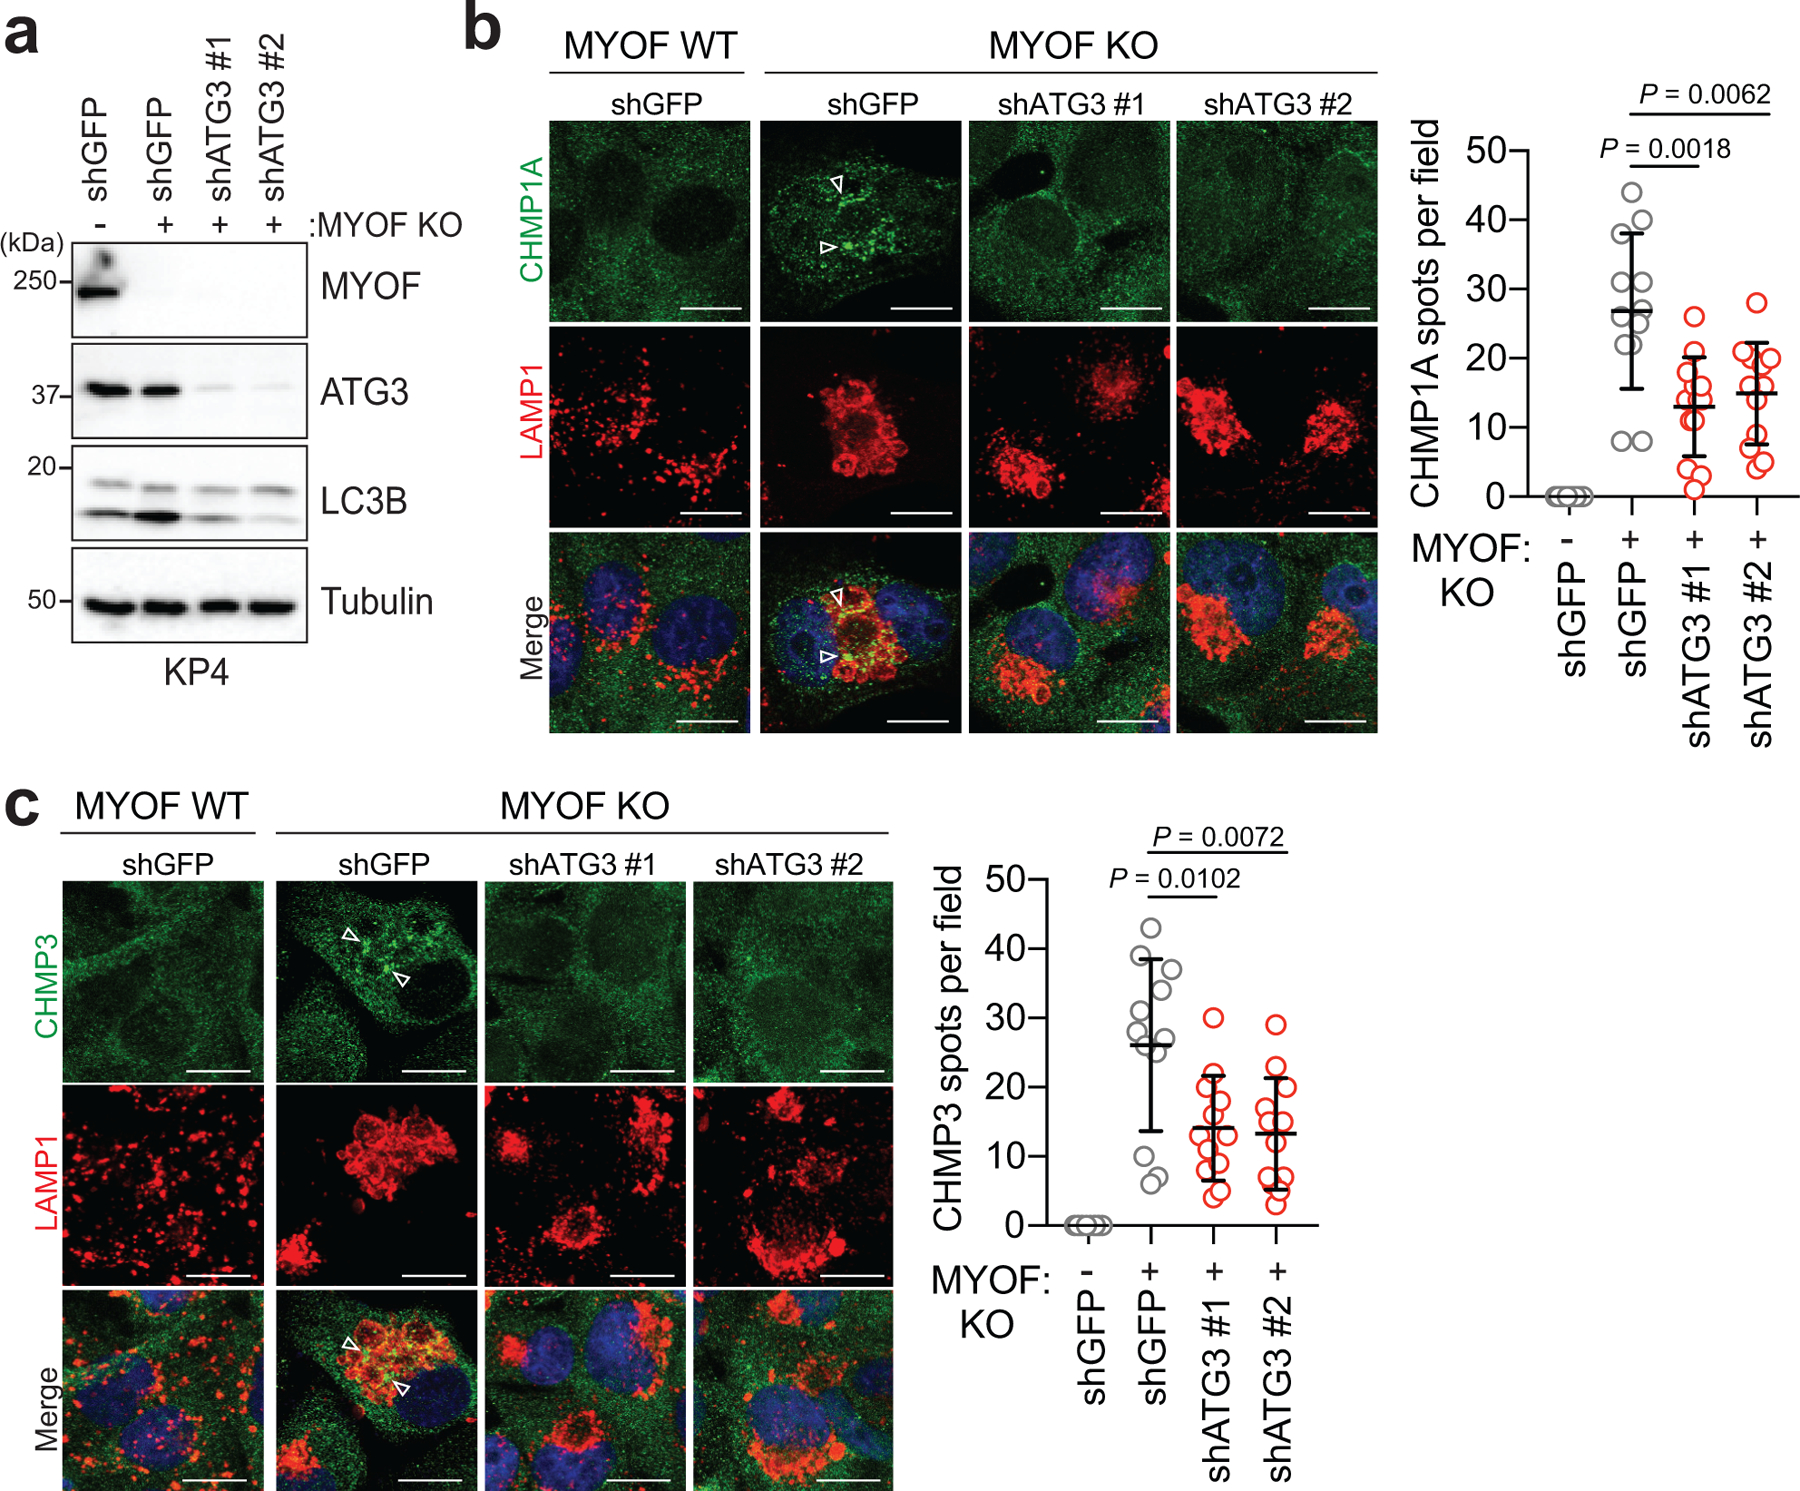
a. Immunoblot confirming shRNA mediated knockdown of ATG3 and autophagy blockade in KP4 MYOF KO cells. b,c. Recruitment of CHMP1A (green) (b) or CHMP3 (green) (c) to lysosomes (LAMP1; red) in KP4 cells in the presence (WT) and absence (KO) of MYOF. shRNA mediated knockdown of ATG3 to suppress autophagy causes a decrease in lysosome localization of CHMP1A and CHMP3 in MYOF KO cells (n = 12 fields per condition). Scale, 20μm. Data are mean ± s.d. P values determined by unpaired two-tailed t-test.
Extended Data Figure 6 |. Lysosomal targeting of MYOF delays onset of membrane damage.
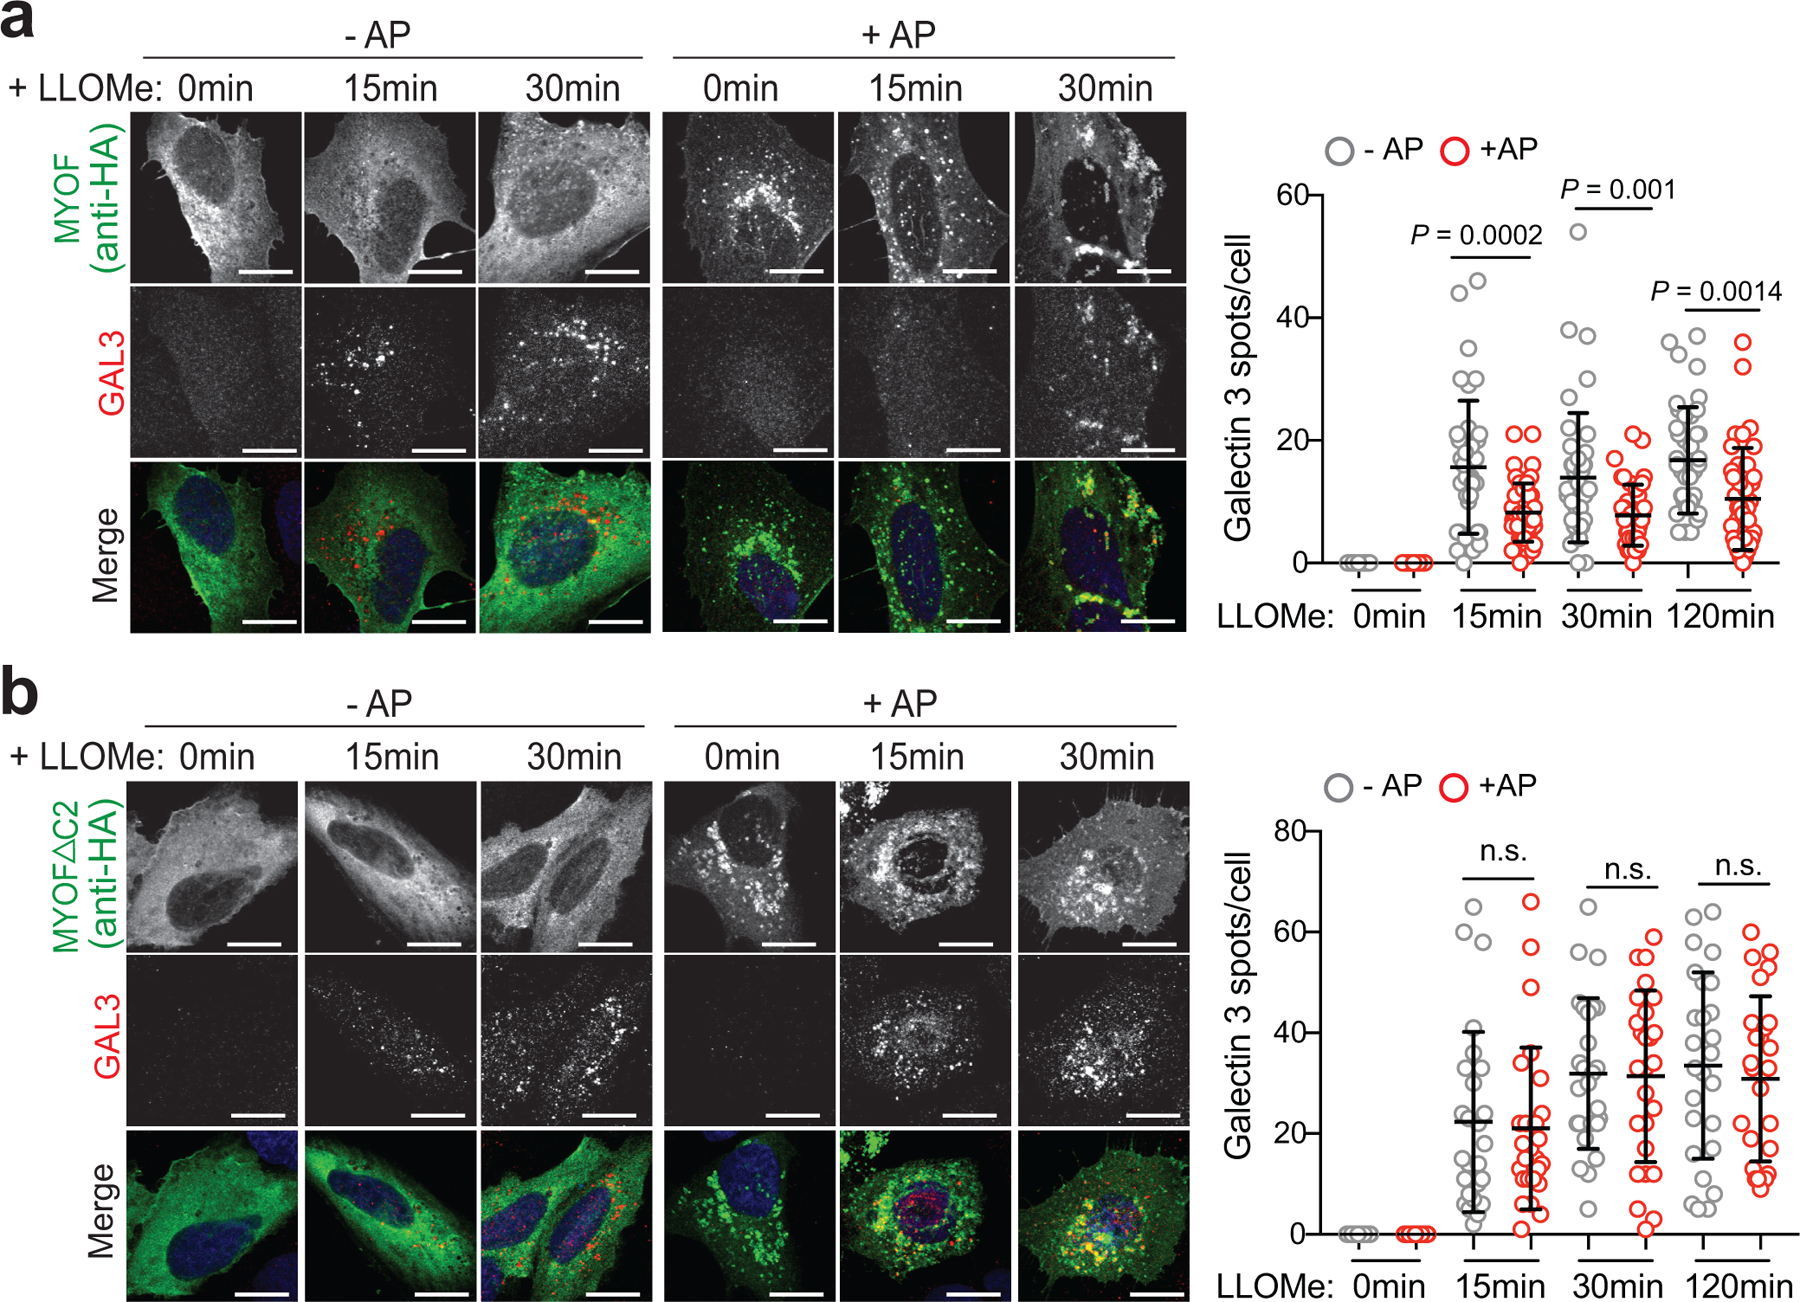
a. U20S cells stably expressing T192-Flag-FKBP and transiently transfected with MYOF-FRB* were treated with 1mM LLOMe for the indicated time points in the presence or absence of AP, followed by immuno-staining for HA (green) and Galectin 3 (GAL3; red). Recruitment of MYOF-FRB* (green) protects against LLOMe induced Gal3 recruitment [n= 40 (control), 39 (15mins), 43 (30 mins), 41 (120mins) cells in the absence of AP and n = 39 (control), 45 (15mins), 41 (30mins) and 39 (120mins) cells in the presence of AP]. b. U20S cells stably expressing T192-Flag-FKBP and transfected with MYOFDC2-FRB* variant were treated as in ‘a’, followed by immuno-staining for HA (green) and ALIX (red). Recruitment of MYOFDC2 (green) does not protect against LLOMe induced ALIX recruitment [n = 26 cells per condition (−AP and +AP)]. Graphs at right show quantification of GAL3 (top) and ALIX (bottom) spots per cell in response to LLOMe. Scale, 20μm for all panels. Data are mean ± s.d. P values determined by unpaired two-tailed t-tests. n.s. not significant.
Extended Data Figure 7 |. MYOF is required for growth of mouse PDA tumors.
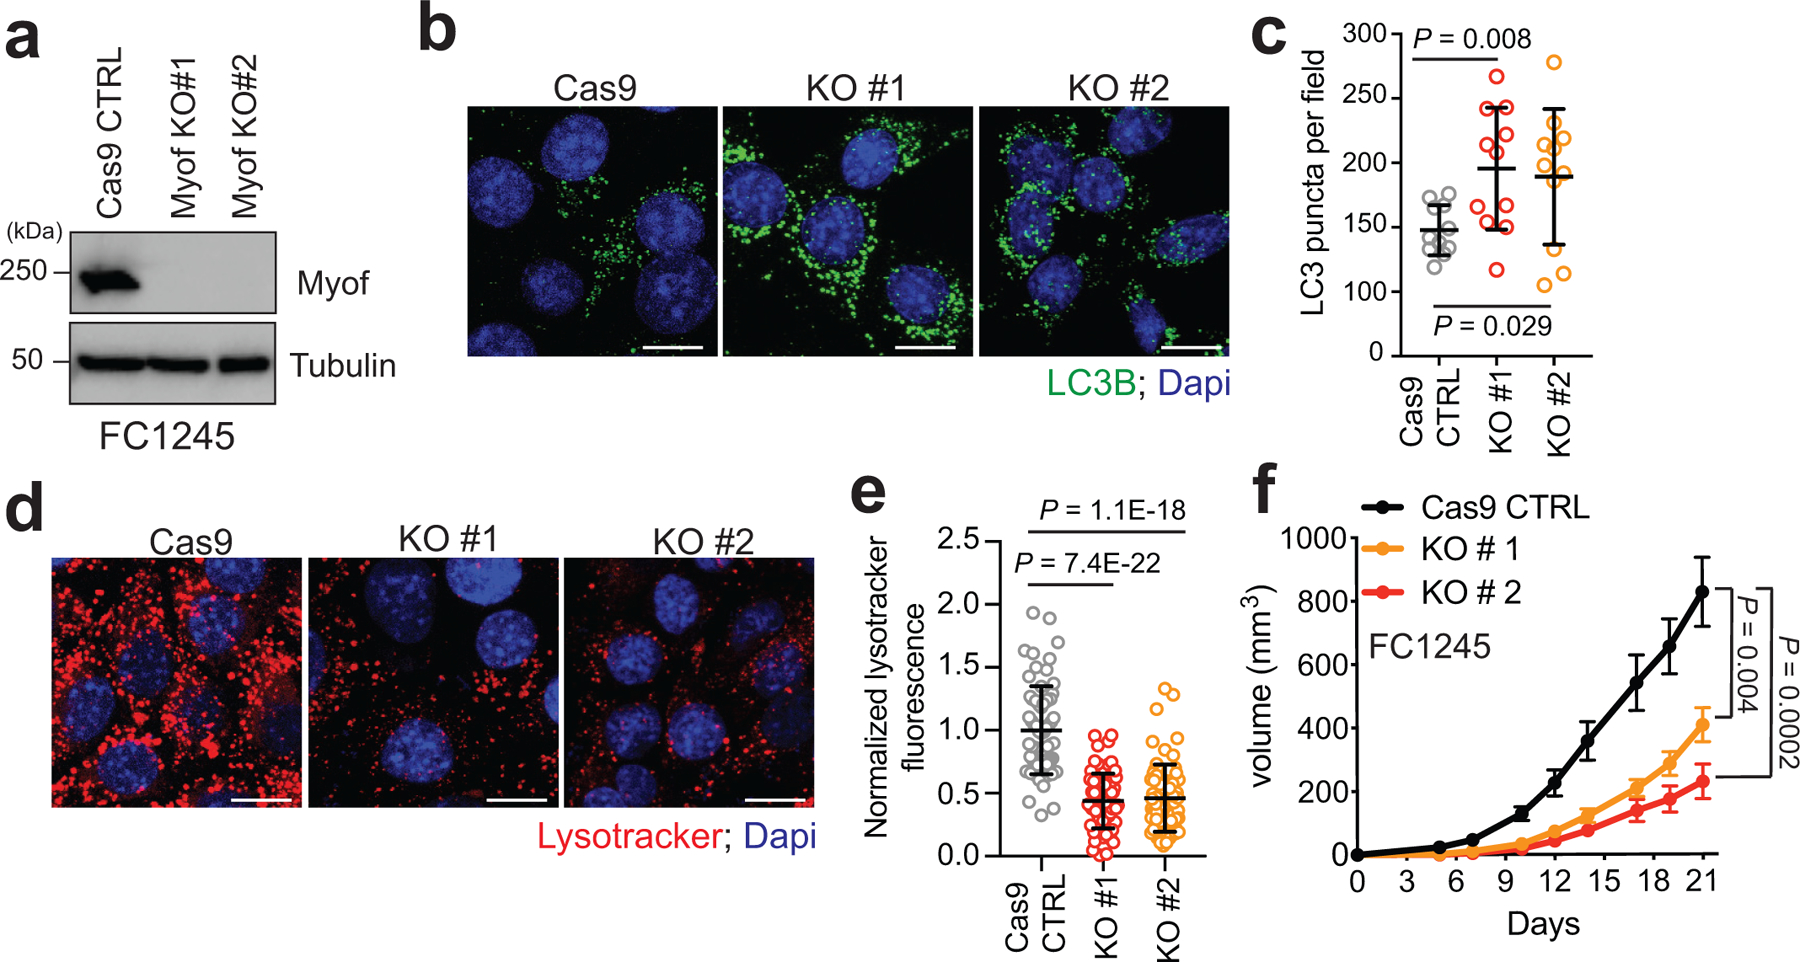
a. Immunoblot of the indicated proteins in mouse KPC cells (FC1245) following CRISPR mediated knockout of Myof. b,c. Immunofluorescence staining of LC3B positive autophagosomes in FC1245 Myof KO cells relative to Cas9 control cells. Graph shows quantification of LC3B puncta from n = 11 fields per condition. Data are mean ± s.d. d,e. Immunofluorescence images of Lysotracker red staining in FC1245 Myof KO cells compared to Cas9 control cells. Graph shows quantification from n = 70 (Cas9 control), 71 (KO#1), 70 (KO#2) cells per condition. Data are mean ± s.d. f. Growth rate of Cas9 control and Myof KO FC1245 allografts following s.c. transplantation in syngeneic C57BL/6 host mice. N=6 (Cas9 ctrl), 5 (KO#1), 5 (KO#2) animals per group. Scale, 20μm for all panels. Data represent mean ± s.e.m. P values determined by unpaired two-tailed t-tests.
Extended Data Figure 8 |. DYSF expression in PDA patient samples.
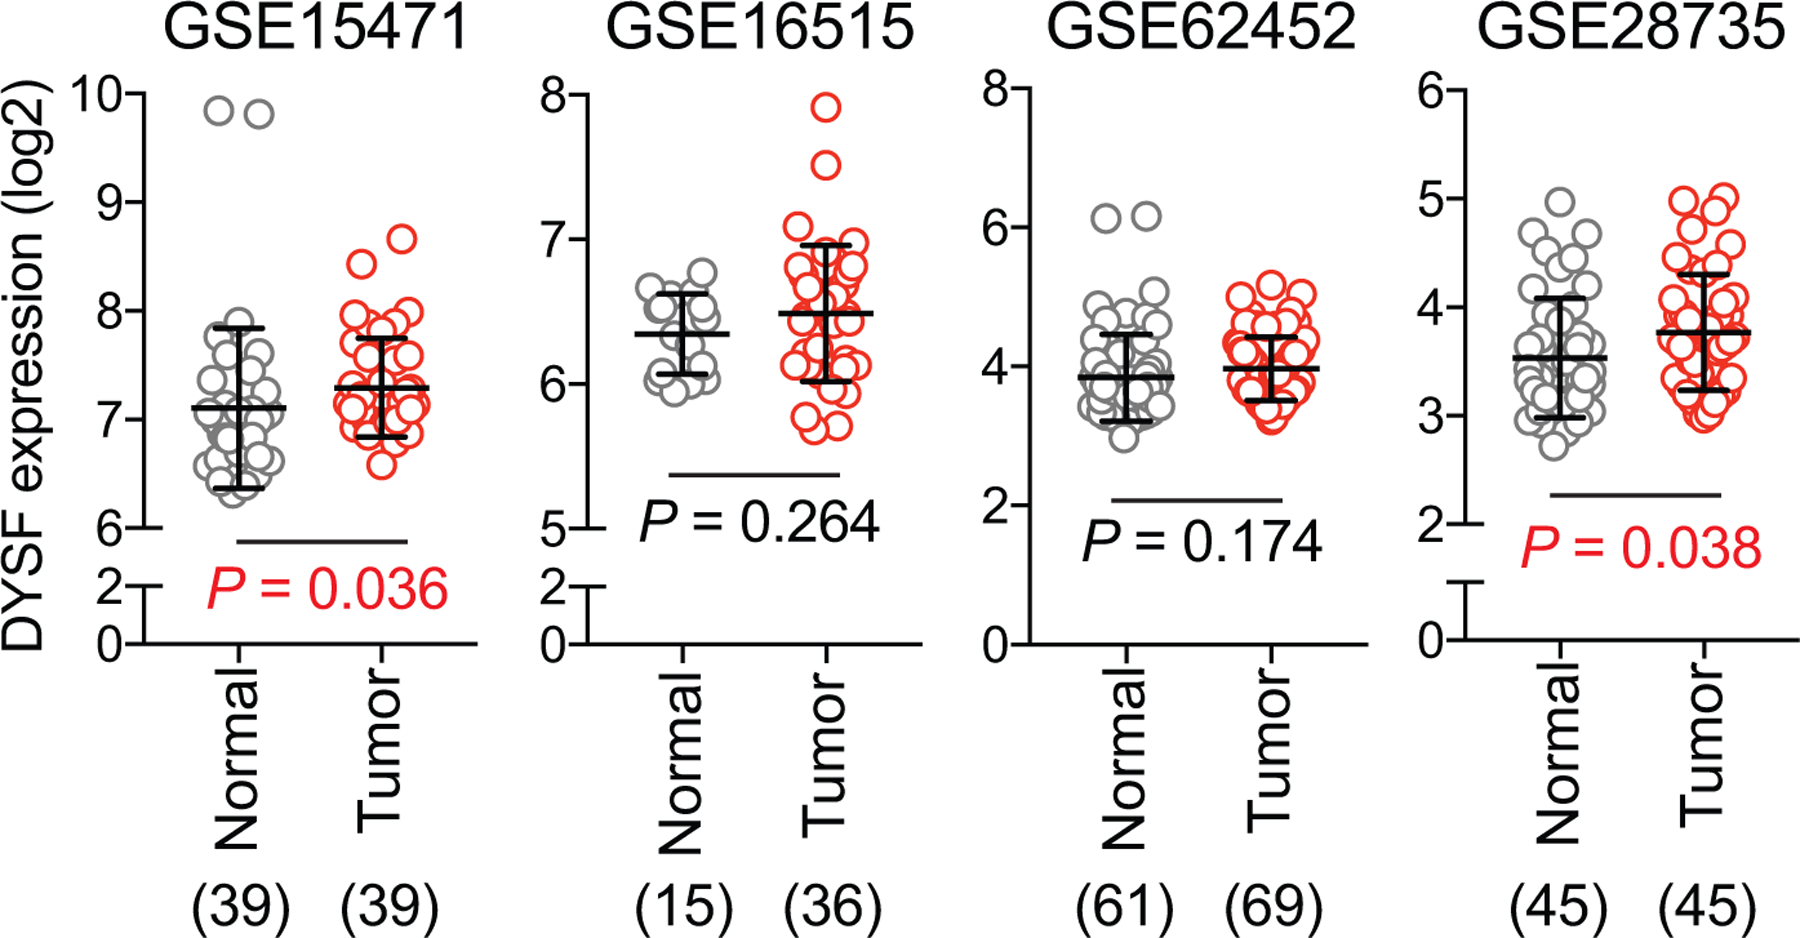
DYSF transcript levels in human PDA patient specimens from 4 independent datasets as indicated. The number of samples are indicated under each graph in parentheses. Data are mean ± s.d. P values determined by unpaired two-tailed t-tests.
Extended Data Figure 9 |. MYOF and DYSF expression in colorectal, NSCLC and breast cancer.
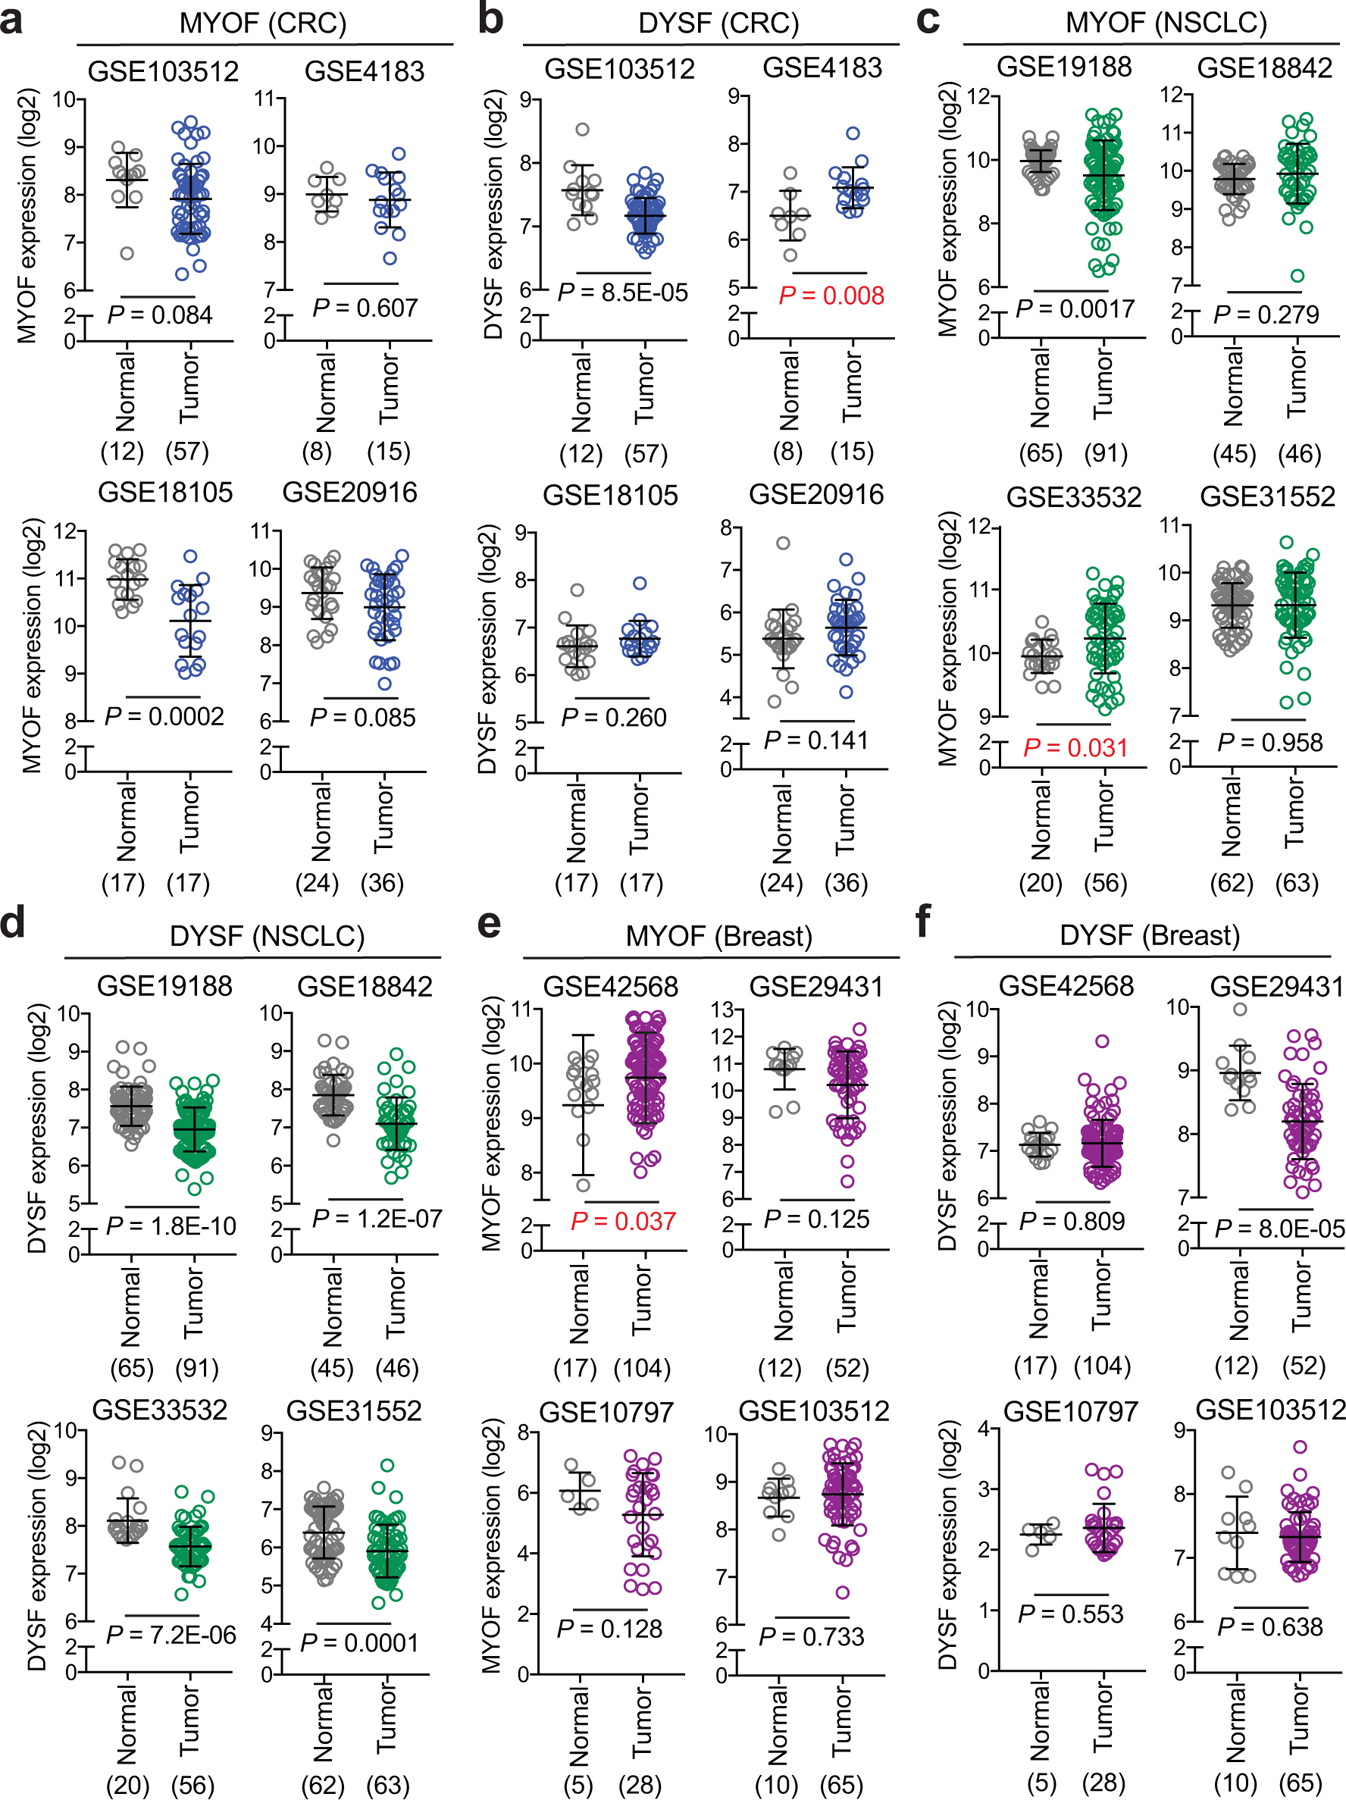
a,c,e. MYOF transcript levels in human colorectal cancer (CRC) (a), Non-small cell lung cancer (NSCLC) (c), and invasive breast cancer (e) patient specimens relative to normal colon, lung and breast from the indicated datasets (4 per tissue type). b,d,f. DYSF transcript levels in human colorectal cancer (CRC) (b), Non-small cell lung cancer (NSCLC) (d), and invasive breast cancer (f) patient specimens relative to normal colon, lung and breast from the indicated datasets (as in a,c,e). Note MYOF levels are elevated in only 2 datasets while DYSF levels are elevated in 1 dataset. The number of samples are indicated under each graph in parentheses. Data are mean ± s.d. P values determined by unpaired two-tailed t-tests.
Supplementary Material
Acknowledgements
We thank all the members of the Perera lab and Debnath Lab for helpful discussions. R.M.P is the Nadia’s Gift Foundation Innovator of the Damon Runyon Cancer Research Foundation (DRR-46-17) and is additionally supported by an NIH Director’s New Innovator Award (1DP2CA216364), the Pancreatic Cancer Action Network Career Development Award, and the Hirshberg Foundation for Pancreatic Cancer. H.R.S. is supported by an AACR-Amgen fellowship in Clinical/Translational Cancer Research. R.Z is supported by grants from the NIH (R01GM127763, R01GM130995), a Damon Runyon-Rachleff Innovator Award, Edward Mallinckrodt, Jr. Foundation Grant. A.R is supported by a Human Frontier Science Program Young Investigator Grant RGY0076/2009-C, the Swiss National Fund for Research and the European Research Council Consolidator Grant. D.W.D. receives support from the Hirshberg Foundation for Pancreatic Cancer Research. We thank Reena Zalpuri at the University of California Berkeley Electron Microscope Laboratory for advice and assistance in electron microscopy sample preparation and data collection.
Footnotes
Competing interests
The other authors declare no competing interests.
Data availability
Mass spectrometry data have been deposited in MassIVE with the accession code MSV000086769. Source data are provided with this study. All other data supporting the findings of this study are available from the corresponding author on reasonable request.
References
- 1.Lawrence RE & Zoncu R The lysosome as a cellular centre for signalling, metabolism and quality control. Nat Cell Biol 21, 133–142, doi: 10.1038/s41556-018-0244-7 (2019). [DOI] [PubMed] [Google Scholar]
- 2.Perera RM & Zoncu R The Lysosome as a Regulatory Hub. Annu Rev Cell Dev Biol 32, 223–253, doi: 10.1146/annurev-cellbio-111315-125125 (2016). [DOI] [PMC free article] [PubMed] [Google Scholar]
- 3.Ballabio A & Bonifacino JS Lysosomes as dynamic regulators of cell and organismal homeostasis. Nat Rev Mol Cell Biol 21, 101–118, doi: 10.1038/s41580-019-0185-4 (2020). [DOI] [PubMed] [Google Scholar]
- 4.Commisso C et al. Macropinocytosis of protein is an amino acid supply route in Ras-transformed cells. Nature 497, 633–637, doi: 10.1038/nature12138 (2013). [DOI] [PMC free article] [PubMed] [Google Scholar]
- 5.Kamphorst JJ et al. Human pancreatic cancer tumors are nutrient poor and tumor cells actively scavenge extracellular protein. Cancer Res 75, 544–553, doi: 10.1158/0008-5472.CAN-14-2211 (2015). [DOI] [PMC free article] [PubMed] [Google Scholar]
- 6.Perera RM et al. Transcriptional control of autophagy-lysosome function drives pancreatic cancer metabolism. Nature 524, 361–365, doi: 10.1038/nature14587 (2015). [DOI] [PMC free article] [PubMed] [Google Scholar]
- 7.Yang A et al. Autophagy is critical for pancreatic tumor growth and progression in tumors with p53 alterations. Cancer Discov 4, 905–913, doi: 10.1158/2159-8290.CD-14-0362 (2014). [DOI] [PMC free article] [PubMed] [Google Scholar]
- 8.Yang S et al. Pancreatic cancers require autophagy for tumor growth. Genes Dev 25, 717–729, doi: 10.1101/gad.2016111 (2011). [DOI] [PMC free article] [PubMed] [Google Scholar]
- 9.Yamamoto K et al. Autophagy promotes immune evasion of pancreatic cancer by degrading MHC-I. Nature 581, 100–105, doi: 10.1038/s41586-020-2229-5 (2020). [DOI] [PMC free article] [PubMed] [Google Scholar]
- 10.Perera RM, Di Malta C & Ballabio A MiT/TFE Family of Transcription Factors, Lysosomes, and Cancer. Annu Rev Cancer Biol 3, 203–222, doi: 10.1146/annurev-cancerbio-030518-055835 (2019). [DOI] [PMC free article] [PubMed] [Google Scholar]
- 11.Papadopoulos C, Kravic B & Meyer H Repair or Lysophagy: Dealing with Damaged Lysosomes. J Mol Biol 432, 231–239, doi: 10.1016/j.jmb.2019.08.010 (2020). [DOI] [PubMed] [Google Scholar]
- 12.Vietri M, Radulovic M & Stenmark H The many functions of ESCRTs. Nat Rev Mol Cell Biol 21, 25–42, doi: 10.1038/s41580-019-0177-4 (2020). [DOI] [PubMed] [Google Scholar]
- 13.Radulovic M et al. ESCRT-mediated lysosome repair precedes lysophagy and promotes cell survival. EMBO J 37, doi: 10.15252/embj.201899753 (2018). [DOI] [PMC free article] [PubMed] [Google Scholar]
- 14.Skowyra ML, Schlesinger PH, Naismith TV & Hanson PI Triggered recruitment of ESCRT machinery promotes endolysosomal repair. Science 360, doi: 10.1126/science.aar5078 (2018). [DOI] [PMC free article] [PubMed] [Google Scholar]
- 15.Hung YH, Chen LM, Yang JY & Yang WY Spatiotemporally controlled induction of autophagy-mediated lysosome turnover. Nat Commun 4, 2111, doi: 10.1038/ncomms3111 (2013). [DOI] [PubMed] [Google Scholar]
- 16.Jia J et al. Galectins Control mTOR in Response to Endomembrane Damage. Mol Cell 70, 120–135 e128, doi: 10.1016/j.molcel.2018.03.009 (2018). [DOI] [PMC free article] [PubMed] [Google Scholar]
- 17.Maejima I et al. Autophagy sequesters damaged lysosomes to control lysosomal biogenesis and kidney injury. EMBO J 32, 2336–2347, doi: 10.1038/emboj.2013.171 (2013). [DOI] [PMC free article] [PubMed] [Google Scholar]
- 18.Abu-Remaileh M et al. Lysosomal metabolomics reveals V-ATPase- and mTOR-dependent regulation of amino acid efflux from lysosomes. Science 358, 807–813, doi: 10.1126/science.aan6298 (2017). [DOI] [PMC free article] [PubMed] [Google Scholar]
- 19.Zoncu R et al. mTORC1 senses lysosomal amino acids through an inside-out mechanism that requires the vacuolar H(+)-ATPase. Science 334, 678–683, doi: 10.1126/science.1207056 (2011). [DOI] [PMC free article] [PubMed] [Google Scholar]
- 20.Bansal D & Campbell KP Dysferlin and the plasma membrane repair in muscular dystrophy. Trends Cell Biol 14, 206–213, doi: 10.1016/j.tcb.2004.03.001 (2004). [DOI] [PubMed] [Google Scholar]
- 21.Bansal D et al. Defective membrane repair in dysferlin-deficient muscular dystrophy. Nature 423, 168–172, doi: 10.1038/nature01573 (2003). [DOI] [PubMed] [Google Scholar]
- 22.Davis DB, Delmonte AJ, Ly CT & McNally EM Myoferlin, a candidate gene and potential modifier of muscular dystrophy. Hum Mol Genet 9, 217–226, doi: 10.1093/hmg/9.2.217 (2000). [DOI] [PubMed] [Google Scholar]
- 23.Doherty KR et al. Normal myoblast fusion requires myoferlin. Development 132, 5565–5575, doi: 10.1242/dev.02155 (2005). [DOI] [PMC free article] [PubMed] [Google Scholar]
- 24.Lek A, Evesson FJ, Sutton RB, North KN & Cooper ST Ferlins: regulators of vesicle fusion for auditory neurotransmission, receptor trafficking and membrane repair. Traffic 13, 185–194, doi: 10.1111/j.1600-0854.2011.01267.x (2012). [DOI] [PubMed] [Google Scholar]
- 25.Bashir R et al. A gene related to Caenorhabditis elegans spermatogenesis factor fer-1 is mutated in limb-girdle muscular dystrophy type 2B. Nat Genet 20, 37–42, doi: 10.1038/1689 (1998). [DOI] [PubMed] [Google Scholar]
- 26.Liu J et al. Dysferlin, a novel skeletal muscle gene, is mutated in Miyoshi myopathy and limb girdle muscular dystrophy. Nat Genet 20, 31–36, doi: 10.1038/1682 (1998). [DOI] [PubMed] [Google Scholar]
- 27.Repnik U et al. L-leucyl-L-leucine methyl ester does not release cysteine cathepsins to the cytosol but inactivates them in transiently permeabilized lysosomes. J Cell Sci 130, 3124–3140, doi: 10.1242/jcs.204529 (2017). [DOI] [PubMed] [Google Scholar]
- 28.Mercier V et al. Endosomal membrane tension regulates ESCRT-III-dependent intra-lumenal vesicle formation. Nat Cell Biol 22, 947–959, doi: 10.1038/s41556-020-0546-4 (2020). [DOI] [PMC free article] [PubMed] [Google Scholar]
- 29.Chauhan S et al. TRIMs and Galectins Globally Cooperate and TRIM16 and Galectin-3 Co-direct Autophagy in Endomembrane Damage Homeostasis. Dev Cell 39, 13–27, doi: 10.1016/j.devcel.2016.08.003 (2016). [DOI] [PMC free article] [PubMed] [Google Scholar]
- 30.Thurston TL, Wandel MP, von Muhlinen N, Foeglein A & Randow F Galectin 8 targets damaged vesicles for autophagy to defend cells against bacterial invasion. Nature 482, 414–418, doi: 10.1038/nature10744 (2012). [DOI] [PMC free article] [PubMed] [Google Scholar]
- 31.Aits S et al. Sensitive detection of lysosomal membrane permeabilization by lysosomal galectin puncta assay. Autophagy 11, 1408–1424, doi: 10.1080/15548627.2015.1063871 (2015). [DOI] [PMC free article] [PubMed] [Google Scholar]
- 32.Kilpatrick BS, Eden ER, Hockey LN, Futter CE & Patel S Methods for monitoring lysosomal morphology. Methods Cell Biol 126, 1–19, doi: 10.1016/bs.mcb.2014.10.018 (2015). [DOI] [PubMed] [Google Scholar]
- 33.Platt FM, Boland B & van der Spoel AC The cell biology of disease: lysosomal storage disorders: the cellular impact of lysosomal dysfunction. J Cell Biol 199, 723–734, doi: 10.1083/jcb.201208152 (2012). [DOI] [PMC free article] [PubMed] [Google Scholar]
- 34.Mauthe M et al. Chloroquine inhibits autophagic flux by decreasing autophagosome-lysosome fusion. Autophagy 14, 1435–1455, doi: 10.1080/15548627.2018.1474314 (2018). [DOI] [PMC free article] [PubMed] [Google Scholar]
- 35.Colom A et al. A fluorescent membrane tension probe. Nat Chem 10, 1118–1125, doi: 10.1038/s41557-018-0127-3 (2018). [DOI] [PMC free article] [PubMed] [Google Scholar]
- 36.Goujon A et al. Mechanosensitive Fluorescent Probes to Image Membrane Tension in Mitochondria, Endoplasmic Reticulum, and Lysosomes. J Am Chem Soc 141, 3380–3384, doi: 10.1021/jacs.8b13189 (2019). [DOI] [PubMed] [Google Scholar]
- 37.Lawrence RE et al. A nutrient-induced affinity switch controls mTORC1 activation by its Rag GTPase-Ragulator lysosomal scaffold. Nat Cell Biol 20, 1052–1063, doi: 10.1038/s41556-018-0148-6 (2018). [DOI] [PMC free article] [PubMed] [Google Scholar]
- 38.Liberles SD, Diver ST, Austin DJ & Schreiber SL Inducible gene expression and protein translocation using nontoxic ligands identified by a mammalian three-hybrid screen. Proc Natl Acad Sci U S A 94, 7825–7830, doi: 10.1073/pnas.94.15.7825 (1997). [DOI] [PMC free article] [PubMed] [Google Scholar]
- 39.Davis DB, Doherty KR, Delmonte AJ & McNally EM Calcium-sensitive phospholipid binding properties of normal and mutant ferlin C2 domains. J Biol Chem 277, 22883–22888, doi: 10.1074/jbc.M201858200 (2002). [DOI] [PubMed] [Google Scholar]
- 40.Marty NJ, Holman CL, Abdullah N & Johnson CP The C2 domains of otoferlin, dysferlin, and myoferlin alter the packing of lipid bilayers. Biochemistry 52, 5585–5592, doi: 10.1021/bi400432f (2013). [DOI] [PMC free article] [PubMed] [Google Scholar]
- 41.Doherty KR et al. The endocytic recycling protein EHD2 interacts with myoferlin to regulate myoblast fusion. J Biol Chem 283, 20252–20260, doi: 10.1074/jbc.M802306200 (2008). [DOI] [PMC free article] [PubMed] [Google Scholar]
- 42.Lee JJ et al. Stromal response to Hedgehog signaling restrains pancreatic cancer progression. Proc Natl Acad Sci U S A 111, E3091–3100, doi: 10.1073/pnas.1411679111 (2014). [DOI] [PMC free article] [PubMed] [Google Scholar]
- 43.Hingorani SR et al. Preinvasive and invasive ductal pancreatic cancer and its early detection in the mouse. Cancer Cell 4, 437–450, doi: 10.1016/s1535-6108(03)00309-x (2003). [DOI] [PubMed] [Google Scholar]
- 44.Weber RA et al. Maintaining Iron Homeostasis Is the Key Role of Lysosomal Acidity for Cell Proliferation. Mol Cell 77, 645–655 e647, doi: 10.1016/j.molcel.2020.01.003 (2020). [DOI] [PMC free article] [PubMed] [Google Scholar]
- 45.Yambire KF et al. Impaired lysosomal acidification triggers iron deficiency and inflammation in vivo. Elife 8, doi: 10.7554/eLife.51031 (2019). [DOI] [PMC free article] [PubMed] [Google Scholar]
- 46.Xu H & Ren D Lysosomal physiology. Annu Rev Physiol 77, 57–80, doi: 10.1146/annurev-physiol-021014-071649 (2015). [DOI] [PMC free article] [PubMed] [Google Scholar]
- 47.Dong R et al. Endosome-ER Contacts Control Actin Nucleation and Retromer Function through VAP-Dependent Regulation of PI4P. Cell 166, 408–423, doi: 10.1016/j.cell.2016.06.037 (2016). [DOI] [PMC free article] [PubMed] [Google Scholar]
- 48.Lim CY et al. ER-lysosome contacts enable cholesterol sensing by mTORC1 and drive aberrant growth signalling in Niemann-Pick type C. Nat Cell Biol 21, 1206–1218, doi: 10.1038/s41556-019-0391-5 (2019). [DOI] [PMC free article] [PubMed] [Google Scholar]
- 49.Rademaker G et al. Myoferlin controls mitochondrial structure and activity in pancreatic ductal adenocarcinoma, and affects tumor aggressiveness. Oncogene 37, 4398–4412, doi: 10.1038/s41388-018-0287-z (2018). [DOI] [PMC free article] [PubMed] [Google Scholar]
- 50.Rademaker G et al. Human colon cancer cells highly express myoferlin to maintain a fit mitochondrial network and escape p53-driven apoptosis. Oncogenesis 8, 21, doi: 10.1038/s41389-019-0130-6 (2019). [DOI] [PMC free article] [PubMed] [Google Scholar]
- 51.Petersen NH et al. Transformation-associated changes in sphingolipid metabolism sensitize cells to lysosomal cell death induced by inhibitors of acid sphingomyelinase. Cancer Cell 24, 379–393, doi: 10.1016/j.ccr.2013.08.003 (2013). [DOI] [PubMed] [Google Scholar]
- 52.Raudvere U et al. g:Profiler: a web server for functional enrichment analysis and conversions of gene lists. Nucleic Acids Res 47, W191–W198, doi: 10.1093/nar/gkz369 (2019). [DOI] [PMC free article] [PubMed] [Google Scholar]
- 53.Mercier V et al. Endosomal membrane tension regulates ESCRT-III-dependent intra-lumenal vesicle formation. Nat Cell Biol 22, 947–959, doi: 10.1038/s41556-020-0546-4 (2020). [DOI] [PMC free article] [PubMed] [Google Scholar]
- 54.Manuyakorn A et al. Cellular histone modification patterns predict prognosis and treatment response in resectable pancreatic adenocarcinoma: results from RTOG 9704. J Clin Oncol 28, 1358–1365, doi: 10.1200/JCO.2009.24.5639 (2010) [DOI] [PMC free article] [PubMed] [Google Scholar]
Associated Data
This section collects any data citations, data availability statements, or supplementary materials included in this article.
Supplementary Materials
Data Availability Statement
Mass spectrometry data have been deposited in MassIVE with the accession code MSV000086769. Source data are provided with this study. All other data supporting the findings of this study are available from the corresponding author on reasonable request.


