

Introduction
Rubin et al,1–3 Emami et al,4,5 and Quantitative Analyses of Normal Tissue Effects in the Clinic (QUANTEC)6 provided estimates of dose, volume, and outcome data primarily for conventionally fractionated radiation therapy based on expert opinion and/or the available published literature. Similar compilations for hypofractionated high-dose-perfraction regimens (often termed stereotactic radiosurgery [SRS], stereotactic body radiation therapy [SBRT], or SABR) have been provided7–11 (eg, American Association of Physicists in Medicine (AAPM) Task Group Report TG10110 and associated updated constraints11). These landmark dose-volume guidance documents, along with many clinical reports, cooperative trials,12–18 and some pooled analyses,7,19,20 have helped shape current clinical practice and are important contributions.
The main objective of the current HyTEC (Hy Dose per Fraction, Hypofractionated Treatment Effects in the Clinic) initiative is to systematically pool published peer-reviewed clinical data to further refine dose, volume, and outcome estimates for both normal tissue complication probability (NTCP) and tumor control probability (TCP)21–24 for SRS/SBRT. As with QUANTEC, the aim was to extract and pool published data in a clinically useful format. While QUANTEC focused on NTCP, HyTEC also includes TCP, as favorable tumor control has been the driving force in the growth of SBRT. We are most appreciative of the many authors who have contributed data on this topic to the current literature and thus have made this HyTEC effort possible.
The HyTEC project was established within the Biological Effects Sub-Committee (BESC) of AAPM as the Working Group on Biological Effects of Hypofractionated Radiotherapy/SBRT (the WGSBRT). This collaborative effort involves many people with diverse expertise including physicians, clinical physicists, radiobiologists, biostatisticians, and biomathematicians. We believe that this is a clinically relevant review given the rapid adoption of SRS/SBRT approaches for an increasing number of patients.
Performing the reviews, synthesizing the data, and writing the reports has been time consuming and slower than intended, owing in part to the rapidly evolving literature and the administrative oversight. Further, the review process for the organ-specific papers has been rigorous; for example, requiring approval from the HyTEC Steering Committee, the physician and physicist WGSBRT and BESC reviewers, the BESC as a whole, the Therapy Physics Committee, the Science Council and Executive Committee of AAPM, and finally the editorial scrutiny of the Red Journal.
Historical Context
Efforts to characterize the relationship between the dose of ionizing radiation and resulting normal tissue and tumor effects have been ongoing for over a century.25 By 1926, tables of dose tolerance estimates were becoming available,26 commonly normalized in terms of erythema dose.27,28 A 1928 dose-response curve for skin erythema is shown in Figure 1a.28 The tradeoff between TCP and NTCP was conceptualized by Holthusen29 in 1936, as shown in Figure 1b, and studied by many investigators including Strandqvist30 in 1944, Cohen31 in 1960, Suit32 in 1966, and Mendelsohn33 in 1969. Rubin and Bakemeier2 added the concepts of TD 5/5 and TD 50/5 (tolerance dose resulting in a 5% and 50% risk of toxicity at 5 years, respectively; see Fig. 1c) and articulated the essence of therapeutic ratio when they wrote, “The choice of dose is dependent upon weighing the probability of cure versus the probability of complication.”
Fig. 1.
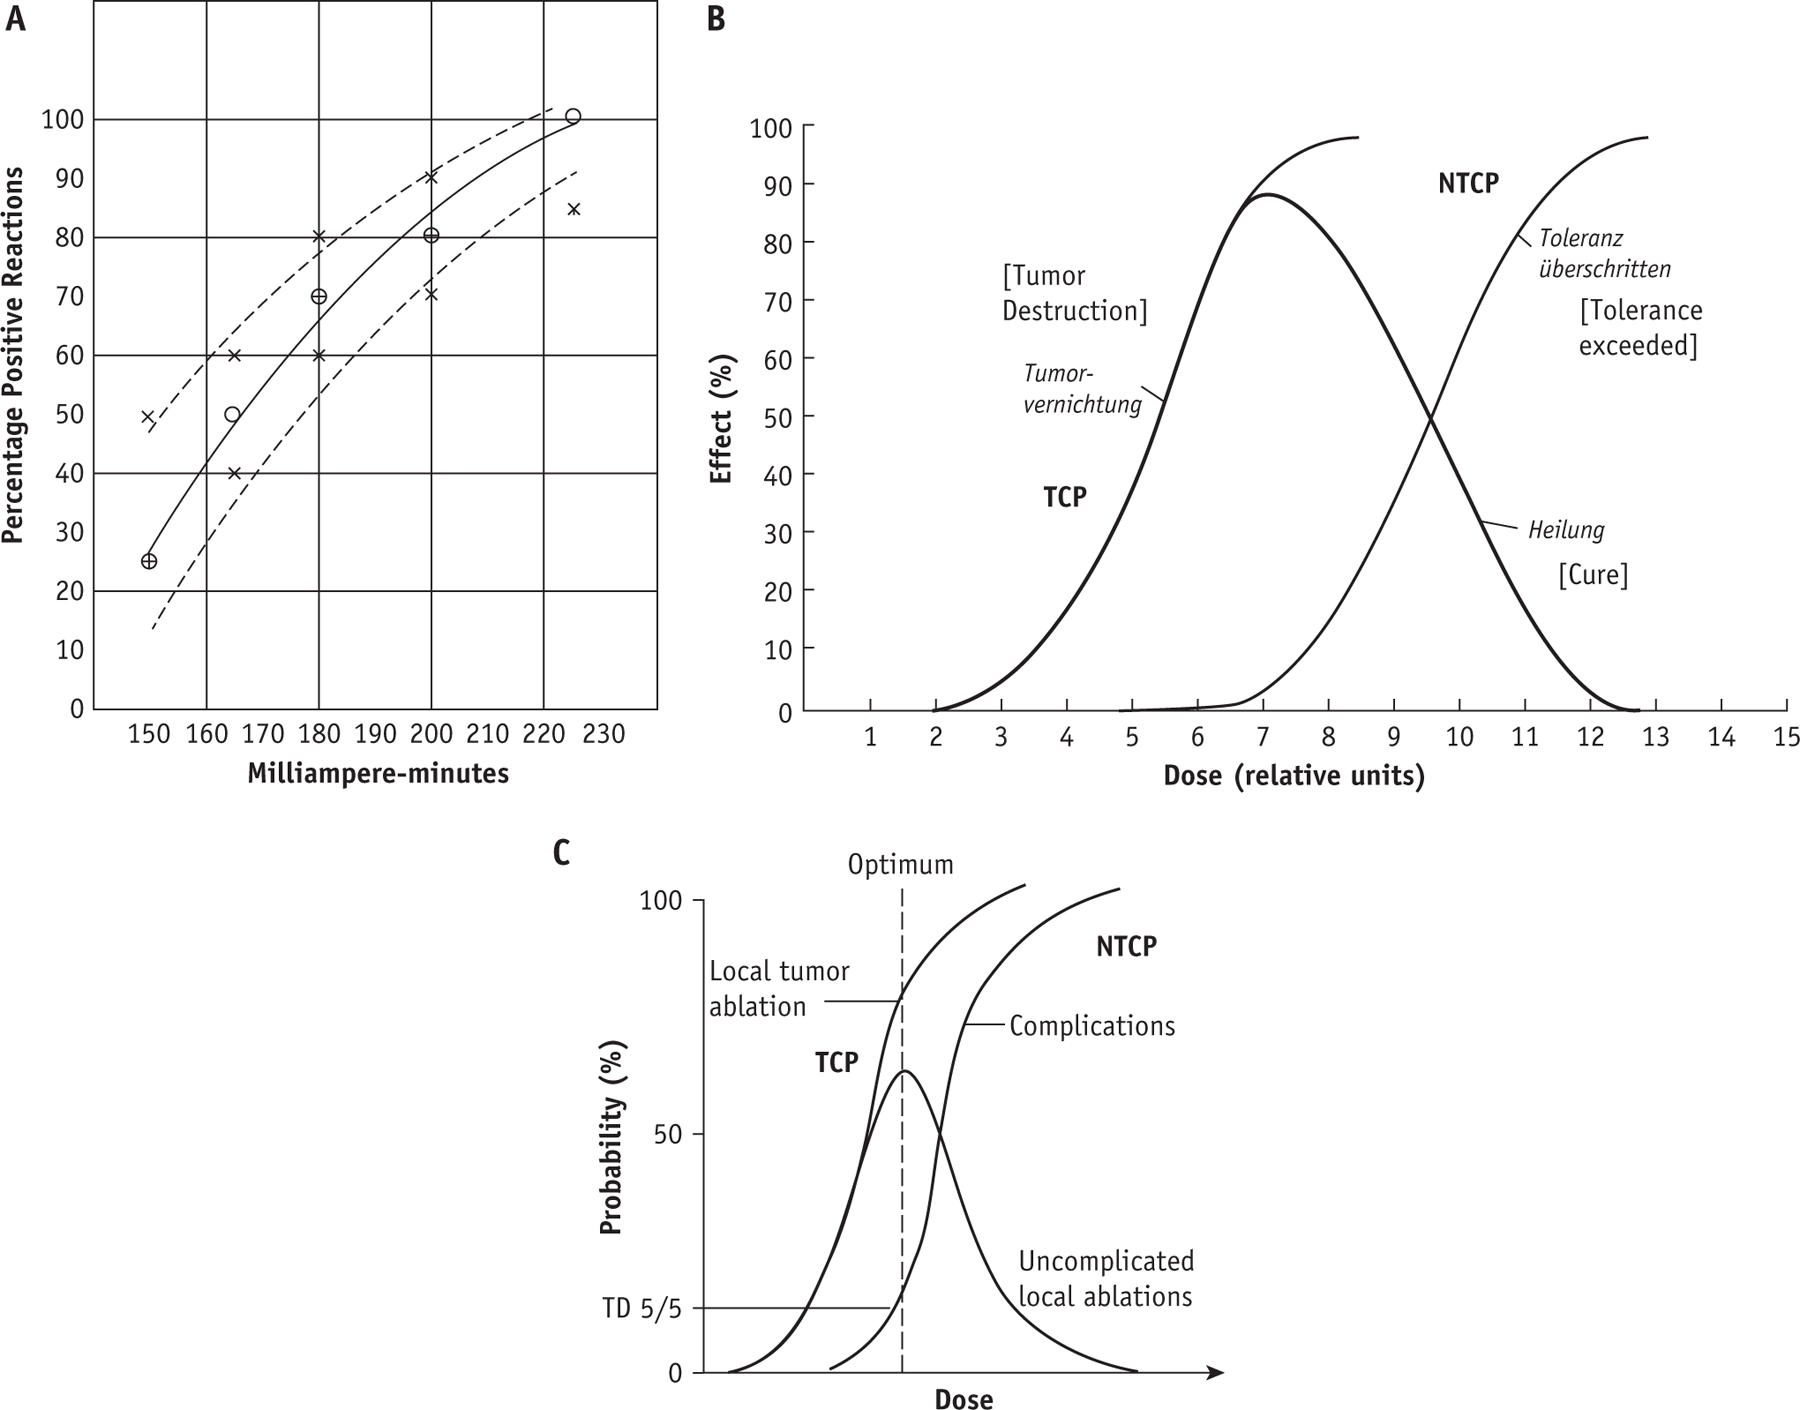
(a) An early dose response curve for skin erythema from 1928 for 165 kV photons; the dashed lines are confidence intervals formed by adding or deleting 1 complication.28 (b) An idealized relationship between dose, tumor control probability (TCP), normal tissue complication probability (NTCP), and uncomplicated control by Holthusen29 from 1936. (c) Graphic illustration of TD 5/5 (tolerance dose resulting in a 5% risk of toxicity at 5 years) by Rubin and Bakemeier.2
The advent of computed tomography (CT)—based treatment planning revolutionized radiation therapy and the study of NTCP and TCP. Although computerized tools provided planners and physicians with CT-based 3-dimensional information, there was a scarcity of reliable dose, volume, and outcome data to help guide planning decisions. The need to address this was recognized by a National Cancer Institute-funded Collaborative Working Group. Their work resulted in the classic 1991 Red Journal “Emami paper.”4 That publication partially filled that void by providing dose, volume, and outcome estimates, based on literature review and expert opinion, for values of TD 5/5 and TD 50/5 for each organ. This uniform approach provided consistency across organs and facilitated modeling5 to gather estimates for more clinically relevant levels of risk. This work helped to guide therapy for over 2 decades and became the most widely cited paper in the Red Journal.34
Published reports of clinical dose, volume, and complications data from CT-based radiation treatments in the subsequent decades served as the basis for the 2010 QUANTEC papers published in the Red Journal. QUANTEC summarized dose, volume, and outcome data largely in the range of clinically appropriate risks, which vary between organs.
The QUANTEC reviews were accompanied by general encouragement for the research community to aspire toward more complete reporting of dose-response relationships for both tumor and normal tissue effects to facilitate data pooling (eg, with comprehensive reporting of treatment variables, use of electronic journal supplements as necessary for completeness, and careful definition of structures and endpoints).35,36 Although laudable, this approach has not been widely adopted, and thus a decade after QUANTEC, the extraction of dose-response data from the SRS/SBRT literature remains challenging. Nevertheless, the HyTEC team was motivated to analyze available data in the domain of hypofractionated radiotherapy given the burgeoning interest in shortened treatment schedules in recent years. Characteristics of Emami et al, QUANTEC, and HyTEC are compared in Table 1.
Table 1.
| Characteristic | Emami et al. | QUANTEC | HyTEC |
|---|---|---|---|
| Scope | 26 normal tissues/organs | 16 normal organs | 7 normal organ papers; NTCP 9 disease site papers; TCP |
| 3D data available | Minimal | More/moderate (studies span ≈ 18-year interval) | Moderate but rapidly increasing |
| Format dose, volume, and outcome data | Uniform levels of risk (eg, TD 5/5, 50/5); uniform irradiation of 1/3, 2/3, 3/3’s of an organ | Nonuniform levels of risk across organs; range of dose-volume metrics | Nonuniform levels of risk across organs; range of dose-volume metrics |
Abbreviations: 3D = 3-dimensional; HyTEC = Hy Dose per Fraction, Hypofractionated Treatment Effects in the Clinic; NTCP = normal tissue complication probability; QUANTEC = Quantitative Analyses of Normal Tissue Effects in the Clinic; TCP = tumor control probability; TD 5/5 and TD 50/5 = tolerance dose resulting in a 5% and 50% risk of toxicity at 5 years, respectively.
HyTEC Overview
By agreement between AAPM and the American Society for Radiation Oncology, the HyTEC reports are being published in the International Journal of Radiation Oncology, Biology, Physics, with manuscripts available to the AAPM’s membership via their web site. The HyTEC reports include organ/tumor-specific papers addressing TCP and NTCP for 6 anatomic sites: cranial, head and neck, thoracic, abdominal, pelvic, and spinal (a total of 9 articles for TCP and 7 for NTCP). The HyTEC organ- and tumor-specific papers largely have sections addressing:
Clinical significance
Endpoints
Challenges defining and segmenting anatomic volumes
Review of outcomes data
Factors affecting outcomes
Mathematical/biological models
Special situations
Recommended dose-volume objectives
Future studies
Reporting standards for outcomes
A summary of the key dose, volume, and outcome data for the organs and tumors considered in HyTEC is provided in Tables 2 and 3. In generating the table entries, preference was given to providing published clinical data when available. Thus, for situations where both clinical and model-based data were available, the clinical data were favored. Further, the NTCP data shown are largely for patients who have received no prior radiation therapy (RT), and the entries reflecting situations with prior RT are so noted. We recognize and emphasize that the data are imperfect. For many tumor sites, local recurrence is difficult to establish with certainty by noninvasive imaging methods, and there are statistical issues (eg, competing risks, a failure to consistently assess for local failure in patients with systemic disease, and favorable patient selection for both retrospective analyses and prospective studies) that collectively may tend to overestimate the true local control rates across an entire population.
Table 2.
| Organ | Volume segmented | Number of fractions | Endpoint | Dose (Gy) or dose-volume parameters | Rate (%)* | Notes |
|---|---|---|---|---|---|---|
| Brain; for metastasis | Total brain including target | 1 | Symptomatic necrosis | V12Gy ≤ 5 cm3 | 10% | From Table 3 and Figs. 4 and 5 in paper. Consistent with QUANTEC. Prior whole brain RT appears to not markedly increase risks in most reports (with the exception of brain stem).† However, repeat SRS/fSRS to the same area has been associated with markedly increased risks. |
| 1 | Symptomatic necrosis | V12Gy ≤ 10 cm3 | 15% | |||
| 1 | Symptomatic necrosis | V12Gy ≤ 15 cm3 | 20% | |||
| 3 | Edema or necrosis | V20Gy ≤ 20 cm3 | ≤ 10% | |||
| 3 | Edema or necrosis | V20Gy ≤ 30 cm3 | ≤ 20% | |||
| 5 | Edema or necrosis | V24Gy ≤ 20 cm3 | ≤ 10% | |||
| 5 | Edema or necrosis | V24Gy ≤ 30 cm3 | ≤ 20% | |||
|
| ||||||
| Brain; SRS for arteriovenous malformation | Total brain including target | 1 | Symptomatic necrosis | V12Gy ≤ 10 cm3 | ≤ 10% | From Figure 2 in paper |
|
| ||||||
| Optic pathway | Optic nerves and chiasm | 1 | Neuropathy | Dmax < 10–12 Gy | < 1% | From Table 3 in paper Consistent with QUANTEC Prior RT exposure of the optic pathway (either whole brain RT or SRS/fSRS) appears to markedly increase risks. |
| 3 | Neuropathy | Dmax < 20 Gy | < 1% | |||
| 5 | Neuropathy | Dmax < 25 Gy | < 1% | |||
|
| ||||||
| Carotid artery (re-treatment) | Each carotid artery | 5 | Grade 3–5 bleeding | Dmax < 20–30 Gy | < 2–12% | Dose-volume metric shown is for the reirradiation SBRT dose in patients with prior RT‡ |
|
| ||||||
| Each carotid artery | 5 | Grade 3–5 bleeding | D0.5cc< 20 Gy | < 2–12% | Dose-volume metric shown is for the reirradiation SBRT dose in patients with prior RT‡ | |
|
| ||||||
| Lungs | Combined lungs minus target§ | 3–5 | Grade ≥ 2 toxicity§ | Mean dose ≤ 8 Gy; V20Gy < 10–15% | 10–15% | Preexisting interstitial lung disease appears to increase toxicity risk |
|
| ||||||
| Liver; SBRT for primary lesions | Liver minus GTVs‖ | 3 | Grade ≥ 3 liver enzyme change | Mean dose ≤ 13 Gy | <20% | For patients with intact liver function. Various clinical factors (eg, underlying liver impairment per the Child Pugh score, platelet count) can reduce liver tolerance.# Consistent with QUANTEC (that broadly considered radiation induced liver injury; this includes liver enzyme changes). |
| Liver minus GTVs‖ | 6 | Grade ≥ 3 liver enzyme change | Mean dose ≤ 18 Gy | <20% | ||
|
| ||||||
| Liver; SBRT for metastases | Liver minus GTVs‖ | 3 | Grade ≥ 3 liver enzyme change | Mean dose ≤ 15 Gy <20% | <20% | |
| Liver minus GTVs‖ | 6 | Grade ≥ 3 liver enzyme change | Mean dose ≤ 20 Gy | <20% | ||
|
| ||||||
| Liver; SBRT for metastases | Liver minus GTVs‖ | 3–6 | Liver dysfunction and grade 3–5 general GI toxicity¶ | ≥ 700 cm3 receives ≤ 15–17 Gy# | <13% | Critical volume limit, spare 700 cm3** |
|
| ||||||
| Bladder | Bladder (as a solid organ)†† | 4–5 | Late grade ≥ 2 urinary toxicity | VPrescription Dose < 5–10 cm3 | <20% | In context of prostate SBRT. All reviewed prescription doses were 35–40 Gy in 4–5 fractions. See Pelvic NTCP paper, Table 4, for additional constraints. Many of the reviewed studies treated every-other-day in hopes of reducing toxicity. |
|
| ||||||
| Rectum | Rectum (as a solid organ)†† | 4–5 | Late grade ≥ 3 bowel toxicity | Dmax < 35–38 Gy | <3% | |
|
| ||||||
| Urethra | Prostatic urethra | 4–5 | Late grade ≥ 2 urinary toxicity | Dmax < 38–42 Gy | <20% | |
|
| ||||||
| Spinal cord | Spinal cord, canal, or thecal sac‡‡ | 1 | Myelopathy | Dmax < 12.4–14 Gy | 1–5% | These data are for patients Table 3 in paper). Information for the setting of re-irradiation are in Table 4 of the paper. Consistent with QUANTEC. |
| 2 | Dmax < 17–19.3 Gy | 1–5% | ||||
| 3 | Dmax < 20.3–23.1 Gy | 1–5% | ||||
| 4 | Dmax < 23–26.2 Gy | 1–5% | ||||
| 5 | Dmax < 25.3–28.8 Gy | 1–5% | ||||
Abbreviations: CTV = clinical target volume; Dmax = maximum dose; GI = gastrointestinal; GTV = gross target volume; HyTEC = Hy Dose per Fraction, Hypofractionated Treatment Effects in the Clinic; NTCP = normal tissue complication probability; PTV = planning target volume; QUANTEC = Quantitative Analyses of Normal Tissue Effects in the Clinic; RT = radiation therapy; SBRT = stereotactic body radiation therapy; SRS = stereotactic radiosurgery.
Although the source data may have included some patients who had undergone reirradiation (refer to the individual reports for specifics), unless stated otherwise, the NTCP risks from the compiled data are meant to apply for patients who received no prior radiotherapy. Acceptable risk in any given patient should reflect the clinical decision making of the physician and consent of the patient. Providers are strongly advised to use the individual HyTEC articles to assess the full context and applicability of these values for each scenario. Because the overall survival duration is limited in many patients who receive SRS/SBRT, the long-term NTCP may not be accurately represented by the reported data. There are several other reference documents that address these and other sites (eg, Seminars in Radiation Oncology37,38).
Prior whole brain RT appears to increase risk of subsequent SRS/fSRS to the brain stem (see brain stem subsection in special situations section of the paper).
Nominal prior prescription of 200 cGy × 35 fractions = 7000 cGy. Major risk factors include: circumferential irradiation of carotid or other major vessel; skin invasion by cancer; necrosis or infection at site; surgical manipulation of site before, and <6 month interval since prior RT.
Most studies appear to have excluded the target volume (eg, GTV, CTV, or PTV) from the calculation of lung dose-volume parameters (see Tables 3 and E1 in paper). Variable grading scales used.
Evaluation structure in most reviewed papers for liver enzyme changes is liver minus GTV.
GI toxicity includes: fatigue, nausea, diarrhea, gastritis, ulcers, GI area pain, colitis.
Since this analysis was completed, there have been additional studies relating dose-volume metrics to clinically relevant endpoints that were not included in this work (eg, decline in synthetic liver function). Dose metrics (eg, mean dose or D 800 cm3, maximum dose to the coldest 800 cm3) have been associated with these endpoints; (eg, see Velec et al39 and Pursley et al40).
In patients with hepatocellular cancer, sparing ≥800 cm3 to ≤18 Gy in 3 fractions has been suggested (Son et al41).
Solid organ refers to the entire volume included within the external wall (as opposed to the approach some have taken to consider only the wall of these organs; that is, excluding the contents).
A range of doses and complication rates are reported, reflecting the heterogeneity and uncertainty in the data. The spinal cord, canal, and the thecal sac have each been used in different models of radiation myelopathy.
Table 3.
Summary of TCP estimates from the HyTEC reports*
| Tumor site/type | Volume segmented, margin | Number of fractions | Endpoint† | Dose (Gy), or dose-volume parameters‡ | Rate (%)† | Notes |
|---|---|---|---|---|---|---|
| Brain metastases | GTV + 0–2 mm margin§ | 1 | 2-year loca control, by lesion size | ≤2 cm, 18–24 Gy | 80%–95% | 1-year local control ≈ ≥85%–90% |
| 1 | 2–3 cm, 18 Gy | 66% | 1-year local control ≈ 75% | |||
| 1 | >3 cm, 15 Gy | 47% | 1-year local control ≈ 70% | |||
| 3 | 2–3 cm, 24–30 Gy | 65%–84% | 1-year local control ≈ 80% | |||
| 3 | >3 cm, 21–27 Gy | 53%–69% | 1-year local control ≈ 75% | |||
| 5 | 2–3 cm, 30–35 Gy | 75%–85% | 1-year local control ≈ 80% | |||
| 5 | >3 cm, 25–30 Gy | 59%–69% | 1-year local control ≈ 75% | |||
|
| ||||||
| Vestibular Schwannoma | GTV+ 0–2 mm margin‖ | 1 | 3–5 year local control | ≥12 Gy | ≥91% | Variable PTV margins used. Most available data are with a single fraction. |
| 3 | 18 Gy | ≥91% | ||||
| 5 | 25 Gy | ≥91% | ||||
|
| ||||||
| Head & neck; retreatment | GTV + 0–6 mm margin | 5 | 2-year local control | 45 Gy | 50% | Majority of newer studies used 2–6 mm margin |
|
| ||||||
| Lung; T1–2 lesions¶ | ITV or IGTV + 3–8 mm | 3 | 1–5 year local control | 33 Gy | <50% | Based on minimal data |
| 3 | 1–5 year local control | 45–54 Gy | ≥75% | In most studies | ||
| 3 | 1–5 year local control | ≥60 Gy | ≥80%–85% | In most studies | ||
| 4 | 1–5 year local control | 42–48 Gy | ≥70% | In most studies | ||
| 4 | 1–5 year local control | >52 Gy | ≥80%–85% | In most studies | ||
| 5 | 1–3 year local control | ≥ 50 Gy | ≥ ≈ 80% | In all studies | ||
|
| ||||||
| Liver; primary tumor | Variable | 3–5 | 2-year local control | BED10 = 60–72 Gy# | 90% | No clear dose response relationship within the range of reported schedules (including 11–18 Gy x 3; 12 Gy x 4; 8–10 Gy x 5). Authors recommend 8–10 Gy x 5 as a conservative approach. |
|
| ||||||
| Liver metastases | Variable | 1–5 | 2-year local control | BED10 > 100 Gy# | ≥90% | Estimated based on BED10 >112, including 15–25 Gy x 3 |
| 1–5 | BED10 < 100 Gy# | 65%–76% | Estimated based on BED10 ranging from 60–84 Gy, including 24–26 Gy x 1; 10–12.5 Gy x 3; 10 Gy x 4 | |||
|
| ||||||
| Adrenal | Mixed** | Median 5†† | 1-year local control | Prescription BED10 > 116.4 Gy | >95% | Model-based estimate. Clinical examples of fractionation schedules providing BEDs in this range include 15 Gy x 3 = 45 Gy (BED10 = 112.5) and 11 Gy x 5 = 55 Gy (BED10 = 115.5 Gy). Respiratory motion control in all studies. |
|
| ||||||
| Pancreas | GTV + 2–5 mm | 1 | 1-year local control | 20–25 Gy | 79%–88% | Rates shown are without surgery (reported local control rates are higher in patients with surgery preor post-SBRT) |
| 3 | 30–36 Gy | 79%–86% | ||||
| 5 | 33 Gy | 77% | ||||
|
| ||||||
| Prostate, low-intermediate risk | Varied: prostate + 0–5 mm PTV margin | 5 | 5-year freedom from biochemical relapse | 36.1 Gy‡‡ | 95% | |
| Prostate, high risk | 5 | 38.7 Gy‡‡ | 95% | Caution is needed in interpreting these data because few such patients are included in the published literature and these are likely highly selected patients. | ||
|
| ||||||
| Spine§§ | CTV + 0–2 mm | 1 | 2-year local control | 18 Gy | 82% | Much uncertainty exists in interpreting the data from the literature and in the creation of these resultant model based estimates. |
| 1 | 20 Gy | 90% | ||||
| 1 | 22 Gy | 94% | ||||
| 1 | 24 Gy | 96% | ||||
| 2 | 24 Gy | 82% | ||||
| 3 | 27 Gy | 78% | ||||
| 3 | 30 Gy | 85% | ||||
Abbreviations: GTV = gross target volume; HyTEC = Hy Dose per Fraction, Hypofractionated Treatment Effects in the Clinic; PTV = planning target volume; SBRT = stereotactic body radiation therapy; TCP = tumor control probability.
The control probability in any given individual cannot be accurately quantified. Acceptable goals in any given patient should reflect the clinical decision making of the physician and consent of the patient. Providers are strongly advised to use the individual HyTEC articles to assess the full context and applicability of these values for each scenario. There are several other reference documents that address these and other issues (eg, Seminars in Radiation Oncology37,38).
Some reports estimate local control via an actuarial method. Care is needed when interpreting actuarial data in the setting of metastatic cancer. Often, the local control is estimated by censoring patients at the time of death, and the accuracy of actuarial techniques requires that censoring events should be independent of the endpoint under consideration. Because the pace of disease beyond the treated site (that can cause the censoring event of death) and the pace of regrowth of treated site (that obviously impacts local recurrence) are likely related, actuarial estimates may not be accurate and may overstate the local control. (Gelman42). Similarly, for many tumor sites, local recurrence is difficult to establish with certainty by noninvasive imaging methods, and there are other statistical issues (eg, a failure to consistently assess for local failure in patients with systemic disease, and favorable patient selection for both retrospective analyses and prospective studies) that collectively may tend to overestimate the true local control rates across an entire population.
BED, biological effective dose, calculated per linear quadratic model = total dose × (1 + (dose per fraction) / (α/β) ) BED10 = BED calculated with an α/β= value of 10.
Brain: GTV to PTV expansion range was 0–3 mm, but most people use 0–2 mm given concern for increased radionecrosis with larger expansions. The median expansion in the reviewed studies was 1 mm.
Vestibular Schwannoma: Only 29% of manuscripts reported the use of a PTV margin of 1 or 2 mm; therefore, for most data, GTV was assumed to be the same as PTV.
Lung: Planning generally with 3D rather than intensity modulated radiation therapy (IMRT). Doses listed are to the PTV. Since this analysis was completed, there have been additional models suggested (eg, Jeong et al43).
This paper used the notation Gy10 rather than BED10 as is used in other HyTEC papers, but they are mathematically the same.
Adrenal: Targets were mixed: GTV, ITV, or PTV. PTV is usually GTV or ITV 3–10 mm; usually there is no margin for CTV.
Adrenal median over all studies = 5 (range, 1–27).
Prostate: Many series use heterogeneous planning, intentionally including hot spots within the much of the prostate. The average prescription isodose line reported among studies used in the manuscript was 85%, and most of those had prescription isodose lines of 70%–90%. The prescription isodose line for heterogeneous planning may run as low as 50%, to more specifically mimic the intraprostatic dose escalation morphology characteristics of HDR brachytherapy.
Spine: A minimum dose to the tumor (Dmin) of greater than 14–15 Gy in a single fraction equivalent or a GTV D95 of greater than 18.3 Gy in 1 fraction may correlate with tumor control to a greater degree than the prescribed dose. Thus, if able, care should be taken to minimize under-dosage of the target tissues. Please see section 8 of the paper for a deeper discussion of this issue.
The highest level of evidence to establish dose-response relationships would be structured, prospective clinical trials that record normal tissue and tumor effects at prespecified levels. Such trials are very uncommon, however. The HyTEC TCP and NTCP analyses are an effort to characterize patterns observed within and among institutions. In principle, as long as there is clear reporting and consistent high-quality dose, volume, and outcome data, there should be validity to such analyses.
The HyTEC authors took the pragmatic approach of reviewing the available literature and pooling data from publications containing the minimal set of data elements needed for a meaningful analysis (eg, clearly stated dose schedules, prescription practices, critical structure dose reporting, and clinical outcomes for toxicity or tumor control). From these analyses, the subgroups summarized the dose, volume, and outcome data, and when possible, generated associated models, while at the same time acknowledging the uncertainties. We emphasize and acknowledge that the models used in many of these reports are imperfect (eg, the linear quadratic model is simplistic), but support their use as a tool to try to pool data. Data pooling was often limited by the retrospective nature of much of the published data and by a lack of clarity and inconsistencies/uncertainties regarding critical items such as (1) dose calculation and specification, (2) image segmentation, (3) outcome definitions (for both toxicity and tumor-control), and (4) accounting for competing risks and variable follow-up durations. The HyTEC effort also includes several “vision papers” addressing immunomodulatory effects, indirect cell death, and common modelling approaches used in HyTEC.
Opportunities for Better Data
Data on radiation therapy outcomes are typically communicated through peer-reviewed journal articles. Alhough a single report seldom presents the full scope of TCP/NTCP tradeoffs at any disease site, the HyTEC and QUANTEC projects demonstrate that,35 with considerable effort, dedicated investigators can extract patterns that may apply beyond an individual study. However, we, as a field, need to do better in making high-quality dose, volume, and outcome data accessible for pooling and combined analysis. This clearly would help our patients, and it would also help clinicians whose routine treatment planning decisions are made more difficult by uncertainties in the risk and benefit of a planned treatment. Further, the increasing focus on value, and in providing evidence for the utility of our therapies to payers and patients, mandates that we do this. Indeed, the future of our specialty may rely on it.
The overarching principles for better data reporting have been previously described in detail as part of the initial QUANTEC effort.35 Each HyTEC organ paper provides suggestions for reporting in future studies. Collecting and reporting dose, volume, and outcome can be challenging, and our field needs to do more to improve reporting.
Idealized future state
We should not shirk from this challenge, as there is reason to be optimistic. First, RT in general, and SBRT in particular, are potent anticancer therapies.44 In almost every disease where it has been formally tested, RT has been demonstrated to improve cancer-specific outcomes. And, when tested head-to-head against other therapies, RT may provide an improved therapeutic ratio.45,46 Second, RT (and SBRT) appears to be generally very well tolerated, as can be seen from the HyTEC complications reviews and associated literature. Third, in addition to the tools that produced the data used by HyTEC (and QUANTEC before it), there are an increasing number of new and existing tools and methods that can be better-leveraged to improve our ability to gather dose, volume, and outcome data:
Electronic health records afford the opportunity to collect discrete patient (eg, age, sex, comorbid conditions), tumor (eg, stage, location), treatment (eg, chemotherapy, surgery), and outcome (tumor control and normal tissue toxicity) data.
“Contouring atlases” provide guidance for standardized image segmentation of both targets and normal structures that should reduce inter-planner/institution variations. Standard structure names (eg, AAPM TG 26347) afford the opportunity for common structures to be named similarly. Together, these should facilitate the accurate pooling of data.
Treatment planning systems afford the opportunity to collect discrete data regarding dose-volume parameters.
Standard toxicity reporting systems (eg, Common Terminology Criteria for Adverse Events) afford the opportunity for more interobserver consistency.
The ever-increasing use of the internet allows for rapid investigator communication and interinstitutional data pooling.
Journals that encourage submission of detailed supporting data for accepted publications as well as “data-only” submissions. For example, the American Society for Radiation Oncology’s journals support this concept,48 and Medical Physics has introduced “dataset articles”49 that can be used for outcome datasets.
Increasing ability to associate outcome with delivered—as well as planned—dose due to advances in image guidance and dose accumulation. This is particularly important for SBRT where image guidance is common.
The culture of “patient empowerment” allows patients to be more involved in their own care (eg, shared decision making, routine access to their electronic medical record) and to perhaps more consistently report desired clinical data (eg, patient reported outcomes) discretely into the electronic health record, thus facilitating data collection.
An idealized future state that facilitates the collection of discrete data (using the tools outlined above) is shown in Figure 2.
Fig. 2.

Idealized future state where discrete data (optimally collected as part of routine clinical workflow) is pulled from various electronic sources to yield more robust clinical, dose, volume, and outcome data. A concerted multipronged approach (eg, involving vendors, administrators, providers, etc) will be needed to reach this future state.51 Abbreviations: CTC-AE = Common Terminology Criteria for Adverse Events; IGRT = image guided radiation therapy; TG = task group.
Conclusions
RT has been used for decades as an effective tool to alleviate suffering and to cure patients of potentially lethal conditions. However, as for any medical intervention, potential benefits coexist with potential toxicities. A clear understanding of dose, volume, and outcome data for both tumors and normal tissues is essential to optimize the therapeutic ratio and maximize the value of care to the patient. The present HyTEC effort was intended to help meet this need for patients undergoing SBRT and similar hypofractionated treatment regimens.
Almost all of the data in QUANTEC and HyTEC were derived from adults, and the information reported may not be applicable to children. Children present a unique set of challenges, as their developing/growing tissues are often particularly sensitive to the effects of RT. Further, because a large fraction of pediatric cancers are curable, previously treated patients remain at risk of late-effects for decades. Similar to HyTEC, PENTEC (Pediatric Normal Tissue Effects in the Clinic) is an ongoing parallel effort to comprehensively review and analyze radiation dose, volume, and outcome data in childhood cancer survivors, including the effect of chemotherapy and other risk factors (eg, genetic predispositions); see https://www.pentecradiation.org/: An international collaboration to analyse normal tissue radiation dose-volume response relationships for paediatric cancer patients.50 PENTEC reports will begin to appear in the Red Journal in the coming months.
In the future, more streamlined means of collecting and curating dose-volume-response data could facilitate projects such as HyTEC and PENTEC and lead to an improved overall fund of knowledge that could translate into even higher quality care for patients receiving RT.
Acknowledgements—
The Steering Committee thanks the many investigators whose published work was reviewed and the Red Journal team for their patience and commitment to the project. We especially thank the many authors who have contributed to this initiative for their efforts, patience, and flexibility, to the American Association of Physicists in Medicine staff and leadership for their ongoing support and vision, and to the many committee-member reviewers for their guidance.
Disclosures:
J.G. received grants from Accuray and from NovoCure outside the submitted work and was issued a patent, DVH Evaluator. A.J. received partial support from NIH grant P30 CA008748 during the conduct of the study. E.Y. was partly supported by NCI Cancer Center Support Grant P30 CA008748.
Footnotes
Data sharing statement: Data generated and analyzed during this study are included in the HyTEC organ-specific papers and supplementary information files.
References
- 1.Rubin P, Casarett GW. Clinical Radiation Pathology. Philadelphia, PA: W.B. Saunders Company; Ltd; 1968. [DOI] [PubMed] [Google Scholar]
- 2.Rubin P, Bakemeier RF. Clinical Oncology for Medical Students and Physicians. A Multidisciplinary Approach. 4th ed. New York: American Cancer Society; 1974. [Google Scholar]
- 3.Rubin P, Constine LS, Marks LB. ALERT – Adverse Late Effects of Cancer Treatment. Heidelberg: Springer; 2014. [Google Scholar]
- 4.Emami B, Lyman J, Brown A, et al. Tolerance of normal tissue to therapeutic irradiation. Int J Radiat Oncol Biol Phys 1991;21:109–122. [DOI] [PubMed] [Google Scholar]
- 5.Burman C, Kutcher GJ, Emami B, Goitein M. Fitting of normal tissue tolerance data to an analytic function. Int J Radiat Oncol Biol Phys 1991;21:123–135. [DOI] [PubMed] [Google Scholar]
- 6.Marks LB, Yorke ED, Jackson A, et al. Use of normal tissue complication probability models in the clinic. Int J Radiat Oncol Biol Phys 2010;76(3 Suppl):S10–S19. [DOI] [PMC free article] [PubMed] [Google Scholar]
- 7.Asbell SO, Grimm J, Xue J, Chew MS, LaCouture TL. Introduction and Clinical Overview of the DVH Risk Map. Semin Rad Onc 2016; 26:89–96. [DOI] [PubMed] [Google Scholar]
- 8.Chang BK, Timmerman RD. Stereotactic body radiation therapy: A comprehensive review. Am J Clin Oncol 2007;30:637–644. [DOI] [PubMed] [Google Scholar]
- 9.Timmerman RD. An overview of hypofractionation and introduction to this issue of seminars in radiation oncology. Semin Radiat Oncol 2008;18:215–222. [DOI] [PubMed] [Google Scholar]
- 10.Benedict S, Yenice KM, Followill D, et al. Stereotactic body radiation therapy: The report of AAPM Task Group 101. Med Phys 2010;37: 4078–4101. [DOI] [PubMed] [Google Scholar]
- 11.Kim DWN, Medin PM, Timmerman RD. Emphasis on repair, not just avoidance of injury, facilitates prudent stereotactic ablative radiotherapy. Semin Radiat Oncol 2017;27:378–392. [DOI] [PubMed] [Google Scholar]
- 12.Timmerman R, Paulus R, Galvin J, et al. Stereotactic body radiation therapy for inoperable early stage lung cancer. JAMA 2010;303:1070–1076. [DOI] [PMC free article] [PubMed] [Google Scholar]
- 13.Crabtree T, Puri V, Timmerman R, et al. Treatment of stage I lung cancer in high-risk and inoperable patients: Comparison of prospective clinical trials using stereotactic body radiotherapy (RTOG 0236), sublobar resection (ACOSOG Z4032), and radiofrequency ablation (ACOSOG Z4033). J Thorac Cardiovasc Surg 2013;145:692–699. [DOI] [PubMed] [Google Scholar]
- 14.King CR, Freeman D, Kaplan I, et al. Stereotactic body radiotherapy for localized prostate cancer: Pooled analysis from a multi-institutional consortium of prospective phase II trials. Radiother Oncol 2013;109:217–221. [DOI] [PubMed] [Google Scholar]
- 15.Ryu S, Pugh SL, Gerszten PC, et al. RTOG 0631 phase 2/3 study of image guided stereotactic radiosurgery for localized (1–3) spine metastases: Phase 2 results. Pract Radiat Oncol 2014;4:76–81. [DOI] [PMC free article] [PubMed] [Google Scholar]
- 16.Stanic S, Paulus R, Timmerman RD, et al. No clinically significant changes in pulmonary function following stereotactic body radiation therapy for early-stage peripheral non-small cell lung cancer: An analysis of RTOG 0236. Int J Radiat Oncol Biol Phys 2014;88:1092–1099. [DOI] [PMC free article] [PubMed] [Google Scholar]
- 17.Videtic GM, Hu C, Singh AK, et al. A randomized phase 2 study comparing 2 stereotactic body radiation therapy schedules for medically inoperable patients with stage I peripheral non-small cell lung cancer: NRG Oncology RTOG 0915 (NCCTG N0927). Int J Radiat Oncol Biol Phys 2015;93:757–764. [DOI] [PMC free article] [PubMed] [Google Scholar]
- 18.Katz MHG, Ou FS, Herman JM, et al. Alliance for clinical trials in oncology (ALLIANCE) trial A021501: Preoperative extended chemotherapy vs. chemotherapy plus hypofractionated radiation therapy for borderline resectable adenocarcinoma of the head of the pancreas. BMC Cancer 2017;17:505. [DOI] [PMC free article] [PubMed] [Google Scholar]
- 19.Zhao J, Yorke ED, Ling L, et al. Simple factors associated with radiation-induced lung toxicity after stereotactic body radiation therapy of the thorax: A pooled analysis of 88 studies. Int J Radiat Oncol Biol Phys 2016;95:1357–1366. [DOI] [PMC free article] [PubMed] [Google Scholar]
- 20.Liu F, Tai A, Lee P, et al. Tumor control probability modeling for stereotactic body radiation therapy of early-stage lung cancer using multiple bio-physical models. Radiother Oncol 2017;122: 286–294. [DOI] [PMC free article] [PubMed] [Google Scholar]
- 21.Milano MT, Grimm J, Niemierko A, et al. Single and multifraction stereotactic radiosurgery dose/volume tolerances of the brain. Int J Radiat Oncol Biol Phys 2021;110:68–86. [DOI] [PMC free article] [PubMed] [Google Scholar]
- 22.Vargo JA, Moiseenko V, Grimm J, et al. Head and neck tumor control probability: Radiation dose–volume effects in stereotactic body radiation therapy for locally-recurrent previously-irradiated head and neck cancer: Report of the AAPM Working Group. Int J Radiat Oncol Biol Phys 2021;110:137–146. [DOI] [PMC free article] [PubMed] [Google Scholar]
- 23.Ohri N, Tomé WA, Méndez Romero A, et al. Local control after stereotactic body radiation therapy for liver tumors. Int J Radiat Oncol Biol Phys 2021;110:188–195. [DOI] [PMC free article] [PubMed] [Google Scholar]
- 24.Miften M, Vinogradskiy Y, Moiseenko V, et al. Radiation dose-volume effects for liver SBRT. Int J Radiat Oncol Biol Phys 2021;110:196–205. [DOI] [PMC free article] [PubMed] [Google Scholar]
- 25.Holmes G Some experiments in standardization of dosage for Roentgen therapeutics. Am J Röentgenol 1914;1:298–302. [Google Scholar]
- 26.Tsuzuki M Experimental studies on the biological action of hard Roentgen Rays. Am J Röentgenol 1926;16:134–150. [Google Scholar]
- 27.Failla G, Quimby EH, Dean AL. Some problems in radiation therapy. Am J Roentgenol 1922;9:479. [Google Scholar]
- 28.Quimby EH, Pack GT. The skin erythema for combinations of gamma and Roentgen rays. Radiology 1929;13:306; Paper presented at the Radiological Society of North America at the Fourteenth Annual Meeting. Dec. 3–7: 1928; Chicago, IL. [Google Scholar]
- 29.Holthusen H Erfahrungen über die Verträglichkeitsgrenze für Rönt-genstrahlen and deren Nutzanwendung zur Verhütung von Schäden [Experiences on the tolerability limit for X-rays and practical application for the prevention of damage]. Strahlentherapie 1936;57:254–269. [Google Scholar]
- 30.Strandquist M Studien über die kumulative Wirkung der Röntgen-strahlen bei Fraktionierung [Studies on the cumulative effect of X-rays on fractionation]. Acta Radiol 1944;Suppl:1–300. [Google Scholar]
- 31.Cohen L The statistical prognosis in radiation therapy. A study of optimal dosage in relation to physical and biologic parameters for epidermoid cancer. AJR 1960;84:741–753. [PubMed] [Google Scholar]
- 32.Suit HD. Radiation biology: A basis for radiotherapy. Fletcher GH, editor. Textbook of Radiotherapy. 1st ed. Philadelphia, PA: Lea and Febiger; 1966. [Google Scholar]
- 33.Mendelsohn ML. The biology of dose-limiting tissues. In: Time and Dose Relationship in Radiation Biology as Applied to Radiotherapy. Brookhaven National Laboratory [BNL] Report 5023 (C-57). Upton: Brookhaven National Laboratory; 1969. p. 54. [Google Scholar]
- 34.Emami B, Roeske J, Block A, Welsh JS. The Emami paper 25 years later. J Radiat Oncol 2017;6:1–9. [Google Scholar]
- 35.Jackson A, Marks LB, Bentzen SM, et al. The lessons of QUANTEC: Recommendations for reporting and gathering data on dose-volume dependencies of treatment outcome. Int J Radiat Oncol Biol Phys 2010;76(3 Suppl):S155–S160. [DOI] [PMC free article] [PubMed] [Google Scholar]
- 36.Deasy JO, Bentzen SM, Jackson A, et al. Improving normal tissue complication probability models: The need to adopt a “data-pooling” culture. Int J Radiat Oncol Biol Phys 2010;76(3 Suppl):S151–S154. [DOI] [PMC free article] [PubMed] [Google Scholar]
- 37.Seminars in Radiation Oncology 2016;26(2). [Google Scholar]
- 38.Seminars in Radiation Oncology 2017;27(3). [DOI] [PubMed] [Google Scholar]
- 39.Velec M, Haddad CR, Craig T, et al. Predictors of liver toxicity following stereotactic body radiation therapy for hepatocellular carcinoma. Int J Radiat Oncol Biol Phys 2017;97:939–946. [DOI] [PubMed] [Google Scholar]
- 40.Pursley J, ElNaqa I, Sanford NN, et al. Dosimetric analysis and normal-tissue complication probability modeling of child-pugh score and albumin-bilirubin grade increase after hepatic irradiation. Int J Radiat Oncol Biol Phys 2020;107:986–995. [DOI] [PMC free article] [PubMed] [Google Scholar]
- 41.Son SH, Choi BO, Ryu MR, et al. Stereotactic body radiotherapy for patients with unresectable primary hepatocellular carcinoma: dose-volumetric parameters predicting the hepatic complication. Int J Radiat Oncol Biol Phys 2010;78:1073–1080. [DOI] [PubMed] [Google Scholar]
- 42.Gelman R, Gelber R, Henderson IC, et al. Improved methodology for analyzing local and distant recurrence. J Clin Oncol 1990;8:5469–5479. [DOI] [PubMed] [Google Scholar]
- 43.Jeong J, Oh JH, Sonke JJ, et al. Modeling the cellular response of lung cancer to radiation therapy for a broad range of fractionation schedules. Clin Cancer Res 2017;23:5469–5479. [DOI] [PMC free article] [PubMed] [Google Scholar]
- 44.Rahimi A, Timmerman R. Curing metastatic disease with radiation therapy: Myth or reality?-Arguing for reality. Int J Radiat Oncol Biol Phys 2020;107:429–432. [DOI] [PubMed] [Google Scholar]
- 45.Chang JY, Senan S, Paul MA, et al. Stereotactic ablative radiotherapy versus lobectomy for operable stage I non-small-cell lung cancer: A pooled analysis of two randomised trials [published correction appears in Lancet Oncol. 2015 Sep;16(9):e427]. Lancet Oncol 2015;16:630–637. [DOI] [PMC free article] [PubMed] [Google Scholar]
- 46.Donovan JL, Hamdy FC, Lane JA, et al. Patient-reported outcomes after monitoring, surgery, or radiotherapy for prostate cancer. N Engl J Med 2016;375:1425–1437. [DOI] [PMC free article] [PubMed] [Google Scholar]
- 47.Mayo CS, Moran JM, Bosch W, et al. American Association of Physicists in Medicine Task Group 263: Standardizing nomenclatures in radiation oncology. Int J Radiat Oncol Biol Phys 2018;100:1057–1066. [DOI] [PMC free article] [PubMed] [Google Scholar]
- 48.Tegbaru D, Braverman L, Zietman AL, et al. ASTRO journals’ data sharing policy and recommended best practices. Adv Radiat Oncol 2019;4:551–558. [DOI] [PMC free article] [PubMed] [Google Scholar]
- 49.Williamson JF, Das SK, Goodsitt MS, Deasy JO. Introducing the Medical Physics Dataset Article. Med Phys 2017;44:349–350. [DOI] [PubMed] [Google Scholar]
- 50.Constine LS, Ronckers CM, Hua CH, et al. Pediatric Normal Tissue Effects in the Clinic (PENTEC): An international collaboration to analyse normal tissue radiation dose-volume response relationships for paediatric cancer patients. Clin Oncol 2019;31:199–207. [DOI] [PMC free article] [PubMed] [Google Scholar]
- 51.Marks LB. Reality check. Int J Radiat Oncol Biol Phys 2016;95:905–908. [DOI] [PubMed] [Google Scholar]