Abstract
Blue-light-induced repellent and demethylation responses, characteristic of behavioral adaptation, were observed in Rhodobacter sphaeroides. They were analyzed by computer-assisted motion analysis and through the release of volatile tritiated compounds from [methyl-3H]methionine-labeled cells, respectively. Increases in the stop frequency and the rate of methanol release were induced by exposure of cells to repellent light signals, such as an increase in blue- and a decrease in infrared-light intensity. At a λ of >500 nm the amplitude of the methanol release response followed the absorbance spectrum of the photosynthetic pigments, suggesting that they function as photosensors for this response. In contrast to the previously reported motility response to a decrease in infrared light, the blue-light response reported here does not depend on the number of photosynthetic pigments per cell, suggesting that it is mediated by a separate sensor. Therefore, color discrimination in taxis responses in R. sphaeroides involves two photosensing systems: the photosynthetic pigments and an additional photosensor, responding to blue light. The signal generated by the former system could result in the migration of cells to a light climate beneficial for photosynthesis, while the blue-light system could allow cells to avoid too-high intensities of (harmful) blue light.
Changes in the environmental light climate induce behavioral responses in photosynthetic purple bacteria, which allow them to migrate towards an environment beneficial for photosynthesis. Reports on photosynthetic bacteria that accumulate in infrared light are among the classics of microbiology (2, 3). In more recent years, more-complex behavioral responses of these organisms towards light have been reported. Free-swimming Ectothiorhodospira halophila cells, in addition, show a repellent response, with a maximal relative increase in the flagellar reversal frequency at 450 nm (20). A colony of Rhodospirillum centenum is repelled by intense green light (550 to 600 nm) and is attracted by red or infrared light that is absorbed by the photosynthetic pigments (15). Light-induced motility responses have also been analyzed in Rhodobacter sphaeroides WS8-N (1). This bacterium responds to a step-down in yellow-green light (530 to 600 nm), and infrared light in a background of red monitoring light (650 ± 10 nm), by an increase in its stop or reorientation frequency, with adaptation taking approximately 2 min. The photosynthetic apparatus is the photosensor for this response (6).
Stimulus-induced turnover of methylated carboxyl groups of methyl-accepting transducer proteins is a common feature of prokaryotic taxis-signaling pathways. Nevertheless, previous methanol release assays with intact R. sphaeroides cells have not revealed changes in methanol release upon the addition or removal of chemoeffectors (19). The recent finding of chemotaxis operons encoding MCP homologues, methyltransferases and -esterases, however, supports the involvement of a methylation-dependent adaptation pathway for tactic responses in this bacterium (7). This study describes a blue-light-induced taxis response in R. sphaeroides RK1 that is distinct from the response to photosynthetic light previously reported (6). Color-sensitive, light-induced changes in the release of volatile [3H]methanol from cells labeled with radioactive methionine provide evidence for the involvement of methyl-accepting transducers in signaling by both phototaxis systems.
MATERIALS AND METHODS
Strain and culture conditions.
R. sphaeroides strain RK1 (11) was cultured at 30°C under anaerobic conditions in white light (15 W · m−2), in 20-ml screw-cap tubes containing Sistrom's minimal medium A supplemented with succinate as the carbon source (18). Culturing under semianaerobic conditions in the dark was carried out in 80%-filled 300-ml Erlenmeyer flasks at a low rotation speed on an orbital shaker (25 rpm), and culturing under aerobic conditions in the dark was carried out in 4%-filled 500-ml Erlenmeyer flasks at a high rotation speed (250 rpm). Cells grown at a high light intensity were illuminated with white light at 100 W · m−2, while for low light intensities 3 W · m−2 was used.
Single-cell motion analysis.
R. sphaeroides cells were cultured under anaerobic conditions in the light and harvested for analyses at an optical density at 660 nm (OD660) of ∼0.8. The setup used in this study has been described elsewhere (8, 24). Briefly, cells were monitored under a cover glass by dark-field microscopy with a 150-W tungsten-halogen lamp (Ushio Inc.) and a 600-nm long-pass filter (light intensity, 8.3 W · m−2, as determined with a Kettering radiant power meter [Scientific Instruments]). Blue-light repellent stimuli (using pulses of 3 s) were delivered via an HBO 103W/2 mercury short-arc lamp (Osram), through 400-, 450-, or 500-nm broad-band interference filters (FWHM, ± 20 nm). The corrected light intensities (i.e., corrected for the surface of the light spot relative to the surface of the light intensity meter) were 11, 83, and 51 W · m−2 for the three wavelengths, respectively. The motion analysis software was run on a SPARC IPC workstation. The average linear speed of cells in a suspension was obtained by combining two data sets in which the paths of single motile cells were tracked for a period of 4 s. The first data set was obtained starting at 1 s before the blue-light pulse and continuing for the 3 s of the pulse, and the second data set was obtained for the last 1 s of the pulse and the first 3 s after the pulse; for both, the frame rate was 15 frames/s (i.e., 67 ms/frame). The following settings were used for the calculation of the centroids: neighbor width/height, 2/2; minimum number of pixels, 1; maximum number of pixels, 4,096. The settings for the calculation of the paths were as follows: search mask size, 15; minimum path duration, 40; average minimum movement, 1. All calculated paths were visually inspected, and paths of nonmotile cells were removed with the path editor. About 150 paths, obtained from 10 independent recordings, were merged into a single file and used for calculation of the average linear speed of the cells.
Methanol release assay.
The flow assay for measurements of photostimulus-induced changes in carboxylmethylesterase activity, based on a procedure developed for Escherichia coli chemotaxis (9) and modified for Halobacterium salinarum (14), was used with 2 ml of cell suspension (OD660, ∼0.8) for each experiment. Cells were cultured under anaerobic conditions in the light (unless specified otherwise) in Sistrom medium plus 0.1 mM methionine in order to enhance the uptake of methionine. They were washed three times in Sistrom medium without methionine and were then incubated under semianaerobic or aerobic conditions for 40 min in the presence of 200 μl of l-[methyl-3H]methionine (specific activity, 75 Ci/mmol; concentration, 1 mCi/ml; [methionine] = 1.3 μM) (DuPont). Subsequently, cells were incubated on a 0.2-μm-pore-size syringe filter (Nalgene), and label was chased from the cells with Sistrom medium containing 0.1 mM methionine during a 10-min period (flow rate, 1 ml · min−1) at 28°C. Next, 0.5-ml fractions were collected in 1.5-ml Eppendorf tubes for 10 min, and a light stimulus obtained from a tungsten or xenon lamp, in combination with heat filters and broad-band interference filters, was applied. All light intensities were adjusted to 20 W · m−2, except for light of 400 nm, which was used at 5.0 W · m−2. The amplitudes for the sustained responses (interference filters of 500 nm and longer) in Fig. 5 were calculated as the difference between the average number of counts per minute over the three fractions collected before the light pulse (n = 3) and the average over the three fractions collected 2 min after the start of the light pulse (n = 3). The amplitudes for the transient responses (400- and 450-nm interference filters) in Fig. 5 were calculated as the difference between the average number of counts per minute over the three fractions collected before the light pulse and the three fractions collected 2 min after the start of the light pulse (n = 6) and the number of counts per minute of the first fraction collected after the light pulse. The duration of the light pulses varied from 8 to 10 min. The photostimuli had a negligible effect on the temperature at the position of the immobilized cells in the filter. Eppendorf tubes containing the collected samples were transferred to vials with scintillation fluid, incubated overnight at room temperature in the dark to allow the transfer of volatile, labeled methanol, and analyzed by liquid scintillation spectrometry.
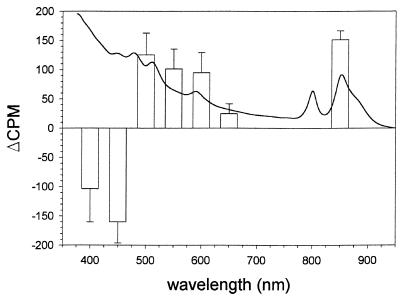
FIG. 5.
Wavelength dependence of the light-induced release of [3H]methanol in R. sphaeroides RK1 cells in response to a step-up in light stimuli. The light intensity used at 400 nm was 4 times lower than the intensity used for all the other wavelengths. For comparison, an absorption spectrum of anaerobically grown R. sphaeroides RK1 cells is shown. Error bars, calculated standard deviations. For further details, see Materials and Methods.
RESULTS
Characterization of the motility response.
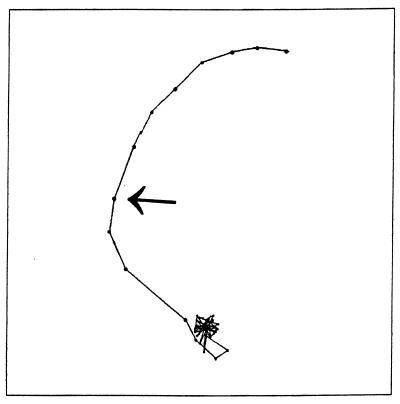
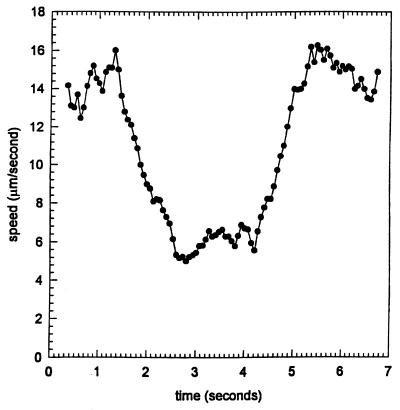
A step-up in blue light in a background of infrared light caused a motility response in swimming R. sphaeroides cells cultured under anaerobic conditions in the light (a single-cell track is shown in Fig. 1). The average linear speed of 150 cell paths was determined (Fig. 2). The cells stopped and reoriented after a delay of 0.27 s; detailed inspection of the recorded response (15 frames per s) revealed the start of the blue-light pulse at 1.07 s (frame 16) and a decrease in the average speed after 1.33 s (frame 20). During this delay the speed of individual cells increased slightly, which may be due to the increased light intensity, causing a higher proton motive force. The latter will affect the cellular swimming speed (a phenomenon called photokinesis). After 1.27 s, the cells reached their lowest average speed. This is mainly caused by the cells stopping rather than by a decrease in swimming speed. After the pulse (duration, 3 s), the cells started to swim again with a delay of 0.07 s. The cells recovered to their prestimulus swimming speed in about 1 s.
FIG. 1.
Representative single-cell track of R. sphaeroides RK1. The track starts at the upper right corner. The arrow indicates the start of the step-up in blue-light intensity. The time interval between two recorded frames (dots) is 67 ms, and infrared light was used as the monitoring light. For further details, see Materials and Methods.
FIG. 2.
Time dependence of the effect of blue light on the average speed of free-swimming R. sphaeroides RK1 cells. After a delay of 1 s, cells received a step-up in blue light for 3 s. The tracks of 150 individual cells were averaged for this figure. For further details, see Materials and Methods.
Full adaptation to the prestimulus stopping frequency was not observed, even when the duration of the continuous blue-light illumination was extended up to several minutes. Cells either stopped completely or continued swimming with an increased stop frequency during the entire blue-light exposure. Replacement of the 450-nm interference filter by a 500-nm filter abolished the stop response at the light intensity used. On the other hand, a step-up in light of 400 nm or in white light (i.e., without the use of any interference filter) did result in a stop response, which was similar to the response observed when the 450-nm filter was used (data not shown). Decreasing the 450-nm pulse duration from 3 to 1 s did not significantly affect the amplitude of the response (for the calculation of this amplitude, see Materials and Methods). However, a decrease in the length of the pulse to 100 ms resulted in a reduction of the response to approximately 20%.
Exposure of anaerobically cultured R. sphaeroides RK1 cells to oxygen also resulted in an increased stop frequency, as observed previously for R. sphaeroides WS8-N (5). No effect of blue light on the motility of cells was observed during their response to oxygen; cells need to be cultured and observed under anaerobic conditions in order for this response to be observed. Cells grown anaerobically at high (100 W · m−2) and low (3 W · m−2) light intensities did not show significant differences in the amplitude of the blue-light motility response. In addition to the response to a step-up in blue light, the R. sphaeroides RK1 cells exhibited a similar motility response (increased reorientation frequency) to a step-down in infrared light (λ > 700 nm), which was earlier described for R. sphaeroides WS8-N (6). After periods of 5 to 15 min of frequent exposure to blue-light pulses of 3 s, only part of the cell population continued to respond to such pulses. Eventually the cells completely lost this motility response, while their nonstimulated motility, and their response to a decrease in infrared light, was not affected.
Methanol release.
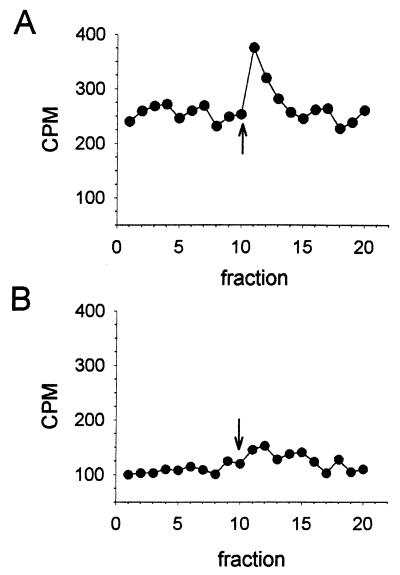
Light-induced release of volatile tritiated compounds was analyzed using a flow assay, with intact R. sphaeroides cells placed on a filter. With anaerobically grown cells, a transient increase in methanol production was observed upon a step-up in blue-light intensity (Fig. 3A); this is similar to that observed from a methylation-dependent adaptation reaction of a repellent response in E. coli. When grown under semianaerobic conditions, R. sphaeroides cells also showed an increased release of methanol (data not shown), while with aerobically grown cells, this increase was not detectable (Fig. 3B). The results in Fig. 3 match the occurrence of the reported blue-light motility response, which also was observed in cells grown anaerobically in the light and was less pronounced in cells grown under semianaerobic conditions in the dark.
FIG. 3.
Effect of growth conditions on the release of 3H-labeled methanol by R. sphaeroides RK1 cells upon a step-up in blue light: The arrow indicates the time of provision of the step-up in blue light (450 nm). Cells were grown anaerobically in the light (A) or aerobically in the dark (B). Each point indicates the amount of radioactive methanol collected during a 30-s period. For further details, see Materials and Methods.
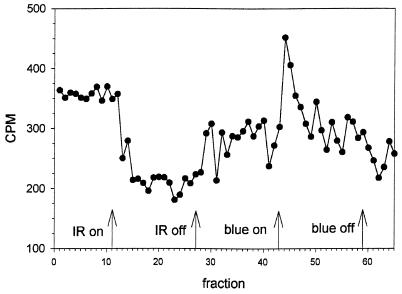
The effect of infrared light on methanol release was also investigated. R. sphaeroides cells do not display a pronounced phototactic response to an increase in infrared light, but a decrease in this light causes a transient stop, followed by adaptation (6). Interestingly, this symmetry (the removal of an attractant leads to a response very similar to that resulting from the addition of a repellent) is partially reflected in light-induced methanol release, as indicated in Fig. 4. An attractant stimulus leads to a sustained decrease in the release of methanol, while a repellent stimulus leads to a transient response (Fig. 4). After the initiation of the light stimulus, it typically takes about 4 data points, i.e., 2 min, before the rate of methanol release has reached a new level (attractant response) or has returned to the prestimulus level (repellent response).
FIG. 4.
Analysis of 3H-labeled methanol release in R. sphaeroides RK1 cells upon step-up stimuli with infrared (IR) and blue light. Infrared light was selected with a long-pass filter (50% transmission at 758 nm). For blue light, a broad-band 450-nm filter was used.
The observed opposite effects of blue and infrared photostimuli on methanol release in intact R. sphaeroides cells impelled us to investigate the wavelength dependence of this response. Accordingly, we used a set of broad-band interference filters and a 600-nm long-pass filter (see Materials and Methods). The data in Fig. 5 show that the increase in [3H]methanol release has a wavelength dependence that follows the absorbance spectrum of the photosynthetic pigments for wavelengths of 500 nm and above. Thus, the photosynthetic pigments presumably are the photoreceptors for the methanol release response to a decrease in the intensity of light sustaining photosynthesis.
DISCUSSION
The blue-light response.
When swimming R. sphaeroides cells are exposed to blue light, they stop and then partially adapt to their prestimulus motility. Does this response lead to migration away from blue light? For comparison, consider the very similar motility response to a decrease in photosynthetic light in R. sphaeroides WS8-N (which we also observe in cells of strain RK1). Under anaerobic conditions both strains respond to a step-down of photosynthetic light by a transient stop. It has been reported, however, that WS8-N cells, exposed to a white-light beam for a few minutes, accumulate outside that beam in the dark (17). For a phototrophic bacterium, this is not easily interpreted as a physiological response. Possibly, in nature R. sphaeroides does not often face such steep light intensity gradients, and the accumulation in the dark can be explained as an “overreaction” of the cells. Overly steep gradients may cause nonphysiological complete stops, leading to the unexpected accumulation pattern. However, the lack of photomotility responses in a cheAII mutant, identified via selection of cells which do not sense a light-dark boundary, does show the importance of these responses for R. sphaeroides for the avoidance of a dark environment (7).
The relatively slow adaptation of R. sphaeroides to bright photostimuli (adaptation takes approximately 2 min for the response to a step-down in photosynthetic light [6], although with subsaturating light intensities, cells can show adaptation within seconds [16]) complicates the observation of adaptation. With the procedure used here, free-swimming cells are not easily tracked for periods longer than several seconds, because gradually cells leave the light spot. When the blue light was turned off, even after minutes of exposure, cells exhibited a decrease in stop frequency, indicating that they were not fully adapted. This may be due to the large change in light intensity; more-subtle changes may result in full adaptation within shorter times.
As blue light is also used for photosynthesis, R. sphaeroides RK1 also shows an increase in stop frequency in response to a decrease in blue light (and other wavelengths of photosynthetic light), while, as reported here, it also shows an increase in stop frequency in response high blue-light intensities in a background of infrared light. These two responses may bias the swimming pattern of R. sphaeroides RK1 toward its most favorable light climate for photosynthesis, while simultaneously allowing it to avoid radiation damage. This pattern of opposite responses, as a function of either the color or the intensity of the actinic illumination, is often seen in phototrophic prokaryotes and algae (4, 8, 13, 15, 21).
The response to a decrease in infrared light is strongly dependent on the capacity of the photosynthetic light-harvesting apparatus. Cells grown at high light intensities respond to a much wider range of step-down intensities than cells grown at low light intensities, evidently because photosynthesis saturates at much lower intensities in low-light-grown cells (6). Similar saturation is not observed for the behavioral response to a step-up in blue light, which argues against a role for the photosynthetic pigments as the underlying photoreceptors in this latter response. This response is observable only at relatively high light intensities, i.e., when the length of the light pulse is longer than 100 ms and the intensity does not decrease below 30% of the default value (see Materials and Methods). The blue-light response cannot be observed in cells exposed to oxygen, which itself increases the reorientation frequency. This is in line with the idea that multiple signals feed into the taxis transduction pathway in these cells. This is further supported by the phenotype of an R. sphaeroides RK1 mutant in which the chemotaxis operon II was interrupted. This mutant has lost all light-induced behavioral responses, while its motility is unimpaired (unpublished data).
The methanol release assay.
The nature of the labeled volatile compound (i.e., methanol) has not been independently confirmed in this study, but methanol is the only compound detected so far in this type of experiment carried out with eubacteria. In a previous study, methanol release in R. sphaeroides WS8 was not observed in response to the addition or removal of a combination of the attractants serine and succinate (19). This may have been due to the lower specific activity and amount of label added in the latter study.
In E. coli the transient increase in the rate of methanol release occurs during the process of adaptation of the taxis response, as a result of increased methylesterase activity of phosphorylated CheB. A similar mechanism presumably is operative in R. sphaeroides, in which one cheB and two cheR genes have been identified recently (7). The methanol release responses in R. sphaeroides are reminiscent of those observed in E. coli. Attractant stimuli decrease methylesterase activity, which then recovers in a period of minutes to the prestimulus level. A repellent stimulus produces a transient increase in methylesterase activity. The sustained decrease, and transient increase, in methanol release shown in Fig. 4 can be rationalized by the assumption that phosphorylated CheB has a relatively short lifetime, which causes a transient response (12). Inhibition of CheA kinase activity, which increases the number of nonphosphorylated CheB molecules, has a more sustained effect.
The photosensors mediating the light responses.
The photosynthetic apparatus presumably mediates the motility and methanol release responses to a step-down in photosynthetic light. Furthermore, adaptation to a decrease in infrared light involves a methylation-dependent system. A methyl-accepting protein capable of sensing the membrane potential could form part of the machinery for this signal transfer route.
The molecular identity of the photoreceptor mediating the blue-light response in R. sphaeroides remains to be resolved. Sensory rhodopsins (8) have not been detected in purple bacteria. In E. coli, intermediates of the heme biosynthesis pathway act as sensors for a blue-light tumbling response (22, 23). However, both the wavelength dependence and the oxygen requirement of the latter response make it incompatible with the blue-light-induced behavioral response in R. sphaeroides reported here.
Recently, the pyp gene, encoding a photoactive yellow protein (PYP), has been identified in R. sphaeroides RK1 (11), while it was not detectable in the WS8-N strain (10). Although the blue-light motility response is present in the RK1 strain and not in WS8-N, pyp deletion mutants of R. sphaeroides RK1 displayed unimpaired blue-light responses. This excludes the possibility that the PYP from Rhodobacter is the photosensor for the blue-light repellent response in this organism (10).
ACKNOWLEDGMENTS
R.K. thanks Xue-Nong Zhang, Kwang-Hwan Jung, and Bastianella Perazzona for expert assistance with the motion analyses and flow assays and Elena Spudich for fruitful discussions. Judy Armitage is acknowledged for making plasmid pDS1 available for mutagenesis experiments in Rhodobacter.
We acknowledge the support of collaborative research grant 960237 from NATO to J.L.S. and SIR travel grant 14-1779 to Houston, Tex., from the Dutch Organization of Scientific Research (NWO) to R.K.
REFERENCES
- 1.Armitage J P. Behavioral responses of bacteria to light and oxygen. Arch Microbiol. 1997;168:249–261. doi: 10.1007/s002030050496. [DOI] [PubMed] [Google Scholar]
- 2.Buder J. Cloronium mirabile. Ber Dtsch Bot Ges. 1914;31:80–97. [Google Scholar]
- 3.Engelmann T W. Ein Beitrag zur vergleichenden Physiologie des Licht- und Farbensinnes. Arch Physiol. 1883;30:95–124. [Google Scholar]
- 4.Frostl J M, Overmann J. Physiology and tactic response of the phototrophic consortium “Chlorochromatium aggregatum.”. Arch Microbiol. 1998;169:129–135. doi: 10.1007/s002030050552. [DOI] [PubMed] [Google Scholar]
- 5.Gauden D E, Armitage J P. Electron transport-dependent taxis in Rhodobacter sphaeroides. J Bacteriol. 1995;177:5853–5859. doi: 10.1128/jb.177.20.5853-5859.1995. [DOI] [PMC free article] [PubMed] [Google Scholar]
- 6.Grishanin R N, Gauden D E, Armitage J P. Photoresponses in Rhodobacter sphaeroides: role of photosynthetic electron transport. J Bacteriol. 1997;179:24–30. doi: 10.1128/jb.179.1.24-30.1997. [DOI] [PMC free article] [PubMed] [Google Scholar]
- 7.Hamblin P A, Maguire B A, Grishanin R N, Armitage J P. Evidence for two chemosensory pathways in Rhodobacter sphaeroides. Mol Microbiol. 1997;26:1083–1096. doi: 10.1046/j.1365-2958.1997.6502022.x. [DOI] [PubMed] [Google Scholar]
- 8.Hoff W D, Jung K H, Spudich J L. Molecular mechanism of photosignaling by archaeal sensory rhodopsins. Annu Rev Biophys Biomol Struct. 1997;26:223–258. doi: 10.1146/annurev.biophys.26.1.223. [DOI] [PubMed] [Google Scholar]
- 9.Kehry M R, Doak T G, Dahlquist F W. Stimulus-induced changes in methylesterase activity during chemotaxis in Escherichia coli. J Biol Chem. 1984;259:11828–11835. [PubMed] [Google Scholar]
- 10.Kort R. Studies on a bacterial photosensor. Ph.D. thesis. University of Amsterdam, Amsterdam, The Netherlands. Enschede, The Netherlands: PrintPartners Ipskamp; 1999. [Google Scholar]
- 11.Kort R, Phillips-Jones M K, van Aalten D M F, Haker A, Hoffer S M, Hellingwerf K J, Crielaard W. Sequence, chromophore extraction and 3-D model of the photoactive yellow protein from Rhodobacter sphaeroides. Biochim Biophys Acta. 1998;1385:1–6. doi: 10.1016/s0167-4838(98)00050-8. [DOI] [PubMed] [Google Scholar]
- 12.Lupas A, Stock J. Phosphorylation of an N-terminal regulatory domain activates the CheB methylesterase in bacterial chemotaxis. J Biol Chem. 1989;264:17337–17342. [PubMed] [Google Scholar]
- 13.Nultsch W, Schuchart H, Koenig F. Effects of sodium azide on phototaxis of the blue-green alga Anabaena variabilis and consequences to the two-photoreceptor systems hypothesis. Arch Microbiol. 1983;134:33–37. doi: 10.1007/BF00429403. [DOI] [PubMed] [Google Scholar]
- 14.Perazzona B, Spudich J L. Identification of methylation sites and effects of phototaxis stimuli on transducer methylation in Halobacterium salinarum. J Bacteriol. 1999;181:5676–5683. doi: 10.1128/jb.181.18.5676-5683.1999. [DOI] [PMC free article] [PubMed] [Google Scholar]
- 15.Ragatz L, Jiang Z Y, Bauer C E, Gest H. Macroscopic phototactic behavior of the purple photosynthetic bacterium Rhodospirillum centenum. Arch Microbiol. 1995;163:1–6. doi: 10.1007/BF00262196. [DOI] [PubMed] [Google Scholar]
- 16.Romagnoli S, Armitage J P. Roles of chemosensory pathways in transient changes in swimming speed of Rhodobacter sphaeroides induced by changes in photosynthetic electron transport. J Bacteriol. 1999;181:34–39. doi: 10.1128/jb.181.1.34-39.1999. [DOI] [PMC free article] [PubMed] [Google Scholar]
- 17.Sackett M J, Armitage J P, Sherwood E E, Pitta T P. Photoresponses of the purple nonsulfur bacteria Rhodospirillum centenum and Rhodobacter sphaeroides. J Bacteriol. 1997;179:6764–6768. doi: 10.1128/jb.179.21.6764-6768.1997. [DOI] [PMC free article] [PubMed] [Google Scholar]
- 18.Sistrom W R. The kinetics of the synthesis of photopigments in Rhodopseudomonas sphaeroides. J Gen Microbiol. 1962;28:607–616. doi: 10.1099/00221287-28-4-607. [DOI] [PubMed] [Google Scholar]
- 19.Sockett R E, Armitage J P, Evans M C. Methylation-independent and methylation-dependent chemotaxis in Rhodobacter sphaeroides and Rhodospirillum rubrum. J Bacteriol. 1987;169:5808–5814. doi: 10.1128/jb.169.12.5808-5814.1987. [DOI] [PMC free article] [PubMed] [Google Scholar]
- 20.Sprenger W W, Hoff W D, Armitage J P, Hellingwerf K J. The eubacterium Ectothiorhodospira halophila is negatively phototactic, with a wavelength dependence that fits the absorption spectrum of the photoactive yellow protein. J Bacteriol. 1993;175:3096–3104. doi: 10.1128/jb.175.10.3096-3104.1993. [DOI] [PMC free article] [PubMed] [Google Scholar]
- 21.Takahashi T, Watanabe M. Photosynthesis modulates the sign of phototaxis of wild-type Chlamydomonas reinhardtii. Effects of red background illumination and 3-(3′,4′-dichlorophenyl)-1,1-dimethylurea. FEBS Lett. 1993;336:516–520. doi: 10.1016/0014-5793(93)80867-t. [DOI] [PubMed] [Google Scholar]
- 22.Yang H, Inokuchi H, Adler J. Phototaxis away from blue light by an Escherichia coli mutant accumulating protoporphyrin IX. Proc Natl Acad Sci USA. 1995;92:7332–7336. doi: 10.1073/pnas.92.16.7332. [DOI] [PMC free article] [PubMed] [Google Scholar]
- 23.Yang H, Sasarman A, Inokuchi H, Adler J. Non-iron porphyrins cause tumbling to blue light by an Escherichia coli mutant defective in hemG. Proc Natl Acad Sci USA. 1996;93:2459–2463. doi: 10.1073/pnas.93.6.2459. [DOI] [PMC free article] [PubMed] [Google Scholar]
- 24.Zacks D N, Derguini F, Nakanishi K, Spudich J L. Comparative study of phototactic and photophobic receptor chromophore properties in Chlamydomonas reinhardtii. Biophys J. 1993;65:508–518. doi: 10.1016/S0006-3495(93)81067-1. [DOI] [PMC free article] [PubMed] [Google Scholar]


