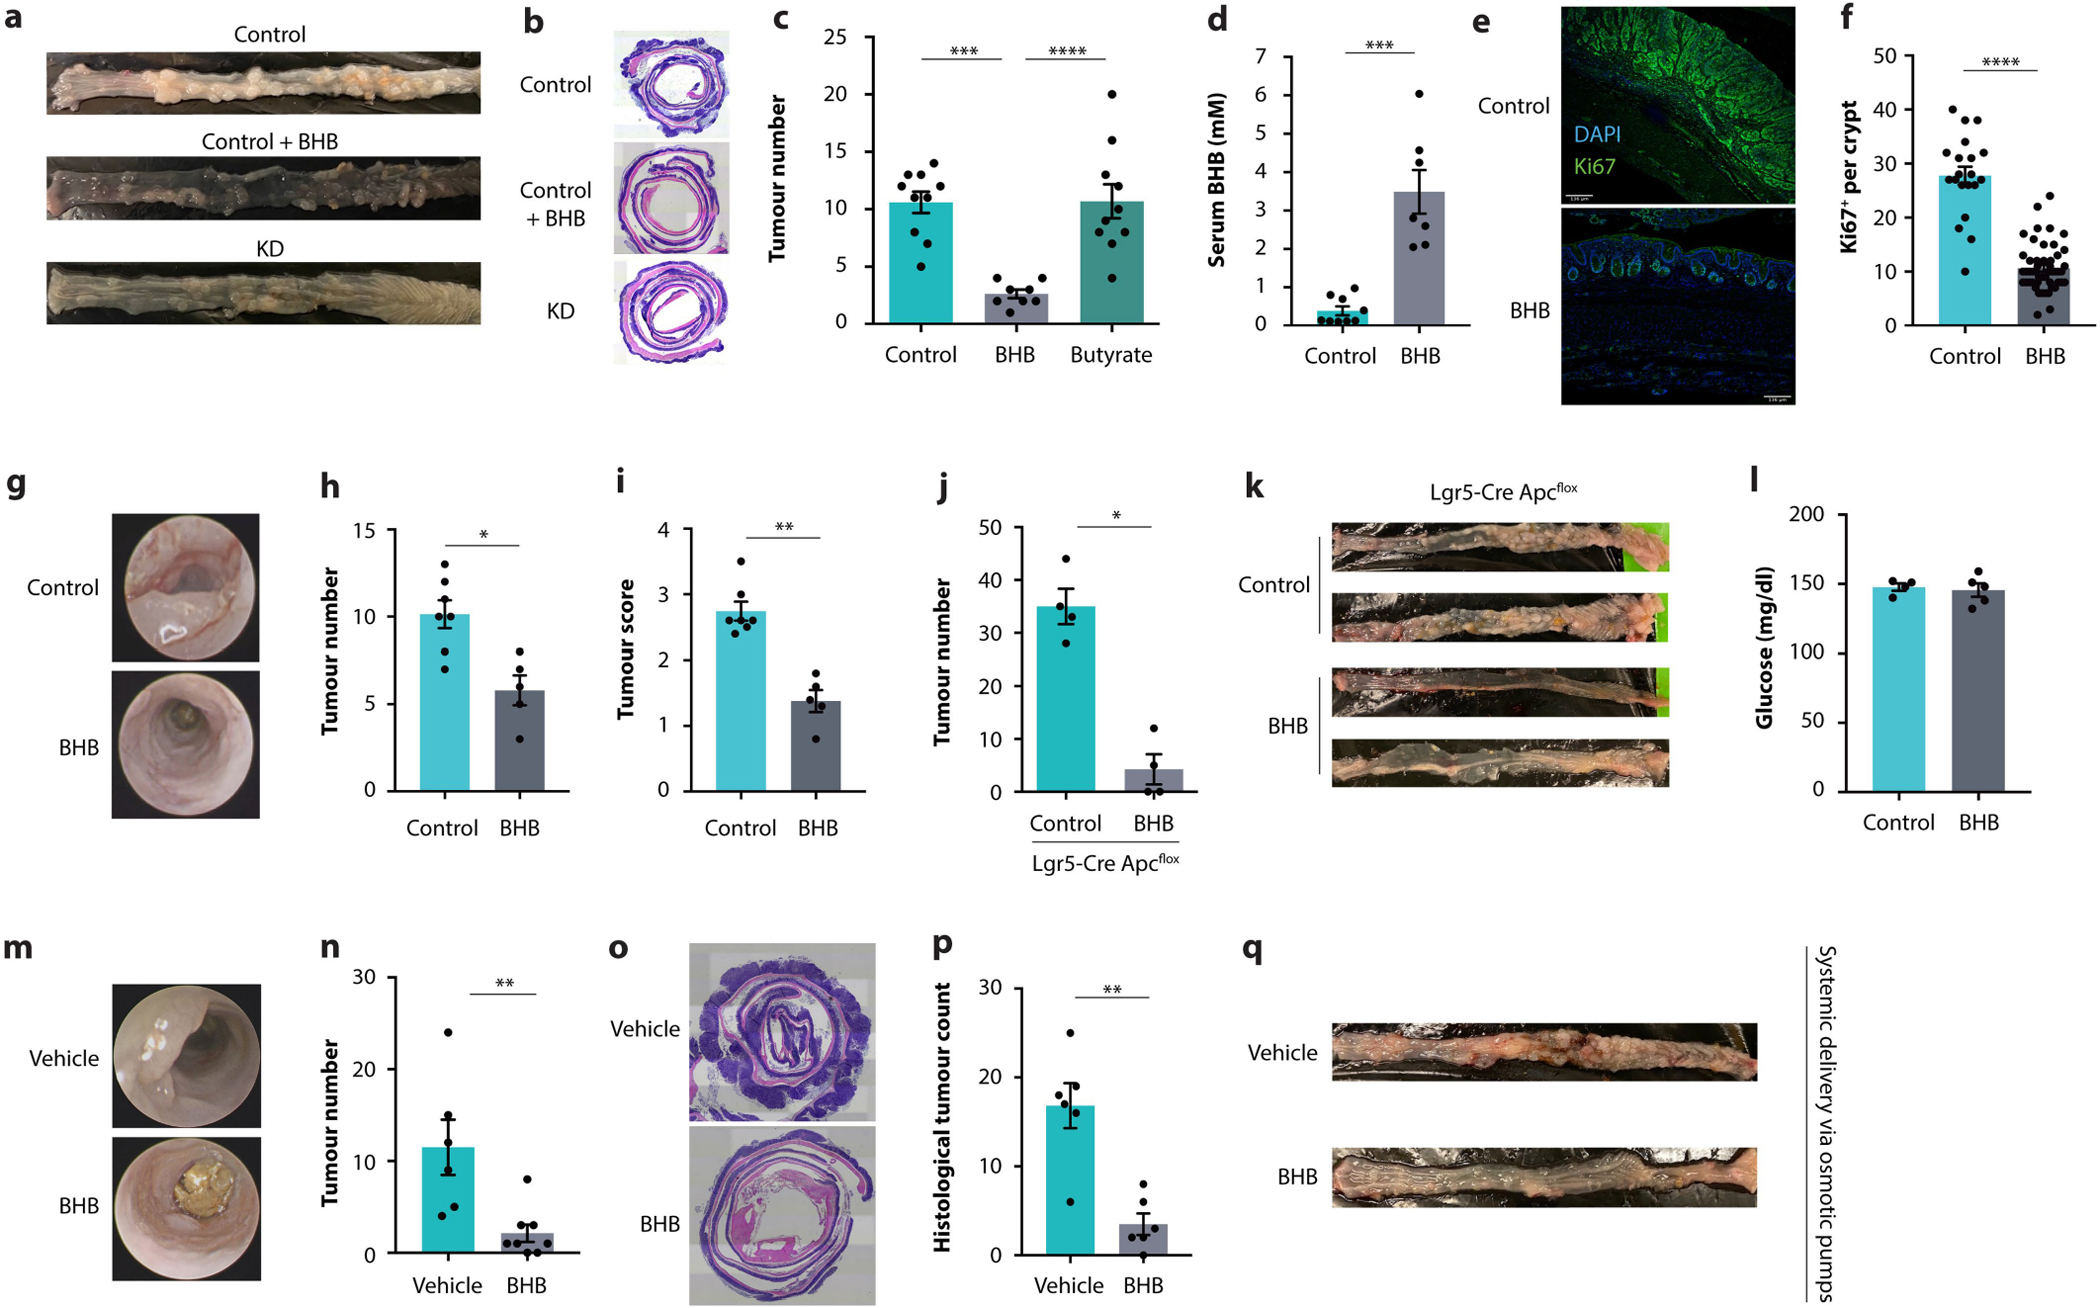
Extended Data Fig. 4 |. Inhibition of intestinal tumour growth by beta-hydroxybutyrate.

a, b, Representative macroscopic images (a) and representative histology images (b) of CDX2CreERT-Apcfl/fl mice fed either KD or control diet, with or without daily oral supplementation with BHB esters as indicated. c, Colonoscopy-based tumour quantification in AOM/DSS-treated mice receiving oral supplementation with either BHB or butyrate. d, BHB concentrations in the blood of AOM/DSS-treated mice on standard rodent diet receiving daily oral supplementation with BHB esters. e, f, Representative images (e) and quantification (f) of Ki67-stained tumours in AOM/DSS-treated mice supplemented with BHB. g–i, Representative colonoscopy images (g), colonoscopy-based tumour quantification (h), and tumour score by colonoscopy (i) in AOM/DSS-treated mice receiving daily oral supplementation with BHB esters. j, k, Macroscopic tumour counts (j) and representative macroscopic images (k) of Lgr5CreERT-Apcfl/fl mice receiving daily oral supplementation with BHB esters. l, Glucose concentrations in the blood of AOM/DSS-treated mice on standard chow receiving daily oral supplementation with BHB esters. m–q, Representative colonoscopy images (m), colonoscopy-based tumour quantification (n), representative histology images (o), histological tumour counts (p), and representative macroscopic images (q) of CDX2CreERT-Apcfl/fl mice supplemented with BHB salts by osmotic mini-pumps. Error bars indicate means ± SEM. Scale bars represent 135 μm. * p < 0.05, ** p < 0.01, *** p < 0.001, **** p < 0.0001. Exact n and p-values are presented in Supplementary Table 3.
