

Abstract
Esophageal squamous cell carcinoma (ESCC) accounts for the main esophageal cancer type, which is related to advanced stage and poor survivals. Therefore, novel diagnostic biomarkers are critically needed. In the current research, we aimed to screen novel diagnostic biomarkers based on machine learning. The expression profiles were obtained from GEO datasets (GSE20347, GSE38129, and GSE75241) and TCGA datasets. Differentially expressed genes (DEGs) were screened between 47 ESCC and 47 nontumor samples. The LASSO regression model and SVM-RFE analysis were carried out for the identification of potential markers. ROC analysis was carried out to assess discriminatory abilities. The expressions and diagnostic values of the candidates in ESCC were demonstrated in the GSE75241 datasets and TCGA datasets. We also explore the correlations between the critical genes and cancer immune infiltrates using CIBERSORT. In this study, we identified 27 DEGs in ESCC: 5 genes were significantly elevated, and 22 genes were significantly decreased. Based on the results of the SVM-RFE and LASSO regression model, we identified five potential diagnostic biomarkers for ESCC, including GPX3, COL11A1, EREG, MMP1, and MMP12. However, the diagnostic values of only GPX3, MMP1, and MMP12 were confirmed in GSE75241 datasets. Moreover, in TCGA datasets, we further confirmed that GPX3 expression was distinctly decreased in ESCC specimens, while the expression of MMP1 and MMP12 was noticeably increased in ESCC specimens. Immune cell infiltration analysis revealed that the expression of GPX3, MMP1, and MMP12 was associated with several immune, such as T cells CD8, macrophages M2, macrophages M0, and dendritic cells activated. Overall, our findings suggested GPX3, MMP1, and MMP12 as novel diagnostic marker and correlated with immune infiltrates in ESCC patients.
1. Introduction
Esophageal cancer (EC) is one of the most common malignancies worldwide, which is always accompanied by high morbidity and mortality [1]. Esophageal cell squamous carcinoma (ESCC) accounts for over 80% of all cases of EC in China [2]. Surgery, radiation therapy, and chemotherapy are the only treatment options that are currently available; despite the significant progress that has been made in the treatment of this illness, the patient survival rate within five years is still extremely low [3, 4]. This is due to the fact that the only treatment options that are currently available are those three. Metastatic ESCC patients have a five-year survival rate of fewer than 5% [5]. ESCC often spreads to the liver, lung, bone, and brain [6]. For the detection of ESCC, they are ineffective because they lack appropriate sensitivity and specificity [7]. Therefore, novel and reliable molecular biomarkers to complement and improve on current ESCC screening strategies are urgently needed.
The investigation of gene expression profiles using microarrays has become a frequent method for locating important hub genes and important pathways [8]. In this day and age of integrated bioinformatics, it is not a problem to get data; rather, the task of normalization appears to be a challenging one. It is possible to perform prognosis studies on cancer patients using microarray techniques in addition to identifying genes associated with various diseases and potential antitumor medication targets [9, 10]. In addition, microarray techniques have an important ability in analyzing the associations between the expression of functional genes and their modulation [11, 12]. In the field of clinical research, they are also responsible for contributing ideas for the diagnosis and treatment of specific disorders. We found that there have been studies exploring the diagnostic genes of many types of tumors, but the application of machine-learning for the identification of novel diagnostic biomarkers for ESCC was rarely reported. In the current study, we performed a joint analysis in multidatabases to explore diagnostic marker genes for ESCC patients.
2. Materials and Methods
2.1. Microarray Data
The microarray dataset GSE20347, GSE38129, and GSE75241 was downloaded from the Gene Expression Omnibus (GEO) database. The GSE20347 dataset included 17 pairs of ESCC and nontumor specimens, whereas the GSE38129 dataset included 30 pairs of ESCC and nontumor specimens. Due to the fact that the GSE38129 datasets share a platform and are important for merging data from a variety of datasets, they have been combined into a metadata cohort for the purpose of doing additional integration analysis. In addition, the combat function contained inside the “SVA” software package in R was utilized in order to eliminate the batch effect. In addition, the validation cohort comprised 15 pairs of ESCC tissues and neighboring normal tissues, which were taken from the GSE75241 datasets.
2.2. Identification of Differentially Expressed Genes (DEGs)
The DEG analysis was carried out with the help of the Limma program [13]. In order to evaluate the changes in gene expression, an empirical Bayesian methodology was adopted, and moderated t-tests were utilized. The DEGs are genes that had an adjusted p value that was lower than 0.05 and had an absolute fold change that was higher than 3.
2.3. GO Term and KEGG Pathway Enrichment Analysis
The biological importance of DEGs was investigated using GO term enrichment analysis, which included biological processes, cellular components, and molecular functions. This research was conducted using the “GOstats” program included in Bioconductor. The KEGG pathway enrichment analysis of DEGs was carried out by the “GeneAnswers” Bioconductor program in order to identify important pathways that are closely associated with the beginning and development of ESCC. In order to reach statistical significance and achieve significant enrichment, a p value of less than 0.05 was required.
2.4. Novel Diagnostic Biomarkers Screening
When doing five-fold cross-validation, a technique known as least absolute shrinkage and selector operation (LASSO) and support vector machine-recursive feature elimination (SVM-RFE) were employed, respectively, to filter the critical genes [14, 15]. Then, in order to filter the essential diagnostic genes, we pooled the results that the LASSO and SVM-RFE algorithms had produced. The genes that were shared by the two methods were incorporated, and the expressions of novel genes were checked for accuracy using the GSE75241 datasets.
2.5. Diagnostic Value of Critical Genes in ESCC
In order to determine whether or not the found biomarkers had any predictive power, we constructed a ROC curve by comparing the levels of mRNA expression in 47 ESCC tumor specimens to 47 nontumor tissues. The value of AUC was used to measure the diagnostic efficiency in distinguishing ESCC specimens from nontumor specimens, and this finding was then verified using the GSE75241 dataset.
2.6. Estimation of Immune Cell Abundance
Based on the reference signature matrix of 547 genes, we employed CIBERSORT to analyze the percentages of various immune cells in tumor and nontumor specimens. When we ran the program with the default LM22 feature matrix at 1000 permutations, we submitted the data of gene expressions generated from the sample mixture file to the CIBERSORT web page (https://cibersort.stanford.edu/). A mixture sample's relative immune cell fraction was estimated using CIBERSORT and can be applied to compare immune cell populations within and across studies.
2.7. Statistical Analysis
All statistical analyses were conducted using R (version 3.6.3, R Core Team, Massachusetts, USA). p < 0.05 was considered statistically significant.
3. Results
3.1. Identification of DEGs in ESCC
Extensive retrospective analysis was performed on the GSE20347 and GSE38129 GEO datasets, which contained data on 47 ESCC and 47 nontumor samples. We used the Limma package to remove batch effects before analyzing the metadata DEGs. There were a total of 27 DEGs collected: 5 genes were significantly elevated, and 22 genes were significantly decreased (Figure 1(a)).
Figure 1.

Identification of DEGs in ESCC and their enrichment analysis. (a) A total of 139 DEGs were obtained between ESCC specimens and nontumor specimens, which were shown in the heat map. (b) Representative results of GO analyses in TCGA.
3.2. GO and KEGG Pathway Enrichment Analyses of DEGs
Later, we carried out GO assays using the “clusterProfiler” R package and observed that, in the BP group, the DEGs were mainly involved in extracellular structure organization, skin development, extracellular matrix organization, epidermal cell differentiation, and keratinocyte differentiation. In the MF group, the DEGs were mainly involved in serine hydrolase activity, serine-type peptidase activity, metallopeptidase activity, receptor ligand activity, and extracellular matrix binding (Figure 1(b)). However, the results of KEGG did not show any significant terms.
3.3. Identification and Validation of Diagnostic Feature Biomarkers
Researchers made use of two distinct algorithms in their search for possible biomarkers. Regression analysis carried out with the LASSO algorithm helped reduce the number of DEGs, which led to the identification of eight biomarkers for ESCC (Figure 2(a)). The SVM-RFE algorithm was used to narrow down the features of the DEGs to a selection of five characteristics (Figure 2(b)). In the end, the four traits that were found to overlap between these two methods, known as GPX3, COL11A1, EREG, MMP1, and MMP12, were chosen (Figure 2(c)). GSE75241 dataset was utilized to check the expressions of five characteristics to obtain more accurate and reliable results. ESCC tissue had significantly higher levels of GPX3, MMP1, and MMP12 expression than normal tissues (Figure 3(a)). However, regarding the levels of expression of COL11A1 and EREG, there was not a discernible difference between the two groups (Figure 3(b)).
Figure 2.

Identification of novel diagnostic biomarkers for ESCC diagnosis. (a) Tuning feature selection in the LASSO. (b) A plot of markers selection via the SVM-RFE algorithm. (c) Venn diagram demonstrating five diagnostic markers shared by the LASSO and SVM-RFE algorithms.
Figure 3.

The expression of GPX3, COL11A1, EREG, MMP1, and MMP12 in ESCC specimens and nontumor from GSE75241 datasets.
3.4. Diagnostic Effectiveness of Novel Biomarkers in ESCC
The diagnostic abilities of GPX3, MMP1, and MMP12 in discriminating ESCC from nontumor specimens confirmed excellent diagnostic values, with an AUC of 0.939 (95% CI 0.879–0.986) in MMP12, AUC of 0.959 (95% CI 0.916–0.990) in MMP1, AUC of 0.985 (95% CI 0.963–0.100) in GPX3, AUC of 0.962 (95% CI 0.922–0.990), and AUC of 0.924 (95% CI 0.853–0.979) (Figure 4). Moreover, a powerful discrimination ability was demonstrated in the GSE75241 dataset with an AUC of 0.920 (95% CI 0.791–0.100) in GPX3, AUC of 1.000 (95% CI 1.000–1.000) in MMP12, and AUC of 1.000 (95% CI 1.000–1.000) in MMP1 (Figure 5(a)). However, the AUC for COL11A1 and EREG was 0.556 and 0.707 (Figure 5(b)).
Figure 4.

ROC curve of the five diagnostic markers using GSE20347 and GSE38129 datasets.
Figure 5.

ROC curve of the five diagnostic markers using GSE75241 datasets.
3.5. Pan‐Cancer Expression Landscape of GPX3, MMP1, and MMP12 Based on TCGA Datasets
We conducted pan-cancer assays based on TCGA datasets to investigate the putative roles of GPX3, MMP1, and MMP12 in malignancies. According to our findings, the GPX3 expression is markedly decreased in most cancers (Figure 6(a)), while MMP1 and MMP12 expression was distinctly upregulated in most types of tumors (Figures 6(b) and 6(c)). According to our findings in Figure 7(a), we found that MMP1 and MMP12 expression was markedly elevated in ESCC samples compared to nontumor samples, while the GPX3 expression was decreased (Figures 7(b) and 7(c)). However, the results of paired t-test did not show a distinct difference of GPX3 expressions between ESCC samples and nontumor samples (Figure 7(d)), while the MMP1 and MMP12 expression was also further confirmed by the use of paired t-test (Figures 7(e) and 7(f)).
Figure 6.

The pan-cancer analysis using TCGA datasets.
Figure 7.

The expression of GPX3, MMP1, and MMP12 between ESCC specimens and nontumor specimens from TCGA datasets using (a–c) unpaired t-test and (d, e) paired t-test. ∗∗∗p < 0.001, ∗∗p < 0.01, and ∗p < 0.05.
3.6. Correlation of GPX3, MMP1, and MMP12 Expression with Tumor-Infiltrating Immune Cells (TICs)
The CIBERSORT tool in R programming language was used to conduct additional studies to verify the association between GPX3, MMP1, and MMP12 expression and the TME. Figure S1(a) shows the establishment of 22 types of immune cell profile in ESCC samples and nontumor samples, and the relationship between these TICs was exhibited by the use of heatmap (Figure S1(b)). Subsequently, we compared the proportions of TICs in the ESCC samples with those in the nontumor samples, and we found that differences in B cells naïve, plasma cells, T cells CD8, T cells CD4 naïve, T cells CD4 memory resting, T cells CD4 memory activated, T cells follicular helper, T cells regulatory (Tregs), monocytes, macrophages M0, macrophages M1, macrophages M2, dendritic cells activated, mast cells resting, and neutrophils were statistically significant (Figure S1(c)). Moreover, we observed that the GPX3 expression was associated with the expression of T cells CD8, mast cells resting, T cells regulatory (Tregs), macrophages M2, T cells CD4 memory resting, monocytes, dendritic cells resting, T cells gamma delta, neutrophils, T cells CD4 memory activated, B cells naïve, plasma cells, T cells CD4 naïve, macrophages M1, T cells follicular helper, dendritic cells activated, and macrophages M0 (Figure 8(a)). MMP1 expression was associated with the expression of macrophages M0, dendritic cells activated, macrophages M1, T cells CD4 memory activated, neutrophils, plasma cells, T cells CD4 naïve, mast cells resting, T cells CD4 memory resting, monocytes, T cells regulatory (Tregs), and T cells CD8 (Figure 8(b)). MMP12 expressions were related to the expressions of macrophages M0, dendritic cells activated, macrophages M1, T cells CD4 memory activated, neutrophils, T cells CD4 naïve, plasma cells, T cells follicular helper, T cells CD4 memory resting, T cells regulatory (Tregs), monocytes, mast cells resting, and T cells CD8 (Figure 8(c)).
Figure 8.
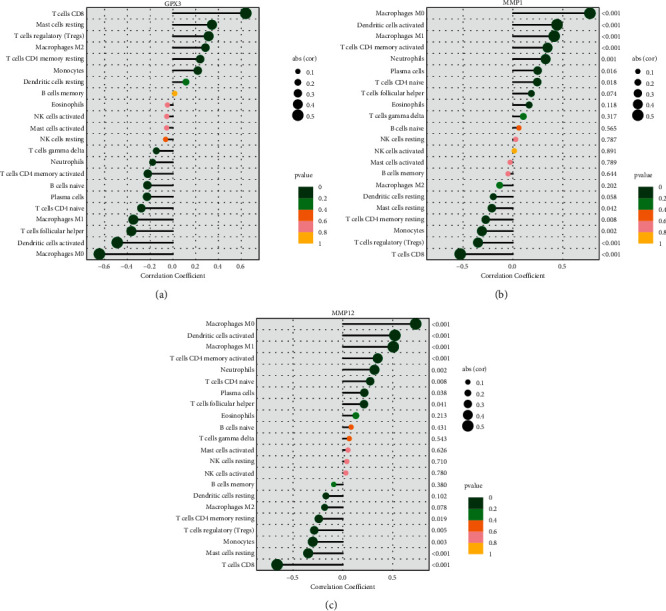
Relationships between (a) GPX3, (b) MMP1, (c) MMP12, and infiltrating immune cells in ESCC.
4. Discussion
The most common kind of esophageal cancer found all over the world is ESCC [16]. ESCC ranks as the fourth greatest cause of death from cancer-associated causes in China [17]. Even with the recent advances that have been made in diagnosis and therapy, the outlook for ESCC remains dismal [18, 19]. Patients diagnosed with ESCC have a survival rate of fewer than 30 percent after 5 years. Despite the fact that various biomarkers for ESCC have been discovered, the therapeutic relevance of the majority of them has not been validated [20, 21]. Therefore, there is an immediate need for research into more effective biomarkers for the diagnosis of ESCC.
To the best of our knowledge, this is the first retrospective study that has used GEO databases to look for diagnostic indicators that are associated with immune cell infiltration in patients with ESCC. Two cohorts were drawn from the GEO datasets, and the data were subjected to an integrated analysis. There were 27 DEGs in total: five genes showed distinct increases, whereas 22 genes showed distinct decreases. The results of enrichment analyses revealed that the dysregulated genes were primarily involved in matrix organization, skin development, extracellular, extracellular structure organization, epidermal cell differentiation, and keratinocyte differentiation. In the MF group, the abnormal expressed genes were primarily involved in serine hydrolase activity, serine-type peptidase activity, metallopeptidase activity, receptor ligand activity, and extracellular matrix binding. A total of five diagnostic indicators have been discovered using two machine-learning algorithms, including the following: GPX3, COL11A1, EREG, MMP1, and MMP12. In addition, we used GSE75241 datasets to further demonstrate our findings, and the diagnostic value of GPX3, MMP1, and MMP12 was further confirmed.
The human matrix metalloproteinases (MMPs) family belongs to the metzincin superfamily [22]. Extracellular matrix degradation is aided by MMPs, which catalyze proteolytic processes [23]. Several types of cancers are affected by MMPs in different ways [24, 25]. As of this writing, a total of 24 MMPs have been discovered (MMP1, 2, 3, 4, 5, 7, 8, 9, 10, 11, 12, 13, 14, 15, 16, 17, 18, 19, 20, 21, 23, 23a/23b, 24, 25, 26, 27, and 28). Liu et al. reported that lymph node metastases, microvessel density, and an advanced TNM stage were all linked to ESCC patients with elevated MMP1 expression. Multivariate and Kaplan–Meier analyses found that MMP1 was a significant independent predictor of overall survival of ESCC patients. In vitro experiments showed that MMP1 overexpression improved cell viability, colony formation, and cell movement capacities. The opposite effect was observed when MMP1 was knocked down in ESCC cells. The PI3K/AKT pathway was activated when MMP1 was expressed ectopically in tumor cells, resulting in tumor development and metastasis [26]. In addition, the prognostic values of MMP12 have been reported in several previous studies [27–29]. In this study, according to the results of GSE20347, GSE38129, GSE75241, and TCGA datasets, we further confirmed that MMP1 and MMP12 expressions were distinctly increased in ESCC specimens compared with nontumor samples. ROC assays also confirmed their diagnostic value in screening ESCC samples from normal samples. Overall, the results from machine-learning, together with previous findings, suggested MMP1 and MMP12 as critical diagnostic and prognostic factors for ESCC. However, research on the role of MMP1 and MMP12 in ESCC progression needed to be conducted in both vitro and animal models.
Glutathione peroxidase (GPX) is an important peroxide that has been demonstrated to be widely involved in nontoxic compounds, the reduction of toxic peroxides into hydroxyl compounds, and the decomposing of enzymes [30, 31]. Growing studies have confirmed that GPX reduces the occurrence and development of tumors [32, 33]. It has been found that the methylation of GPX3, a member of the GPX family of tumor-suppressor genes, increases the risk of breast, live, and cervical cancer substantially [34–36]. In ESCC, GPX3 has been reported to be lowly expressed in ESCC and its overexpression promoted the migration and invasion of ESCC cells via regulating FAK/AKT pathway [37]. Our findings were consistent with previous findings.
The role of the tumor microenvironment (TME) in the development of the tumor was proven by an increasing amount of evidence [38]. The malignant characteristics of cancer, such as immortal proliferation, resistance to apoptosis, and evasion of immune surveillance, are thought to be at least partially caused by cooperative interactions between cancer cells and the cells that sustain them [39, 40]. As a result, the TME exerts a considerable amount of impact over the therapeutic response and clinical outcome in cancer patients. Thus, we evaluated the correlation between GPX3, MMP1, and MMP12 expressions and immune cell infiltration in ESCC. Interesting, we found that the expression of GPX3, MMP1, and MMP12 was distinctly associated with the expressions of many immune cells. Therefore, the positive correlation between the amounts of several immune cells and the expressions of GPX3, MMP1, and MMP12 in ESCC patients suggested that GPX3, MMP1, and MMP12 were responsible for the maintenance of an immune-active condition in TME.
However, our present study has some limitations. Firstly, considering the limited size of the sample, it will be necessary to do extensive clinical tests. Secondly, we fail to evaluate the expression profile of GPX3, MMP1, and MMP12 in the serum/plasma samples in patients with ESCC. Analyzing the biomarkers present in the serum and plasma samples could be an effective way to evaluate the response to treatment in real time. Additionally, the function of GPX3, MMP1, and MMP12 remained largely unclear, and their function and mechanism were worth further exploration by molecular function experiment. We plan to better incorporate more data sets to demonstrate our findings in the next paper. In order to make these more accurate, we intend to obtain tumor specimens in addition to clinical data and demonstrate the accuracy of the results via tests.
5. Conclusion
We identified GPX3, MMP1, and MMP12 as novel diagnostic genes for ESCC. Our research also provided methods to evaluate those that had a higher potential to benefit from immunotherapy and identified a number of candidate therapeutic targets that could provide a more efficient form of treatments.
Acknowledgments
This work was supported by the Youth Program of the National Natural Science Foundation of China (Grant no. 82002422).
Contributor Information
Qiang Lu, Email: luqiang@fmmu.edu.cn.
Tao Jiang, Email: jiangtaochest@163.com.
Tao Wang, Email: tddocwangt@163.com.
Data Availability
The data used to support the findings of this study are included within the article. Additional data can be made available from the corresponding author upon request.
Disclosure
Jipeng Zhang, Nian Zhang, and Xin Yang should be considered as equal co-first authors
Conflicts of Interest
The authors declare that they have no conflicts of interest.
Authors' Contributions
Jipeng Zhang, Nian Zhang, and Xin Yang contributed equally to this work.
Supplementary Materials
Figure S1. (a, b) The proportion of the 22 immune cells detected by the CIBERSORT algorithm. (c) The differences in the structure of TIICs between normal tissue and ESCC tissues.
References
- 1.Sung H., Ferlay J., Siegel R. L. Global cancer statistics 2020: GLOBOCAN estimates of incidence and mortality worldwide for 36 cancers in 185 countries. CA: A Cancer Journal for Clinicians . 2021;71:209–249. doi: 10.3322/caac.21660. [DOI] [PubMed] [Google Scholar]
- 2.Liu X., Zhang M., Ying S. Genetic alterations in esophageal tissues from squamous dysplasia to carcinoma. Gastroenterology . 2017;153:166–177. doi: 10.1053/j.gastro.2017.03.033. [DOI] [PubMed] [Google Scholar]
- 3.Hirano H., Kato K. Systemic treatment of advanced esophageal squamous cell carcinoma: chemotherapy, molecular-targeting therapy and immunotherapy. Japanese Journal of Clinical Oncology . 2019;49(5):412–420. doi: 10.1093/jjco/hyz034. [DOI] [PubMed] [Google Scholar]
- 4.He S., Xu J., Liu X., Zhen Y. Advances and challenges in the treatment of esophageal cancer. Acta Pharmaceutica Sinica B . 2021;11:3379–3392. doi: 10.1016/j.apsb.2021.03.008. [DOI] [PMC free article] [PubMed] [Google Scholar]
- 5.Lin H. N., Chen L. Q., Shang Q. X., Yuan Y., Yang Y. S. A meta-analysis on surgery with or without postoperative radiotherapy to treat squamous cell esophageal carcinoma. International Journal of Surgery . 2020;80:184–191. doi: 10.1016/j.ijsu.2020.06.046. [DOI] [PubMed] [Google Scholar]
- 6.Wang S. X., Marshall M. B. Chemoradiation therapy as definitive treatment of esophageal cancer. Surgical Clinics of North America . 2021;101(3):443–451. doi: 10.1016/j.suc.2021.03.006. [DOI] [PubMed] [Google Scholar]
- 7.Codipilly D. C., Qin Y., Dawsey S. M., et al. Screening for esophageal squamous cell carcinoma: recent advances. Gastrointestinal Endoscopy . 2018;88(3):413–426. doi: 10.1016/j.gie.2018.04.2352. [DOI] [PMC free article] [PubMed] [Google Scholar]
- 8.Tao Z., Shi A., Li R., Wang Y., Wang X., Zhao J. Microarray bioinformatics in cancer- a review. Journal of B.U.ON, Official journal of the Balkan Union of Oncology . 2017;22(4):838–843. [PubMed] [Google Scholar]
- 9.Bednár M. DNA microarray technology and application. Medical Science Monitor: International Medical Journal of Experimental and Clinical Research . 2000;6(4):796–800. [PubMed] [Google Scholar]
- 10.Pirrung M. C., Southern E. M. The genesis of microarrays. Biochemistry and Molecular Biology Education . 2014;42(2):106–113. doi: 10.1002/bmb.20756. [DOI] [PubMed] [Google Scholar]
- 11.Cho C. H., Cho M., Park J. K. Biomarker barcodes: multiplexed microfluidic immunohistochemistry enables high-throughput analysis of tissue microarray. Lab on a Chip . 2021;21(18):3471–3482. doi: 10.1039/d1lc00375e. [DOI] [PubMed] [Google Scholar]
- 12.Sadhu A., Bhattacharyya B. Common subcluster mining in microarray data for molecular biomarker discovery. Interdisciplinary Sciences: Computational Life Sciences . 2019;11(3):348–359. doi: 10.1007/s12539-017-0262-3. [DOI] [PubMed] [Google Scholar]
- 13.Ritchie M. E., Phipson B., Wu D., et al. Limma powers differential expression analyses for RNA-sequencing and microarray studies. Nucleic Acids Research . 2015;43(7):p. e47. doi: 10.1093/nar/gkv007. [DOI] [PMC free article] [PubMed] [Google Scholar]
- 14.Cai W., van der Laan M. Nonparametric bootstrap inference for the targeted highly adaptive least absolute shrinkage and selection operator (LASSO) estimator. International Journal of Biostatistics . 2020;16(2) doi: 10.1515/ijb-2017-0070. [DOI] [PubMed] [Google Scholar]
- 15.Sanz H., Valim C., Vegas E., Oller J. M., Reverter F. SVM-RFE: selection and visualization of the most relevant features through non-linear kernels. BMC Bioinformatics . 2018;19(1):p. 432. doi: 10.1186/s12859-018-2451-4. [DOI] [PMC free article] [PubMed] [Google Scholar]
- 16.Huang F. L., Yu S. J. Esophageal cancer: risk factors, genetic association, and treatment. Asian Journal of Surgery . 2018;41(3):210–215. doi: 10.1016/j.asjsur.2016.10.005. [DOI] [PubMed] [Google Scholar]
- 17.Lin Y., Totsuka Y., He Y., et al. Epidemiology of esophageal cancer in Japan and China. Journal of Epidemiology . 2013;23(4):233–242. doi: 10.2188/jea.je20120162. [DOI] [PMC free article] [PubMed] [Google Scholar]
- 18.Yang J., Liu X., Cao S., Dong X., Rao S., Cai K. Understanding esophageal cancer: the challenges and opportunities for the next decade. Frontiers in Oncology . 2020;10 doi: 10.3389/fonc.2020.01727.1727 [DOI] [PMC free article] [PubMed] [Google Scholar]
- 19.Chu L. Y., Peng Y. H., Weng X. F., Xie J. J., Xu Y. W. Blood-based biomarkers for early detection of esophageal squamous cell carcinoma. World Journal of Gastroenterology . 2020;26(15):1708–1725. doi: 10.3748/wjg.v26.i15.1708. [DOI] [PMC free article] [PubMed] [Google Scholar]
- 20.Zhao Y., Xu J., Chen Q. Analysis of curative effect and prognostic factors of radiotherapy for esophageal cancer based on the CNN. Journal of healthcare engineering . 2021;2021:1–8. doi: 10.1155/2021/9350677. [DOI] [PMC free article] [PubMed] [Google Scholar] [Retracted]
- 21.Zhou N., Hofstetter W. L. Prognostic and therapeutic molecular markers in the clinical management of esophageal cancer. Expert Review of Molecular Diagnostics . 2020;20(4):401–411. doi: 10.1080/14737159.2020.1731307. [DOI] [PubMed] [Google Scholar]
- 22.Kapoor C., Vaidya S., Wadhwan V., Kaur G., Pathak A. Seesaw of matrix metalloproteinases (MMPs) Journal of Cancer Research and Therapeutics . 2016;12(1):28–35. doi: 10.4103/0973-1482.157337. [DOI] [PubMed] [Google Scholar]
- 23.Pittayapruek P., Meephansan J., Prapapan O., Komine M., Ohtsuki M. Role of matrix metalloproteinases in photoaging and photocarcinogenesis. International Journal of Molecular Sciences . 2016;17(6):p. 868. doi: 10.3390/ijms17060868. [DOI] [PMC free article] [PubMed] [Google Scholar]
- 24.Mondal S., Adhikari N., Banerjee S., Amin S. A., Jha T. Matrix metalloproteinase-9 (MMP-9) and its inhibitors in cancer: a minireview. European Journal of Medicinal Chemistry . 2020;194 doi: 10.1016/j.ejmech.2020.112260.112260 [DOI] [PubMed] [Google Scholar]
- 25.Liao H. Y., Da C. M., Liao B., Zhang H. H. Roles of matrix metalloproteinase-7 (MMP-7) in cancer. Clinical Biochemistry . 2021;92:9–18. doi: 10.1016/j.clinbiochem.2021.03.003. [DOI] [PubMed] [Google Scholar]
- 26.Liu M., Hu Y., Zhang M. F., et al. MMP1 promotes tumor growth and metastasis in esophageal squamous cell carcinoma. Cancer Letters . 2016;377(1):97–104. doi: 10.1016/j.canlet.2016.04.034. [DOI] [PubMed] [Google Scholar]
- 27.Lin C. L., Ying T. H., Yang S. F., et al. MTA2 silencing attenuates the metastatic potential of cervical cancer cells by inhibiting AP1-mediated MMP12 expression via the ASK1/MEK3/p38/YB1 axis. Cell Death and Disease . 2021;12(5):p. 451. doi: 10.1038/s41419-021-03729-1. [DOI] [PMC free article] [PubMed] [Google Scholar]
- 28.Klupp F., Neumann L., Kahlert C., et al. Serum MMP7, MMP10 and MMP12 level as negative prognostic markers in colon cancer patients. BMC Cancer . 2016;16(1):p. 494. doi: 10.1186/s12885-016-2515-7. [DOI] [PMC free article] [PubMed] [Google Scholar]
- 29.Lv F. Z., Wang J. L., Wu Y., Chen H. F., Shen X. Y. Knockdown of MMP12 inhibits the growth and invasion of lung adenocarcinoma cells. International Journal of Immunopathology and Pharmacology . 2015;28(1):77–84. doi: 10.1177/0394632015572557. [DOI] [PubMed] [Google Scholar]
- 30.Sharma N., Shin E. J., Pham D. T., et al. GPx-1-encoded adenoviral vector attenuates dopaminergic impairments induced by methamphetamine in GPx-1 knockout mice through modulation of NF-κB transcription factor. Food and Chemical Toxicology . 2021;154 doi: 10.1016/j.fct.2021.112313.112313 [DOI] [PubMed] [Google Scholar]
- 31.Shin E. J., Lee S. H., Sharma N., et al. An adenoviral vector encoded with the GPx-1 gene attenuates memory impairments induced by β-amyloid (1-42) in GPx-1 KO mice via activation of M1 mAChR-mediated signalling. Free Radical Research . 2021;55(1):11–25. doi: 10.1080/10715762.2020.1854455. [DOI] [PubMed] [Google Scholar]
- 32.Strycharz-Dudziak M., Fołtyn S., Dworzański J., et al. Glutathione peroxidase (GPx) and superoxide dismutase (SOD) in oropharyngeal cancer associated with EBV and HPV coinfection. Viruses . 2020;12(9) doi: 10.3390/v12091008.1008 [DOI] [PMC free article] [PubMed] [Google Scholar]
- 33.Yuzhalin A. E., Kutikhin A. G. Inherited variations in the SOD and GPX gene families and cancer risk. Free Radical Research . 2012;46(5):581–599. doi: 10.3109/10715762.2012.658515. [DOI] [PubMed] [Google Scholar]
- 34.Lou W., Ding B., Wang S., Fu P. Overexpression of GPX3, a potential biomarker for diagnosis and prognosis of breast cancer, inhibits progression of breast cancer cells in vitro. Cancer Cell International . 2020;20(1):p. 378. doi: 10.1186/s12935-020-01466-7. [DOI] [PMC free article] [PubMed] [Google Scholar]
- 35.Qi X., Ng K. T. P., Shao Y., et al. The clinical significance and potential therapeutic role of GPx3 in tumor recurrence after liver transplantation. Theranostics . 2016;6(11):1934–1946. doi: 10.7150/thno.16023. [DOI] [PMC free article] [PubMed] [Google Scholar]
- 36.Zhang X., Zheng Z., Yingji S., et al. Downregulation of glutathione peroxidase 3 is associated with lymph node metastasis and prognosis in cervical cancer. Oncology Reports . 2014;31(6):2587–2592. doi: 10.3892/or.2014.3152. [DOI] [PubMed] [Google Scholar]
- 37.Zhu X., Wang J., Li L., et al. GPX3 suppresses tumor migration and invasion via the FAK/AKT pathway in esophageal squamous cell carcinoma. American Journal of Tourism Research . 2018;10(6):1908–1920. [PMC free article] [PubMed] [Google Scholar]
- 38.Hinshaw D. C., Shevde L. A. The tumor microenvironment innately modulates cancer progression. Cancer Research . 2019;79(18):4557–4566. doi: 10.1158/0008-5472.can-18-3962. [DOI] [PMC free article] [PubMed] [Google Scholar]
- 39.Kim J., Bae J. S. Tumor-associated macrophages and neutrophils in tumor microenvironment. Mediators of Inflammation . 2016;2016:1–11. doi: 10.1155/2016/6058147. [DOI] [PMC free article] [PubMed] [Google Scholar]
- 40.Jarosz-Biej M., Smolarczyk R., Cichoń T., Kułach N. Tumor microenvironment as A “game changer” in cancer radiotherapy. International Journal of Molecular Sciences . 2019;20(13) doi: 10.3390/ijms20133212.3212 [DOI] [PMC free article] [PubMed] [Google Scholar]
Associated Data
This section collects any data citations, data availability statements, or supplementary materials included in this article.
Supplementary Materials
Figure S1. (a, b) The proportion of the 22 immune cells detected by the CIBERSORT algorithm. (c) The differences in the structure of TIICs between normal tissue and ESCC tissues.
Data Availability Statement
The data used to support the findings of this study are included within the article. Additional data can be made available from the corresponding author upon request.
Disclosure
Jipeng Zhang, Nian Zhang, and Xin Yang should be considered as equal co-first authors