Abstract
Purpose:
To visualize and quantify vascular networks in individuals with ocular surface squamous neoplasia (OSSN) through optical coherence tomography angiography (OCTA).
Method:
Cross-sectional study of OSSN patients. Vascular networks were measured by OCTA in the epithelium and sub-epithelial space in the tumors, adjacent tissue, and in the contralateral eye. Vessel area density (VAD, percent of blood vessels within 2.14 mm2), was calculated for each location. Total tumor density (TTD, percent of blood vessels within the entire tumor) was calculated. VAD was assessed separately for corneal and conjunctival locations and compared.
Results:
Fifteen patients with OSSN were included. The mean age was 61 ± 12 years and the majority were male (80%). The mean tumor area, volume, depth, VAD, and TTD were 28.6 ± 8.1 mm2 (range, 14.1–39.0), 9.1 ± 4.2 mm3 (range, 3.4–18.8), 317 ± 107 μm (range, 177–570), and 32.2% ± 11.7% (range, 18.3–58.8), respectively. The VAD was highest under the conjunctival component of tumor (42.6% ± 9.6%) followed by within the conjunctival tumor (32.8% ± 8.3%). These densities were higher than the VADs measured in all other tissues (all P < 0.01). The VAD within conjunctival component of tumor was significantly higher than those with corneal component (33.5% ± 9.6% vs. 26.8% ± 6.1%, p = 0.046). The VAD under conjunctival tumor was also significantly higher than under corneal component (46.4% ± 8.6% vs. 35.2% ± 5.6%, p = 0.001).
Conclusions:
OCTA imaging allowed for visualization and quantification of vessel structure and density within, under, and surrounding OSSN.
Keywords: ocular surface squamous neoplasia, vascular networks, vessel area density, optical coherence tomography angiography, OCTA
1. Introduction
Ocular surface squamous neoplasia (OSSN) is the most common non-pigmented tumor of the ocular surface [1]. It is comprised of a wide spectrum of dysplastic changes of the ocular surface epithelium, including corneal and conjunctival intraepithelial neoplasia (CIN) and squamous cell carcinoma (SCC) [2,3]. Clinically, OSSN typically arises in the inter-palpebral limbus area. Features of OSSN on the conjunctiva include papillary, gelatinous, leukoplakic, and/or nodular appearances. When OSSN involves the cornea, it appears as an opalescent lesion[4]. High-resolution anterior segment optical coherence tomography (HR-OCT) has been used as an optical biopsy to aid in the diagnosis of OSSN and guide treatment and has been found to have a high sensitivity and specificity for diagnosing OSSN when compared to biopsy[5]. The classical pattern visualized on HR-OCT is a thickened, hyper-reflective epithelium with an abrupt transition between normal and abnormal epithelium [6–9].
Little is known about tumor vascular patterns within and around OSSN. However, studies in tumors in other parts of the body have demonstrated that vessel patterns and density can vary both within the tumors and when compared to non-involved adjacent tissue [10–12]. Some features that have been found characteristic of tumors outside the eye include structural vessel heterogeneity, tortuosity, and dilation [13,14]. Tumor vessels have been found to lack smooth muscle cells, have discontinuous endothelial cell lining, and an abnormal basement membrane, all of which result in vessel hyper-permeability [10–12,15,16]. Similar features have been found in OSSN using fluorescein angiography (FA) and indocyanine green angiography (ICGA). In one paper encompassing 6 OSSN lesions, FA showed abnormal vascular leakage and ICGA demonstrated focal or sea fan-shaped intra-tumoral vessels and feeding vessels in the non-involved conjunctiva [17].
Optical coherence tomography angiography (OCTA) is a rapid, non-invasive imaging modality that can detect vessel network via motion contrast imaging of erythrocyte movement across sequential B-scans [18,19]. It is commonly used to profile retinal and optic disc vasculature and has the advantage of acquiring images without the need for contrast dyes, unlike FFA and ICGA [20–22]. OCTA can generate high-resolution cross-sectional images that approach a histological level of resolution. This unprecedented resolution, coupled with the simple, fast and non-invasive nature of this imaging platform, has allowed a host of basic and clinical research applications. For example, OCTA has been applied to a number of retinal vascular diseases, including diabetic retinopathy, age-related macular degeneration, retinal vascular occlusion, macular telangiectasia, and uveitis [23].
Unlike its frequent use in the assessment of posterior segment vasculatures, OCTA has been less frequently applied to the study of anterior segment disorders [24]. However, OCTA has several advantages compared to traditional imaging techniques including the acquisition of 3-D images as compared to slit lamp photography (SLP) and its ability to visualize blood vessels non-invasively, compared to dye-based angiography using FA and ICGA. Further advantages of OCTA include its ability to capture images with minimal operator training [24,25]. Prior studies have shown that OCTA can reproducibly visualize blood vessels within the conjunctiva, cornea, sclera, and iris [19,26–30]. OCTA has also been used to detect and quantify microvascular networks in and under areas of severe corneal opacification, which were not visible under slit lamp visualization [31]. As OCTA technology has not been robustly applied to the study of OSSN, in this paper, we aim to evaluate vessel density and morphology within tumors, under the tumors and compare them to other areas of the ocular surface, to gain insight on vessel abnormalities in OSSN.
2. Methods
2.1. Study design, setting, and population
This was a cross-sectional study of 15 patients with OSSN who were prospectively recruited from the Bascom Palmer Eye Institute, University of Miami Miller School of Medicine between November 2018 and August 2019 and underwent a complete ocular surface examination. OSSN was diagnosed by clinical and OCT appearance in all cases [5]. Biopsy was intentionally not performed as our goal was to study vascular patterns within OSSN and adjacent to the tumor in its natural state. Any surgical or incisional biopsy would change the observed patterns. This study was approved by the institutional review board for the University of Miami, Miller School of Medicine. Written informed consent was obtained from all subjects. All patients were treated according to the Declaration of Helsinki. Demographics of the study population were obtained.
2.2. Tumor characteristics
All patients were examined by an experienced ophthalmologist (CLK). Tumors were photographed and the appearance of the tumor categorized as: papillary (defined as a tumor having multiple abnormal blood vessels), leukoplakic (defined as a white, keratinized plaque overlying the tumor), and/or gelatinous (defined as having a gelatin-like appearance) [32]. In addition, tumor location was noted, including areas of involvement. In all cases, high-resolution OCT revealed thickened, hyper-reflective epithelium with an abrupt transition from normal to abnormal tissue.
2.3. Anterior segment optical coherence tomography angiography examination
The AngioVue OCTA system (Optovue, Fremont, California, USA) mounted with an adaptor lens for the anterior segment was used to image the anterior segment. The device has a central wavelength of 840 nm and performs 70,000 A-scans per second. The system has an axial resolution of approximately 5 μm and a beam width of approximately 22 μm. It takes approximately 3–4 seconds to obtain one raster scan, and two scans are needed to create an angiogram using proprietary angiography algorithms and motion correction technique (MCT). In the present study, the 6 × 6 mm scan pattern was utilized to acquire AS-OCTA images of the anterior segments. Each OCTA scan contained a raster scan with 304 (A-scan) x 304 (B-scan). As measured and reported previously [33], the field of view (FOV) of the OCTA with the 6 × 6 mm scan was 8.775 × 8.775 mm.
2.4. Location of acquisition, image segmentation and quantitative analysis
Images were obtained in 8 different areas (Figure 1). This included (a) within the conjunctival component of tumor; (b) within the corneal component of tumor (in the 11 patients with corneal involvement); (c) the sub-epithelial tissue under the conjunctival component of tumor and (d) under the corneal component of tumor (if applicable); (e) the sub-epithelial tissue adjacent to the conjunctival OSSN; (f) the conjunctival epithelium adjacent to OSSN; (g) the conjunctival epithelium in the same location but in the contralateral eye without OSSN; (h) the sub-epithelial tissue in the same location but in contralateral eye without OSSN.
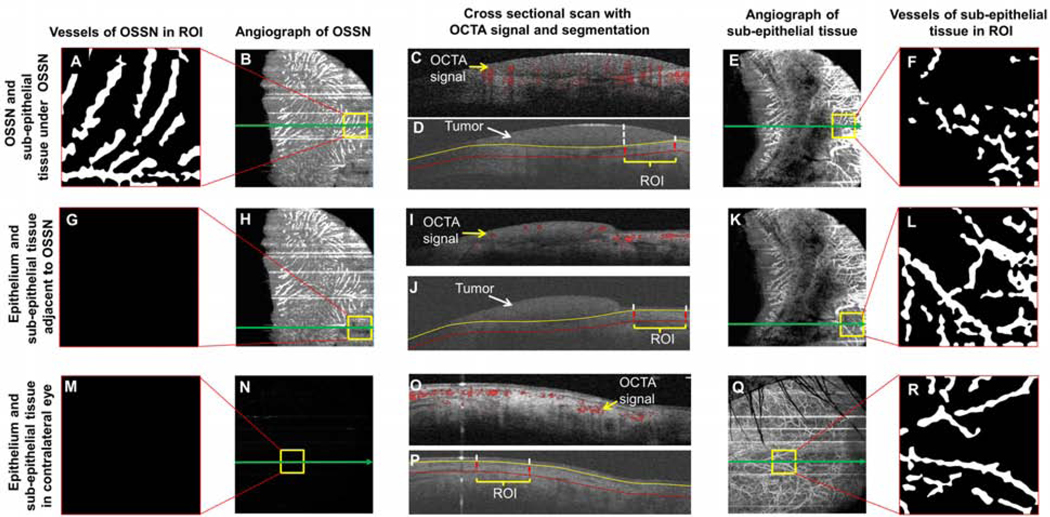
Figure 1. Image processing to extract the vasculature network in the region of interest (ROI).
In the eye with OSSN (top two rows, A-L), the boundaries of OSSN and adjacent epithelium were manually outlined in the three-dimensional dataset of the structure. In addition, the sub-epithelial tissue underneath (200 μm) the OSSN and epithelium adjacent to the OSSN were also outlined. Using the boundaries, the enface angiograph of OSSN and adjacent epithelium in the regions of interest were exported as well as the tissue underneath the tumor and adjacent epithelium (top two rows, A-L). The vessels were extracted using a series of image processing procedures to create the vessel images of OSSN, sub-epithelial tissue under OSSN (top row, A-F), epithelium adjacent to OSSN, and the sub-epithelial tissue under OSSN. In the contralateral eye without OSSN, the epithelium and sub-epithelial tissue were also processed in the same way as control (bottom row, M-R). All vessel densities were calculated based on a fixed area of 1.463 × 1.463 mm (2.14 mm2). The green arrow indicates the location of the corresponding cross-sectional images in the center column. The vertical dashed lines and yellow square boxes indicate the lateral boundaries of the regions of interest. OSSN, ocular surface squamous neoplasia.
All regions of interest (ROI) were segmented using a commercial software program (Orion™, Voxeleron LLC, Pleasanton, CA, USA). The volumetric OCTA data were using the software utility provided by the OCTA manufacturer. The dataset containing the OCT structure and angiograph data was read in the Orion software. When processing the images, the tumor area in the enface view (Figure 1B) and depth in the cross-sectional images (Figure 1D) were first outlined. Next, the superficial and deep boundaries of the tumor and connecting epithelium of the conjunctiva and/or cornea were outlined (Figure 1J). In addition, 200 μm underneath the bottom boundary of the tumor and adjacent epithelium were also outlined. In the contralateral eye, the conjunctival epithelium and sub-epithelial tissue were outlined in the same way (200 μm below the bottom boundary of the epithelium) as the eye with the tumor (Figure 1P). The vessels in the ROIs were cropped and analyzed using a fixed area of 1.463 × 1.463 mm (2.14 mm2). Images were processed using Photoshop (Adobe, San Jose, CA, USA). Equalization was performed and the image was converted to a grayscale mode (Figure 1 B, E, H, K, N, and Q). After that, the grayscale image processing of these cropped images was further processed using Image J (NIH Bethesda, Maryland, USA). A series of filtering and thresholding, including Gaussian blurring (Sigma = 4), bandpass filtering, and Otsu’s Thresholding were used to create the binary image (Figure 1A, F, G, L, M, R). Vessel area density (VAD) of the binary images was calculated as the ratio of the area occupied by the vessels per unit area as described previously [30,34]. Total tumor density (TTD) was calculated as the vascular density within the entire volume of the tumor.
2.5. Statistical analysis
All values are presented as mean ± standard deviation. All analyses were performed using IBM SPSS Statistics software package (ver. 25, IBM Corp., Armonk, NY, USA). Descriptive statistics were used to summarize patient demographic and clinical information. The main outcome variable was VAD which was compared between the different areas. ANOVA analysis was used to evaluate differences of the vascular measurements, and the post hoc test was used to test the pair-wise difference. Vessel patterns were also qualitatively described and compared to clinical tumor appearance. P values less than 0.05 were considered statistically significant.
3. Results
3.1. Baseline Characteristics
Table 1 reports the baseline characteristics of 15 patients who underwent OCTA. The mean age was 61 ± 12 years old. The majority were male (80%), and approximately half of the patients were Hispanic (53.3%).
Table 1:
Demographics and co-morbidities of the patient population (n=15)
| Demographics | |
|---|---|
| Age, mean (SD) [range] | 61 (12) [38–79] |
| Gender, male, n (%) | 12 (80.0%) |
| Race | |
| White, n (%) | 14 (93.3%) |
| Ethnicity | |
| Hispanic, n (%) | 8 (53.3%) |
| Smoking | |
| Former, n (%) | 2 (13.3%) |
| Current, n (%) | 1 (6.7%) |
| Co-morbidities, n (%) | |
| Hypertension | 6 (40.0%) |
| Hypercholesterolemia | 0 (0%) |
| Diabetes | 3 (20.0%) |
SD = standard deviation; n = number in group.
3.2. Characteristics and quantitative analysis of the angiography images
The mean tumor area, volume, depth, VAD, and TTD were 28.6 ± 8.1 mm2 (range, 14.1–39.0), 9.1 ± 4.2 mm3 (range, 3.4–18.8), 317 ± 107 μm (range, 177–570), and 32.2% ± 11.7% (range, 18.3–58.8), respectively. Eleven tumors involved both the conjunctiva and cornea, while 4 were located only in the conjunctiva. In the 11 tumors with corneal involvement, the mean length of vessel invasion into the cornea was 2.1 ± 0.7 mm (range, 1. 4–3.8) (Table 2).
Table 2:
Characteristics of patients with ocular surface squamous neoplasia
| Case # | Sex | Age (years) | Eye | LC | Conjunctiva | Cornea | Shadow | LKNV (mm) | TA (mm2) | TV (mm3) | TD (μm) | TTD (%) | ||
|---|---|---|---|---|---|---|---|---|---|---|---|---|---|---|
|
| ||||||||||||||
| P | G | L | ||||||||||||
| 1 | F | 69 | OS | T | + | + | - | + | + | 1.9 | 39.0 | 13.8 | 353 | 35.2 |
| 2 | M | 56 | OS | N | - | + | - | + | - | 2.1 | 36.9 | 6.6 | 179 | 25.8 |
| 3 | F | 60 | OS | N | - | + | - | + | - | 2.0 | 38.0 | 8.9 | 234 | 34.9 |
| 4 | M | 66 | OS | N | - | + | - | - | + | 0 | 20.9 | 7.8 | 371 | 36.0 |
| 5 | F | 46 | OD | T | - | + | - | - | + | 0 | 14.1 | 3.4 | 241 | 38.1 |
| 6 | M | 70 | OS | T | - | + | - | + | + | 1.4 | 20.4 | 7.0 | 344 | 38.0 |
| 7 | M | 71 | OS | S,T | + | - | - | + | + | 1.7 | 39.7 | 18.8 | 473 | 31.3 |
| 8 | M | 79 | OD | N | - | + | - | + | + | 3.8 | 36.2 | 12.1 | 335 | 58.8 |
| 9 | M | 65 | OD | T | - | + | - | + | - | 2.0 | 30.9 | 9.4 | 305 | 35.3 |
| 10 | M | 58 | OD | T | - | - | + | - | - | 0 | 25.7 | 5.8 | 227 | 49.7 |
| 11 | M | 38 | OD | N | + | - | + | + | + | 1.8 | 25.8 | 14.7 | 570 | 21.8 |
| 12 | M | 73 | OD | T | + | + | - | + | + | 2.4 | 10.9 | 6.2 | 571 | 32.9 |
| 13 | M | 46 | OD | T | - | + | + | + | + | 2.6 | 24.8 | 9.2 | 370 | 22.1 |
| 14 | M | 49 | OD | N | - | + | - | + | - | 1.5 | 24.8 | 4.4 | 177 | 18.7 |
| 15 | M | 65 | OD | N | - | + | - | + | - | 2.6 | 33.7 | 8.8 | 260 | 19.7 |
LC, location; LKNV, length of corneal neo-vessel invasion; TA, tumor area; TV, tumor volume; TD, tumor depth; TTD, total tumor density; F, female; M, male; OS, left eye; OD, right eye; P, papillary; G, gelatinous; L, leukoplakic; T, temporal; N, nasal; S, superior.
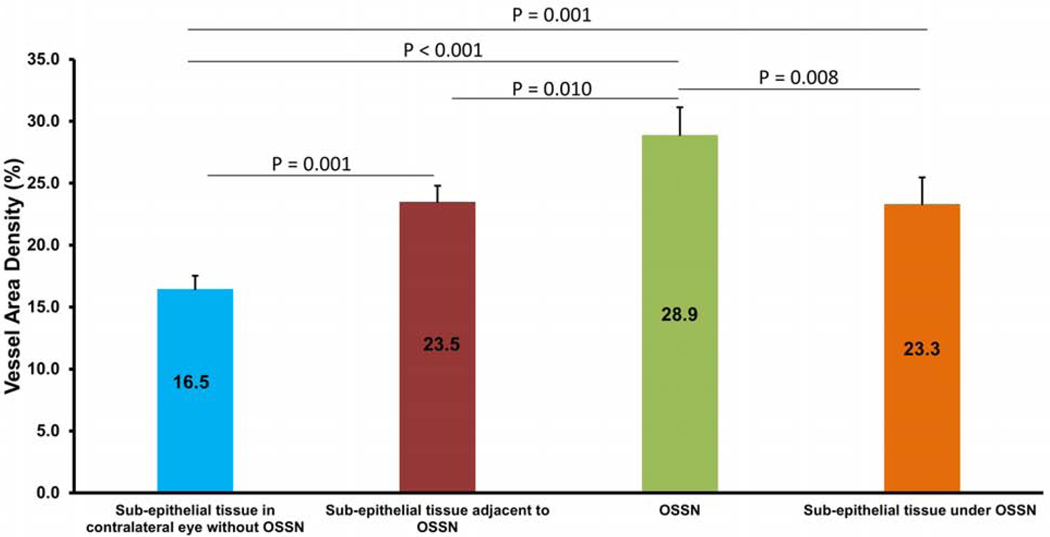
The highest VAD was found in the area directly beneath (200 μm) the conjunctival component of the tumor (42.6% ± 9.6%) followed by within the conjunctival tumor itself (32.8 ± 8.3%) (Figure 2). Both of these locations had significantly higher VAD than tissues adjacent to the tumor and tissues in the non-involved eye (all P values < 0.01, Figure 2). Not surprisingly, VAD was low in the adjacent epithelium, both in eyes with OSSN and in non-involved eyes.
Figure 2.
Vessel area density (VAD) in regions of interest in the conjunctiva (n = 15). The VAD was highest in sub-epithelial tissue under the conjunctival component of OSSN, followed by within the conjunctival component of the tumor itself. VAD in both of these areas was significantly higher than all other areas studied (P < 0.01). OSSN, ocular surface squamous neoplasia. Bar = standard error.
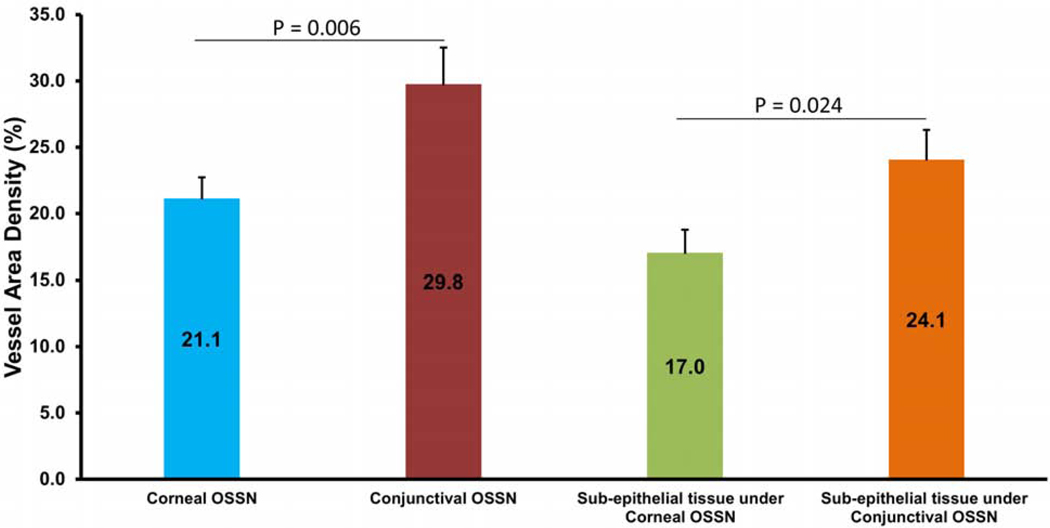
In the 11 tumors with corneal involvement, the VAD in the conjunctival component of the tumor was significantly higher than the VAD in the corneal component of the tumor. Similarly, VAD in the sub-epithelial tissue under the conjunctival OSSN was significantly higher than the sub-epithelial tissue under corneal OSSN (P < 0.05, Figure 3).
Figure 3.
Comparison of vessel area density (VAD) in conjunctival vs. corneal components of OSSN (n = 11). The VAD in the conjunctival component was significantly higher than the corneal component of OSSN. Similarly, VAD in the sub-epithelial area under the conjunctival OSSN was significantly higher than under the corneal OSSN (P < 0.05). OSSN, ocular surface squamous neoplasia. Bar = standard error.
3.3. Select individual cases demonstrate differences in the vascular pattern by OSSN type
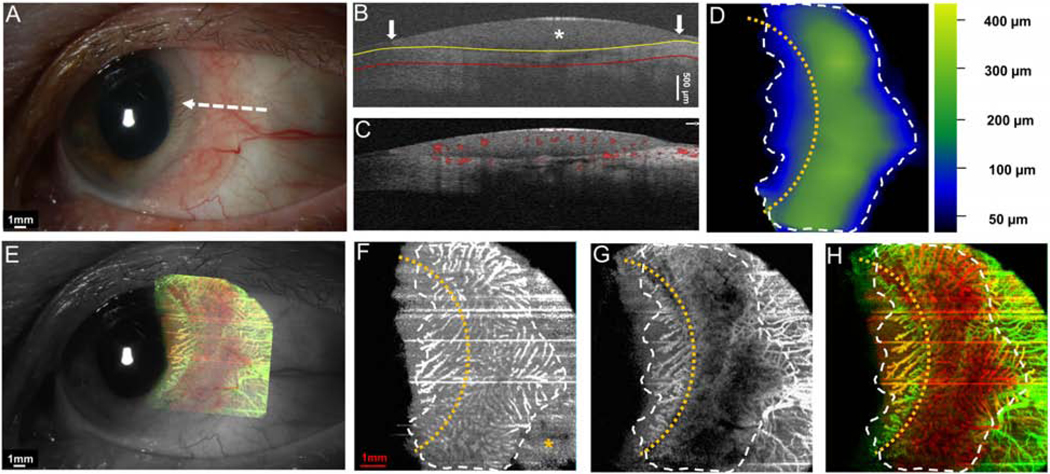
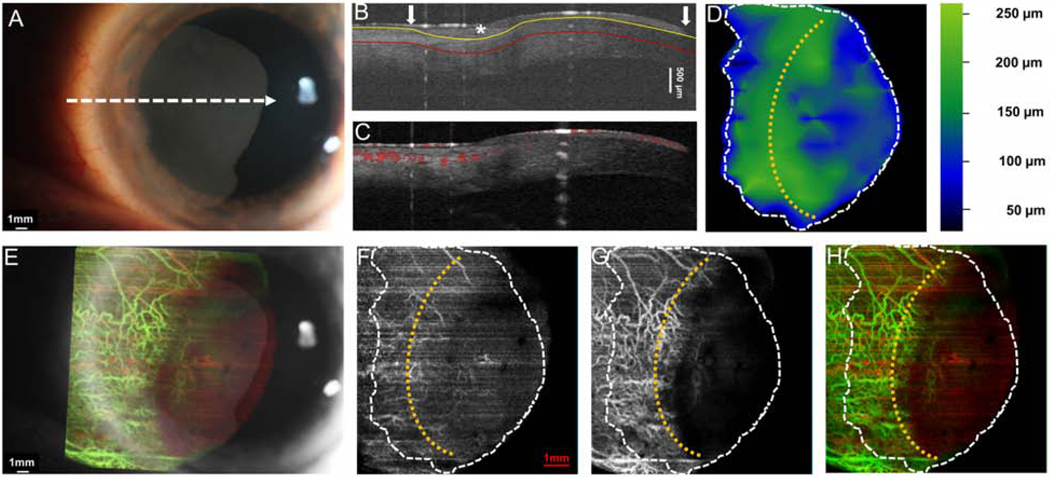
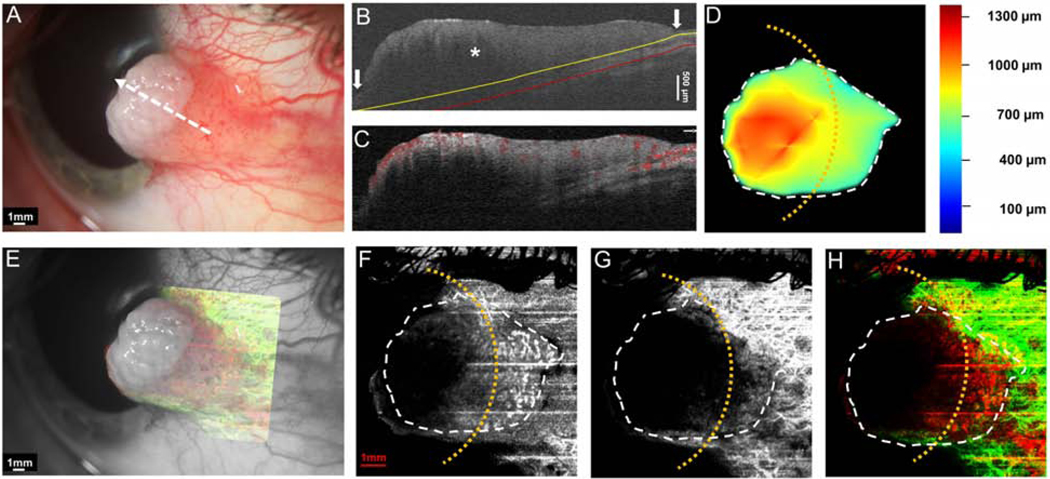
Case 1 was a 69-year-old female who presented with an OSSN with papillomatous and gelatinous components involving the conjunctiva and cornea. The angiography image revealed a “sea fan” like picture with branching abnormal blood vessels in the limbus and cornea. Vessels were prominent in both in the OSSN and the sub-epithelial tissue under the OSSN (Figure 4).
Figure 4. A 69-year-old female with a papillomatous and gelatinous OSSN involving the conjunctiva and cornea.
(A) Slit-lamp photograph of the OSSN showing multiple abnormal blood vessels surrounding and within the lesion. White dashed arrow shows the cross-sectional cut of the OCT. (B) Cross-sectional imaging detects hyper-reflective thickened epithelium (white asterisk) with an abrupt transition from normal to abnormal (white arrow) characteristic of OSSN. The yellow line shows the bottom boundary of OSSN and sub-epithelial tissue adjacent to the tumor. The red line shows the sub-epithelial tissue (200 μm) underneath the tumor. (C) Blood flow signals are seen within the tumor, beneath the tumor as well as in the surrounding sub-epithelial tissue and epithelium adjacent to the OSSN. Note the shadow from the hyper-reflective thick lesion diminishes the blood flow signals under the central portion of the OSSN. (D) The tumor thickness map depicts the thickness of the tumor, demonstrating that it is thickest in the center. (E) Overlay of the enface angiograph with grayscale slit-lamp illustrates the vessels on the ocular surface in relation to the slit-lamp view. (F) The enface angiograph of OSSN and epithelium adjacent to OSSN shows a high density of vessels within the OSSN, in a “sea fan” pattern and no such vasculature pattern in the epithelium adjacent to the OSSN (yellow asterisk). (G) The enface angiograph 200 μm below the tumor also demonstrates dense vessels in the sub-epithelial tissue under the OSSN at the tumor edge and the sub-epithelial tissue adjacent to the OSSN. (H) The merged image from the angiographic enface images (F and G) shows the vessels within the tumor OSSN (red) and under the tumor in the sub-epithelial tissue (green).
OSSN, ocular surface squamous neoplasia. Dashed white lines (D, F, G, and H) indicate the tumor boundary. Curve dashed yellow line (D, F, G, and H) indicates the limbus.
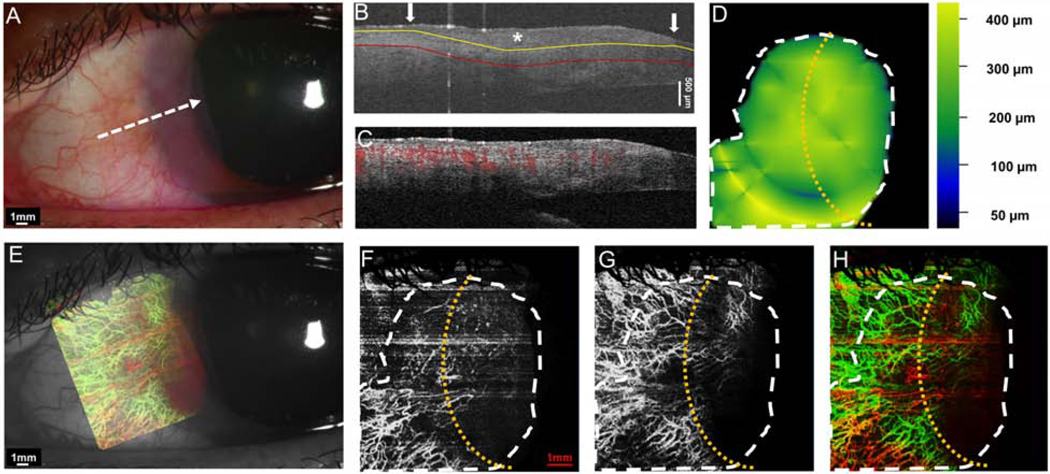
Case 2 was a 56-year-old male who presented with a primarily corneal OSSN with a small gelatinous component involving the limbal conjunctiva. The conjunctival boundary of the tumor was not clear at the slit lamp due to its flat appearance. Interestingly, the OCTA demonstrated blood vessels in the corneal that were not apparent clinically. This was visualized in the corneal portion of the tumor. Furthermore, angiography images disclosed that blood vessels inside the lesion connected to the tissue under the tumor (Figure 5).
Figure 5. A 56-year-old male with a primarily corneal OSSN with adjacent gelatinous lesion involving the limbus and cornea.
(A) Slit-lamp photograph depicts a primarily opalescent corneal OSSN with limbal conjunctival involvement. No blood vessels were visible under the slit lamp in the corneal portion of the OSSN. White dashed arrow shows the cross-sectional cut. (B) The cross-sectional image reveals mildly thickened hyper-reflective epithelium on the cornea and conjunctiva (asterisk) with an abrupt transition from normal to abnormal (arrow). The yellow line shows the bottom boundary of OSSN. The red line shows the sub-epithelial tissue (200 μm) underneath the tumor. (C) Cross-sectional OCT detects the blood flow signals in the epithelium of both the corneal and conjunctival OSSN and the sub-epithelial tissue under limbal portion of the OSSN. (D) The tumor thickness map depicts the thickness of the tumor, demonstrating that it is thickest at the limbus. (E) Overlay of the enface angiograph with grayscale slit-lamp illustrates the vessels on the ocular surface in relation to the slit-lamp view. (F) The enface angiograph of OSSN and epithelium adjacent to OSSN shows scattered vasculature in the conjunctival and corneal portion of the OSSN. (G) Interestingly, there were tufts of abnormal blood vessels under the corneal component, which could not be visualized with the slit lamp. (H) The merged image from the angiographic enface images (F and G) shows the vessels within the tumor OSSN (red) connecting to the vessels under the tumor in the sub-epithelial tissue (green).
OSSN, ocular surface squamous neoplasia. Dashed white lines (D, F, G, and H) indicate the tumor boundary. Curve dashed yellow line (D, F, G, and H) indicates the limbus.
Case 3 was a 60-year-old female who presented with a gelatinous conjunctival OSSN accompanied by cornea involvement. The cross-sectional cut had typical features of OSSN with thickened hyper-reflective epithelium and abrupt transition from normal. Importantly, abnormal blood flow signals were found underneath the tumor that could not be detected clinically. The angiography image disclosed that the blood vessels scattered inside the lesion connected to blood vessels in the underlying tissue (Figure 6).
Figure 6. A 60-year-old female patient with a gelatinous OSSN involving cornea and limbus.
(A) Slit-lamp photograph shows OSSN with multiple abnormal blood vessels surrounded the lesion. A white dashed arrow shows the location of the cross-sectional cut. (B) The cross-sectional image reveals mildly thickened epithelium on the cornea and conjunctiva (asterisk) with an abrupt transition from normal to abnormal (arrow). The yellow line shows the bottom boundary of OSSN and sub-epithelial tissue adjacent to the tumor. The red line shows the sub-epithelial tissue (200 μm) underneath the tumor. (C) Cross-sectional OCT detects the blood flow signals in the epithelium of both the corneal and conjunctival OSSN, and the subepithelial tissue under the limbal portion of the OSSN. (D) The tumor thickness map depicts the thickness of the tumor, demonstrating that it was overall uniform in the thickness. (E) Overlay of the enface angiograph with grayscale slit-lamp illustrates the vessels on the ocular surface in relation to the slit-lamp view. (F) The enface angiograph of OSSN and epithelium adjacent to OSSN shows a high density of vessels within both the corneal and limbal portion of the OSSN. (G) The enface angiograph demonstrates dense vessels 200 μm below the tumor, in the sub-epithelial tissue under the OSSN. In the sub-epithelial tissue adjacent to the OSSN, dense vessels were also noted, some of which connected to the vessels under the tumor. (H) The merged image from the angiographic enface images (F and G) shows the vessels within the tumor (red) connect to vessels under the tumor in the sub-epithelial tissue (green).
OSSN, ocular surface squamous neoplasia. Dashed white lines (D, F, G, and H) indicate the tumor boundary. Curve dashed yellow line (D, F, G, and H) indicates the limbus.
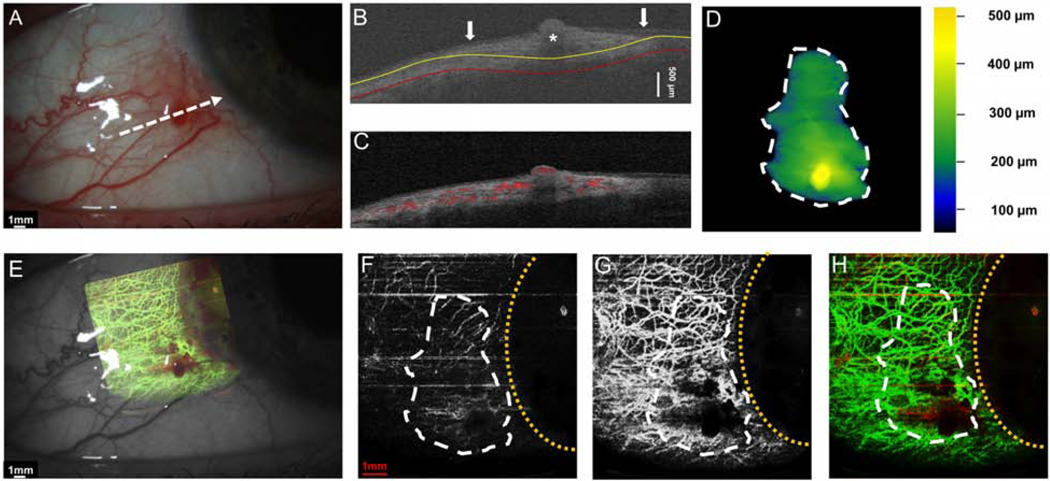
Case 5 was a 46-year-old female patient who presented with a gelatinous OSSN without corneal involvement. The angiography image disclosed blood vessels scattered inside the lesion. There was no corneal tumor, and no abnormal blood vessels were noted in the cornea (Figure 7).
Figure 7. A 46-year-old female with a gelatinous conjunctival OSSN.
(A) Slit-lamp photograph depicts a gelatinous conjunctival lesion without the involvement of the cornea. White dashed arrow shows the cross-sectional cut. (B) The cross-sectional image reveals thickened epithelium on the conjunctiva (asterisk) with an abrupt transition from normal to abnormal (arrow). The yellow line indicates the bottom boundary of OSSN and the red line shows the sub-epithelial tissue (200 μm) underneath the tumor. (C) Cross-sectional OCT detects the blood flow signals in the epithelium OSSN, and the sub-epithelial tissue under the OSSN. (D) The tumor thickness map depicts the elevation at the area of the elevated nodule (yellow spot on the map). (E) Overlay of the enface angiograph with grayscale slit-lamp illustrates the vessels on the ocular surface in relation to the slit-lamp view. (F) The enface angiograph of OSSN shows only mild vascularity. (G)The enface angiograph of the sub-epithelial tissue 200 μm under the OSSN shows dramatically more vessels under the tumor and in the sub-epithelial tissue adjacent to the OSSN. (H) The merged image from the angiographic enface images (F and G) shows the few vessels within the tumor OSSN (red) and the greater network under the tumor in the sub-epithelial tissue (green).
OSSN, ocular surface squamous neoplasia. Dashed white lines (D, F, G, and H) indicate the tumor boundary. Curve dashed yellow line (D, F, G, and H) indicates the limbus.
Case 7 was a 71-year-old male patient who presented with a papillomatous OSSN. The tumor was located on the superior and temporal bulbar conjunctiva and involved the limbus and cornea. The angiography image of this case showed that the vascular pattern of the tumor mirrored the “sea fan” with tufts of branching abnormal blood vessels in the peripheral cornea and tissue underlying the tumor (Figure 8).
Figure 8. A 71-year-old male patient with a papillomatous OSSN involving limbus and cornea.
(A) Slit-lamp photograph of a papillomatous OSSN on the conjunctiva and cornea. White dashed arrow shows the cross-sectional cut. (B) The cross-sectional image reveals significantly thickened epithelium on the conjunctiva (asterisk) with an abrupt transition from normal to abnormal (arrow). The yellow line shows the bottom boundary of OSSN. The red line shows the sub-epithelial tissue (200 μm) beneath the tumor. (C) Cross-sectional OCT detects the blood flow signals in the epithelium of both the corneal and conjunctival OSSN, and the sub-epithelial tissue of the OSSN. (D) The tumor thickness map depicts the thickness of the tumor, demonstrating that it is thickest at the bulbar conjunctival margin. (E) Overlay of the enface angiograph with grayscale slit-lamp in relation to the slit-lamp view. The corneal vasculature is easily visualized. (F)The enface angiograph of OSSN illustrates the vessels are primarily within the conjunctival portion of the OSSN. (G) The enface angiograph of the sub-epithelial space, 200 μm below the tumor demonstrates dramatic vessel “sea fan” under the corneal component, which was not well seen under the slit lamp. (H) The merged image from the angiographic enface images (F and G, show the vessels within the tumor OSSN (red) and under the tumor in the sub-epithelial tissue (green). (H) The merged image from the angiographic enface images (F and G) shows the vessels within the tumor OSSN (red) and under the tumor in the sub-epithelial tissue (green) demonstrating that the majority of the vessels are deep in the sub-epithelial space.
OSSN, ocular surface squamous neoplasia. Dashed white lines (D, F, G, and H) indicate the tumor boundary. Curve dashed yellow line (D, F, G, and H) indicates the limbus.
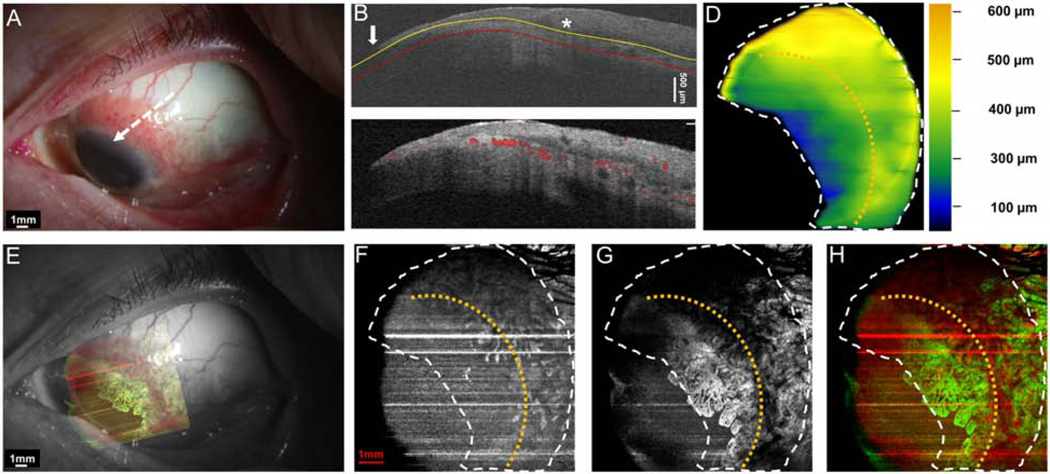
Case 11 was a 38-year-old male who presented with an OSSN with papillomatous and leukoplakic components involving the limbus and cornea. The angiography image, in this case, disclosed a dramatic vasculature pattern with in the conjunctival/papillary portion of the tumor and in particular, the deep surrounding sub-epithelial tissue. Due to the leukoplakia and the thick, large head of the lesion over the cornea, shadowing limited view of the corneal portion of the tumor (Figure 9).
Figure 9. A 38-year-old male patient with OSSN with papillomatous and leukoplakic features involving limbus and cornea.
(A) Slit-lamp photograph showed highly elevated OSSN with leukoplakia at the head, and papillary tail. White dashed arrow shows the cross-sectional cut. (B) The cross-sectional image reveals dramatically thickened epithelium on the cornea and conjunctiva (asterisk) with an abrupt transition from normal to abnormal (arrow). The yellow line shows the bottom boundary of OSSN. The red line shows the sub-epithelial tissue (200 μm) underneath the tumor. (C) Cross-sectional OCT detects the blood flow signals in the superficial layers of the elevated epithelium and the sub-epithelial tissue under the limbal portion of the OSSN. Note the shadow from the hyper-reflective thick lesion diminishes the blood flow signals within the OSSN. (D) The tumor thickness map depicts the thickness of the tumor, demonstrating that it is thickest at the elevated leukoplakic head. (E) Overlay of the enface angiograph with grayscale slit-lamp illustrates the vessels on the ocular surface in relation to the slit-lamp view. Note that vessels are not visualized under the leukoplakic head. (F) The enface angiograph of OSSN and epithelium adjacent to OSSN shows a high density of vessels within the conjunctival/limbal part of the OSSN. No vasculature in the epithelium of the leukoplakic head was noted, only shadowing. (G) The enface angiograph also demonstrates dense vessels in the sub-epithelial tissue under the OSSN at the tumor edge and the surrounding tissue.
(H) The merged image from the angiographic enface images (F and G) shows the vessels within the tumor OSSN (red) and under the tumor in the sub-epithelial tissue (green). Note the limitation of the OCTA in the setting of the dense leukoplakia.
OSSN, ocular surface squamous neoplasia. Dashed white lines (D, F, G, and H) indicate the tumor boundary. Curve dashed yellow line (D, F, G, and H) indicates the limbus.
3.4. Summary of OCTA signs in ocular surface squamous neoplasia
In conclusion, OCTA was able to demonstrate vasculature patterns in corneal and conjunctival OSSN, the tissue beneath the tumor (200 μm) and the tissue adjacent to the OSSN. Cross-sectional cuts of the OSSN showed thickened hyper-reflective epithelium with an abrupt transition between normal and abnormal epithelium. In additional to these classic findings for OSSN, the OCTA was able to demonstrate blood flow in the epithelial and sub-epithelial tissues.
Interestingly, the highest density of blood vessels in all cases was found in the tissue directly under the tumor, which we measured at 200 μm. This was followed by the density in the tumor, then the adjacent sub-epithelial tissues. These differences were statistically significant. In tumors that involved the cornea, vessel density within the corneal component and sub-epithelial tissue was visualized with the OCTA even when not seen clinically under the slit lamp. Not surprisingly, the vessel density under the corneal component was lower than the conjunctival component but more so than in normal corneas. OCTA was able to demonstrate corneal blood vessels within and under the tumor that were not apparent clinically.
As described, the most impressive network of vessels was in the sub-epithelial tissue, adjacent to OSSN, followed by the vessel density found in the conjunctival portion of the tumor. The vessels in the adjacent and sub tumor spaces connected to vessels within the tumor. Shadowing limited the enface evaluation of vessel density and characteristics in cases of leukoplakia or significant tumor thickness. The thickness of > 300 μm also diminished the blood flow signal of the underlying tissue in tumors on the cross-sectional cuts.
4. Discussion
To summarize, in this study, we used optical coherence tomography angiography (OCTA) to visualize and characterize the vasculature pattern in 15 patients with OSSN. Based on volumetric segmentation, the tumor boundary, tumor volume, tumor area, tumor depth, vessel area density (VAD), and total tumor density (TTD) were quantitatively measured in all cases. In addition, we quantified and characterized the vasculature patterns of OSSN and compared these findings to non-involved tissue.
We found that the area of highest VAD was in the sub-epithelial tissue under the tumor followed by within the tumor itself. Interestingly, VAD in the sub-epithelial tissue near the tumor was higher than in the contra-lateral uninvolved eye, indicating possible changes to tissue adjacent to the tumor and “feeding” it. We noted connections between vessels near the tumor and vessels directly under the tumor.
Interestingly, the OCTA was able to demonstrate vessels enface and blood flow on corneal lesions that were not visualized clinically. This was the most interesting finding (Figure 4, 5, 8). Not surprisingly, the VAD in the corneal component of OSSN was lower than in the conjunctival component of the same tumor.
OCT imaging has been a powerful tool in the characterization of OSSN. We and others have previously shown that OSSN has typical features on OCT including epithelial thickening, hyper-reflectivity, and an abrupt transition between normal and abnormal epithelium [5,35–38]. A limitation of OCT, however, is that it lacks the ability to detect vasculature inside and surrounding OSSN. We showed that OCTA can fill in these gaps by imaging vascular structures within and near OSSN in three dimensions. It was interesting to learn that the VAD below the tumor was significantly higher than in the tumor itself.
The angiographic features of OSSN seen on OCTA have been described in ICGA and FA. Specifically, we noted a high density of blood vessels in OSSN with papillomatous features that are similar to the sea fan-shaped vessels seen on ICGA. The limitation of OCTA compared to ICGA and FA is that OCTA cannot evaluate for feeder vessels as the direction of flow is not known and it cannot assess for vascular leakage [17]. However, OCTA has the advantage of collecting images in a fast and non-invasive manner. Certain vascular features of OSSN have been described with ICGA. For example, afferent vessels (feeder vessels) were fewer and smaller than efferent vessels (draining vessels) vessels in OSSN. Furthermore, the number of afferent and efferent vessels positively associated with the thickness of the lesion. ICGA also showed a difference in lesion filling time in benign, preinvasive, and invasive tumors, with the fastest filling times seen in invasive lesions and the slowest in benign lesions [39]. ICGA and FA were also able to detect a change in the vascular pattern with chemotherapy, both intra-tumoral and conjunctival feeding vessels disappeared [15,17]. While OCTA cannot measure these metrics based on limitations described above, our preliminary data suggest that some OCTA measures may help monitor the extent of blood vessel abnormalities in the tissue surrounding the tumor and in the cornea and perhaps detect changes with treatment. However, we do not yet know which metrics will be most important in sub-typing and following treatment (e.g., VAD under the tumor, in the tumor, and the sub-epithelial area near the tumor) and this is an important avenue of future study.
As with all studies, our findings must be considered in light of our study limitations. We intentionally did not biopsy the lesions. With classic clinical and OCT characteristics, we did not want to alter the virgin blood vessel pattern by inducing vascular change from surgical intervention. Despite only including 15 eyes, we found significant differences in VAD in different locations within and around the tumor, suggesting that these numbers were sufficient to answer our study question. Additionally, technical difficulties included nonparallel segmentation, projection artifacts, and inaccurate vessel density calculations during deep-resolved analysis. As such, we standardized our processing protocols to quantify VAD in an area near the edge of the tumor, and not in its center, to avoid such inaccurate measurements. As above, visualization of the vessel pattern was limited in the case of thick leukoplakia and extreme thickening (Figure 9). Additionally, there are inherent limitations in OCTA technology (e.g. cannot accurately identify afferent (feeder) and efferent (draining) tumor vessels). However, unlike ICGA, we were able to detect blood vessel density underneath the tumor. Our processing methodology uses manual outlining in the Orion software. Further development of automated segmentation will be needed to facilitate large scale studies. Finally, we cannot comment on the change of vessels with treatment as we did not follow patients over time. This is an important avenue for future study.
5. Conclusion
We describe results from a preliminary evaluation of optical coherence tomography angiography (OCTA) in the imaging vascular patterns in eyes with ocular surface squamous neoplasia (OSSN). We demonstrate our ability to visualize and quantify VAD and vasculature features in all cases of OSSN, irrespective of clinical features. The rich vasculature within the OSSN appeared to be significantly highest within 200 μm sub-epithelial tissue under the tumor, then within the tumor, and finally, adjacent to the tumor. Our findings set the foundation for future prospective studies that can assess which OCTA detected features can aid in the diagnosis and sub-typing of OSSN, guide treatment, and follow treatment response.
Acknowledgment
Funding Source
NIH Center Grant P30 EY014801, and a grant from the Research to Prevent Blindness (RPB),Guangzhou Science and Technology Project (No.201804010038) (Visiting Scholar Dr. Zhiping Liu),“Yangcheng Scholar” Youth Research Backbone Training Project of Guangzhou Municipal College (No.1201581612) (Visiting Scholar Dr. Zhiping Liu), Department of Veterans Affairs, Veterans Health Administration, Office of Research and Development, Clinical Sciences Research EPID-006–15S (Dr. Galor), R01EY026174 (Dr. Galor), the Dr. Ronald and Alicia Lepke Grant, the Lee and Claire Hager Grant, the H. Scott Huizenga Grant, the Robert Baer Family Grant, the Emilyn Page and Mark Feldberg Grant, the Robert and Virginia Farr Grant, the Jose Ferreira de Melo Grant, Richard and Kathy Lesser Grant, the Ted and Michele Kaplan Grant and the Richard Azar Family Grant Park (institutional grants).
Roles of sponsors
The above sponsors provided financial support to cover the researchers’ time but were not involved in the design and conduct of the study; collection, management, analysis, and interpretation of the data; preparation, review, or approval of the manuscript; or decision to submit the manuscript for publication.
Footnotes
Access to data
Jianhua Wang had full access to all data in the study and takes responsibility for the integrity of the data and the accuracy of the data analysis.
Declaration of Interest
The authors report no conflicts of interest. The authors alone are responsible for the content and writing of the paper.
Publisher's Disclaimer: This is a PDF file of an unedited manuscript that has been accepted for publication. As a service to our customers we are providing this early version of the manuscript. The manuscript will undergo copyediting, typesetting, and review of the resulting proof before it is published in its final form. Please note that during the production process errors may be discovered which could affect the content, and all legal disclaimers that apply to the journal pertain.
References
- [1].Cicinelli MV, Marchese A, Bandello F, Modorati G. Clinical Management of Ocular Surface Squamous Neoplasia: A Review of the Current Evidence. Ophthalmol Ther 2018;7:247–62. [DOI] [PMC free article] [PubMed] [Google Scholar]
- [2].Rao R, Saeed HN, Chodosh J. Advances in Imaging of Ocular Surface Tumors. Int Ophthalmol Clin 2017;57:21–9. [DOI] [PubMed] [Google Scholar]
- [3].Basti S, Macsai MS. Ocular surface squamous neoplasia: a review. Cornea 2003;22:687–704. [DOI] [PubMed] [Google Scholar]
- [4].Sayed-Ahmed IO, Palioura S, Galor A, Karp CL. Diagnosis and Medical Management of Ocular Surface Squamous Neoplasia. Expert Rev Ophthalmol 2017;12:11–9. [DOI] [PMC free article] [PubMed] [Google Scholar]
- [5].Kieval JZ, Karp CL, Abou SM, Galor A, Hoffman RA, Dubovy SR, et al. Ultra-high resolution optical coherence tomography for differentiation of ocular surface squamous neoplasia and pterygia. Ophthalmology 2012;119:481–6. [DOI] [PubMed] [Google Scholar]
- [6].Shousha MA, Karp CL, Perez VL, Hoffmann R, Ventura R, Chang V, et al. Diagnosis and management of conjunctival and corneal intraepithelial neoplasia using ultra high-resolution optical coherence tomography. Ophthalmology 2011;118:1531–7. [DOI] [PubMed] [Google Scholar]
- [7].Nanji AA, Sayyad FE, Galor A, Dubovy S, Karp CL. High-Resolution Optical Coherence Tomography as an Adjunctive Tool in the Diagnosis of Corneal and Conjunctival Pathology. Ocul Surf 2015;13:226–35. [DOI] [PMC free article] [PubMed] [Google Scholar]
- [8].Kieval JZ, Karp CL, Abou SM, Galor A, Hoffman RA, Dubovy SR, et al. Ultra-high resolution optical coherence tomography for differentiation of ocular surface squamous neoplasia and pterygia. Ophthalmology 2012;119:481–6. [DOI] [PubMed] [Google Scholar]
- [9].Thomas BJ, Galor A, Nanji AA, El SF, Wang J, Dubovy SR, et al. Ultra high-resolution anterior segment optical coherence tomography in the diagnosis and management of ocular surface squamous neoplasia. Ocul Surf 2014;12:46–58. [DOI] [PMC free article] [PubMed] [Google Scholar]
- [10].Konerding MA, Fait E, Gaumann A. 3D microvascular architecture of pre-cancerous lesions and invasive carcinomas of the colon. Br J Cancer 2001;84:1354–62. [DOI] [PMC free article] [PubMed] [Google Scholar]
- [11].Pries AR, Cornelissen AJ, Sloot AA, Hinkeldey M, Dreher MR, Hopfner M, et al. Structural adaptation and heterogeneity of normal and tumor microvascular networks. PLoS Comput Biol 2009;5:e1000394. [DOI] [PMC free article] [PubMed] [Google Scholar]
- [12].Less JR, Skalak TC, Sevick EM, Jain RK. Microvascular architecture in a mammary carcinoma: branching patterns and vessel dimensions. Cancer Res 1991;51:265–73. [PubMed] [Google Scholar]
- [13].Sorg BS, Moeller BJ, Donovan O, Cao Y, Dewhirst MW. Hyperspectral imaging of hemoglobin saturation in tumor microvasculature and tumor hypoxia development. J Biomed Opt 2005;10:44004. [DOI] [PubMed] [Google Scholar]
- [14].Dewhirst MW, Navia IC, Brizel DM, Willett C, Secomb TW. Multiple etiologies of tumor hypoxia require multifaceted solutions. Clin Cancer Res 2007;13:375–7. [DOI] [PubMed] [Google Scholar]
- [15].Brunner M, Steger B, Romano V, Hodson M, Zheng Y, Heimann H, et al. Identification of Feeder Vessels in Ocular Surface Neoplasia Using Indocyanine Green Angiography. Curr Eye Res 2018;43:163–9. [DOI] [PubMed] [Google Scholar]
- [16].Gee MS, Procopio WN, Makonnen S, Feldman MD, Yeilding NM, Lee WM. Tumor vessel development and maturation impose limits on the effectiveness of anti-vascular therapy. Am J Pathol 2003;162:183–93. [DOI] [PMC free article] [PubMed] [Google Scholar]
- [17].Sun Y, Hua R. Ocular surface squamous neoplasia: angiographic characteristics and response to subconjunctival/perilesional 5-fluorouracil injections. Drug Des Devel Ther 2019;13:1323–34. [DOI] [PMC free article] [PubMed] [Google Scholar]
- [18].Fung SSM, Stewart RMK, Dhallu SK, Sim DA, Keane PA, Wilkins MR, et al. Anterior segment optical coherence tomographic angiography assessment of acute chemical injury. Am J Ophthalmol 2019. [DOI] [PubMed] [Google Scholar]
- [19].Ang M, Sim DA, Keane PA, Sng CC, Egan CA, Tufail A, et al. Optical Coherence Tomography Angiography for Anterior Segment Vasculature Imaging. Ophthalmology 2015;122:1740–7. [DOI] [PubMed] [Google Scholar]
- [20].Uji A, Balasubramanian S, Lei J, Baghdasaryan E, Al-Sheikh M, Sadda SR. Impact of Multiple En Face Image Averaging on Quantitative Assessment from Optical Coherence Tomography Angiography Images. Ophthalmology 2017;124:944–52. [DOI] [PubMed] [Google Scholar]
- [21].Koustenis A Jr., Harris A, Gross J, Januleviciene I, Shah A, Siesky B. Optical coherence tomography angiography: an overview of the technology and an assessment of applications for clinical research. Br J Ophthalmol 2017;101:16–20. [DOI] [PubMed] [Google Scholar]
- [22].Jia Y, Tan O, Tokayer J, Potsaid B, Wang Y, Liu JJ, et al. Split-spectrum amplitude-decorrelation angiography with optical coherence tomography. Opt Express 2012;20:4710–25. [DOI] [PMC free article] [PubMed] [Google Scholar]
- [23].Kashani AH, Chen CL, Gahm JK, Zheng F, Richter GM, Rosenfeld PJ, et al. Optical coherence tomography angiography: A comprehensive review of current methods and clinical applications. Prog Retin Eye Res 2017;60:66–100. [DOI] [PMC free article] [PubMed] [Google Scholar]
- [24].Tan ACS, Tan GS, Denniston AK, Keane PA, Ang M, Milea D, et al. An overview of the clinical applications of optical coherence tomography angiography. Eye (Lond) 2018;32:262–86. [DOI] [PMC free article] [PubMed] [Google Scholar]
- [25].Lee WD, Devarajan K, Chua J, Schmetterer L, Mehta JS, Ang M. Optical coherence tomography angiography for the anterior segment. Eye Vis (Lond) 2019;6:4. [DOI] [PMC free article] [PubMed] [Google Scholar]
- [26].Ang M, Cai Y, Tan AC. Swept Source Optical Coherence Tomography Angiography for Contact Lens-Related Corneal Vascularization. J Ophthalmol 2016;2016:9685297. [DOI] [PMC free article] [PubMed] [Google Scholar]
- [27].Ang M, Cai Y, MacPhee B, Sim DA, Keane PA, Sng CC, et al. Optical coherence tomography angiography and indocyanine green angiography for corneal vascularisation. Br J Ophthalmol 2016;100:1557–63. [DOI] [PubMed] [Google Scholar]
- [28].Ang M, Cai Y, Shahipasand S, Sim DA, Keane PA, Sng CC, et al. En face optical coherence tomography angiography for corneal neovascularisation. Br J Ophthalmol 2016;100:616–21. [DOI] [PubMed] [Google Scholar]
- [29].Chien JL, Sioufi K, Ferenczy S, Say EAT, Shields CL. Optical Coherence Tomography Angiography Features of Iris Racemose Hemangioma in 4 Cases. JAMA Ophthalmol 2017;135:1106–10. [DOI] [PMC free article] [PubMed] [Google Scholar]
- [30].Akagi T, Uji A, Huang AS, Weinreb RN, Yamada T, Miyata M, et al. Conjunctival and Intrascleral Vasculatures Assessed Using Anterior-Segment Optical Coherence Tomography Angiography in Normal Eyes. Am J Ophthalmol 2018;196:1–9. [DOI] [PMC free article] [PubMed] [Google Scholar]
- [31].Roberts PK, Goldstein DA, Fawzi AA. Anterior Segment Optical Coherence Tomography Angiography for Identification of Iris Vasculature and Staging of Iris Neovascularization: A Pilot Study. Curr Eye Res 2017;42:1136–42. [DOI] [PMC free article] [PubMed] [Google Scholar]
- [32].Galor A, Karp CL, Oellers P, Kao AA, Abdelaziz A, Feuer W, et al. Predictors of ocular surface squamous neoplasia recurrence after excisional surgery. Ophthalmology 2012;119:1974–81. [DOI] [PMC free article] [PubMed] [Google Scholar]
- [33].Liu Z, Wang H, Jiang H, Gameiro GR, Wang J. Quantitative analysis of conjunctival microvasculature imaged using optical coherence tomography angiography. Eye Vis (Lond) 2019;6:5. [DOI] [PMC free article] [PubMed] [Google Scholar]
- [34].Kim AY, Chu Z, Shahidzadeh A, Wang RK, Puliafito CA, Kashani AH. Quantifying Microvascular Density and Morphology in Diabetic Retinopathy Using Spectral-Domain Optical Coherence Tomography Angiography. Invest Ophthalmol Vis Sci 2016;57:OCT362-OCT370. [DOI] [PMC free article] [PubMed] [Google Scholar]
- [35].Thomas BJ, Galor A, Nanji AA, El SF, Wang J, Dubovy SR, et al. Ultra high-resolution anterior segment optical coherence tomography in the diagnosis and management of ocular surface squamous neoplasia. Ocul Surf 2014;12:46–58. [DOI] [PMC free article] [PubMed] [Google Scholar]
- [36].Shousha MA, Karp CL, Perez VL, Hoffmann R, Ventura R, Chang V, et al. Diagnosis and management of conjunctival and corneal intraepithelial neoplasia using ultra highresolution optical coherence tomography. Ophthalmology 2011;118:1531–7. [DOI] [PubMed] [Google Scholar]
- [37].Shousha MA, Karp CL, Canto AP, Hodson K, Oellers P, Kao AA, et al. Diagnosis of ocular surface lesions using ultra-high-resolution optical coherence tomography. Ophthalmology 2013;120:883–91. [DOI] [PMC free article] [PubMed] [Google Scholar]
- [38].Nanji AA, Sayyad FE, Galor A, Dubovy S, Karp CL. High-Resolution Optical Coherence Tomography as an Adjunctive Tool in the Diagnosis of Corneal and Conjunctival Pathology. Ocul Surf 2015;13:226–35. [DOI] [PMC free article] [PubMed] [Google Scholar]
- [39].Cai Y, Alio Del Barrio JL, Wilkins MR, Ang M. Serial optical coherence tomography angiography for corneal vascularization. Graefes Arch Clin Exp Ophthalmol 2017;255:135–9. [DOI] [PubMed] [Google Scholar]


