

Abstract

Formulations containing nanosized drug particles such as nanocrystals and nanosized amorphous drug aggregates recently came into light as promising strategies to improve the bioavailability of poorly soluble drugs. However, the increased solubility due to the reduction in particle size cannot adequately explain the enhanced bioavailability. In this study, the mechanisms and extent of enhanced passive permeation by drug particles were investigated using atazanavir, lopinavir, and clotrimazole as model drugs. Franz diffusion cells with lipid-infused membranes were utilized to evaluate transmembrane flux. The impact of stirring rate, receiver buffer condition, and particle size was investigated, and mass transport analyses were conducted to calculate transmembrane flux. Flux enhancement by particles was found to be dependent on particle size as well as the partitioning behavior of the drug between the receiver solution and the membrane, which is determined by both the drug and buffer used. A flux plateau was observed at high particle concentrations above amorphous solubility, confirming that mass transfer of amorphous drug particles from the aqueous solution to the membrane occurs only through the molecularly dissolved drug. Mass transport models were used to calculate flux enhancement by particles for various drugs at different conditions. Good agreements were obtained between experimental and predicted values. These results should contribute to improved bioavailability prediction of nanosized drug particles and better design of formulations containing colloidal drug particles.
Keywords: unstirred water layer, liquid−liquid phase separation, permeability, flux, nanoparticle
Introduction
An increasing number of small molecule drugs on the market and in the drug discovery pipeline exhibit poor aqueous solubility due to advancements in combinatory chemistry and high-throughput screening assays.1−3 This has become a significant risk factor in the pharmaceutical industry and can often lead to compound failure during the drug development process due to insufficient bioavailability.4 To address this issue, various solubility enhancement strategies such as salt5 and cocrystal formation,6 lipid formulations,7 surfactants8 and inclusion complexes,9 and amorphous formulations10 are often used to improve the solubility and bioavailability of poorly soluble compounds. The use of solubilization agents, such as surfactants and cyclodextrins, augments the apparent solubility of the drug without increasing solute activity, which is the driving force for the drug to permeate membranes including the intestinal wall. However, the permeability and bioavailability of the drug were often found to be unaffected or even compromised by the use of solubilization additives.11−13 Supersaturating formulations, including salts,14 cocrystals,14 amorphous solid dispersions (ASDs),14 and lipid formulations,15 increase solute thermodynamic activity in solutions and can improve both the solubility and permeability of the drug. Therefore, they are increasingly being used as enabling strategies to address poor solubility issues of problematic drugs.
In solutions, the upper limit of solute activity is defined by the amorphous solubility of a solute. If the dissolved drug concentration exceeds its amorphous solubility, highly monodispersed amorphous drug aggregates, usually within the size range of less than 100 nm to a few micrometers,16,17 can spontaneously form in solutions via liquid–liquid phase separation (LLPS).18,19 LLPS usually occurs in fast-releasing amorphous solid dispersions,20,21 lipid-based formulations,22 and salts.14 Since only the molecularly dissolved drug (free drug) can directly permeate through membranes, the amorphous solubility of the drug also defines the maximum achievable solute activity and driving force for membrane permeation.
The drug absorption process can be described by Fick’s first law of diffusion since most oral drugs are absorbed via passive permeation,23 where transmembrane flux is proportional to solute activity, or free drug concentration, in the donor solution.24 While only the free drug directly permeates through membranes and the drug in the particle form does not, flux is expected to reach a plateau when donor drug concentration exceeds its amorphous solubility.11,18 Interestingly, the presence of nanosized drug particles, both crystalline and amorphous, was found to increase the drug’s permeability and bioavailability as reported by several studies using artificial membranes,25,26 cell monolayer models,27,28 and animal models.16,29 Such enhanced permeation by drug particles cannot be sufficiently explained by solubility enhancement or improved dissolution rates from particle size reduction. Another mechanism was proposed in recent years, termed as the particle drifting effect, where colloidal drug particles contribute to passive membrane permeation by moving through the unstirred water layer (UWL) adjacent to the membrane, leading to elevated membrane drug concentration and, subsequently, enhanced transmembrane flux.30
The UWL is a layer of unstirred water adjoining the surface of a membrane, such as an artificial membrane, a cell monolayer, or the human intestinal wall, due to friction of water.31 The presence of UWL in the gastrointestinal (GI) tract is also coincident with the mucus layer, which helps in maintaining the UWL.32 For lipophilic drugs that easily permeate lipid cell membranes, the otherwise negligible diffusional resistance from the UWL dominates the total resistance of permeation. For these drugs, colloidal species such as nanocrystals,25 amorphous aggregates,26,33 and micelles34−36 can move into the UWL, deliver a high payload of drug near the membrane surface, and thus increase membrane drug concentration and passive permeation rate across the membrane. However, key factors affecting the UWL thickness and the extent of particle drifting effect remain less understood, and a lack of linear pharmacokinetics was often found in formulations containing these drug colloids.16,37
Several attempts were made to understand the particle drifting effect quantitatively. Recently, Stewart et al. developed a mathematical model based on Fick’s law of diffusion to predict the extent of particle drifting effect by amorphous drug aggregates in vitro(26) and incorporated this model in physiologically based pharmacokinetic models using the Gastroplus platform to predict oral absorption in vivo.(38) In these studies, the authors used diffusion coefficients for different species, including the free drug, bile micelles, and amorphous aggregates of different sizes, to describe the flux by various species. However, UWL thickness variations for different species were not considered in these models.26,38 From a mass transport perspective, under the same experimental conditions (geometry, hydrodynamics, buffer composition, etc.), the thickness of the UWL is dependent on the diffusion coefficient of the moving species in the UWL.31,39 Such UWL thickness variations were previously observed experimentally for different small molecule solutes.39−43 Therefore, it would be inappropriate to assume that the free drug, micelles, and drug particles share the same UWL thickness. Although good predictions were obtained for some systems using a unified UWL thickness value, it is likely due to the fact that model drugs used in these studies26 have an extremely low aqueous solubility and therefore the contributions of free and micellar drug to absorption were negligible. In another study, Roos et al. also tried to delineate the contributions of colloidal micelle structures and nanocrystals to membrane permeability using Fick’s law of diffusion.29 These authors also assumed a unified UWL thickness for all moving species but used modified diffusion coefficients that were calculated from experimental flux data to compensate for enhanced passive permeation rates.
Thus, the purpose of this study was to identify key factors affecting UWL thickness and to provide a quantitative understanding of the extent of the particle drifting effect in vitro. A modified parallel artificial membrane permeability assay (PAMPA) was utilized in this study. Amorphous drug aggregates and molecularly dissolved drugs were chosen as model species of investigation due to the ease of particle generation and particle size control. Three poorly soluble drugs with diverse molecular structures, atazanavir (ATZ), lopinavir (LPV), and clotrimazole (CTZ), were chosen as model drugs with UWL-limited absorption due to their high lipophilicity. These compounds also have low crystallization propensities in solutions,44−46 enabling diffusion studies of amorphous drug aggregates within a manageable time frame. The chemical structures of these model drugs are shown in Figure 1.
Figure 1.

Chemical structure of model drugs.
Materials and Methods
Materials
Atazanavir and lopinavir were purchased from ChemShuttle (Wuxi, China), and clotrimazole was purchased from Sigma Aldrich (St. Louis, MO). Sodium phosphate monobasic monohydrate, sodium phosphate dibasic dihydrate, and bovine serum albumin (BSA) were purchased from Sigma-Aldrich (St. Louis, MO). Soy PC (l-α-phosphatidylcholine, 95%) was purchased from Avanti Polar Lipids (Alabaster, AL). High-performance liquid chromatography (HPLC)-grade solvents including methanol and dimethyl sulfoxide (DMSO) were purchased from Alfa Aesar (Ward Hills, MA), whereas HPLC-grade acetonitrile and n-dodecane were purchased from Sigma Aldrich (St. Louis, MO). Hydroxypropyl methylcellulose acetate succinate (HPMCAS) HF grade was a generous gift from Shin-Etsu (Tokyo, Japan). Reverse osmosis water with a resistivity value of 18 MΩ or higher was used. All other chemicals were purchased from Sigma Aldrich (St. Louis, MO).
Sodium phosphate buffer solutions of pH 6.5 with an ionic strength of 50 mM were prepared by dissolving 4.434 g of sodium phosphate monobasic monohydrate and 3.186 g of sodium phosphate dibasic dihydrate in 1 L of water.
Methods
Experimental Section
Amorphous Solubility Determination
Ultraviolet (UV) Spectroscopy: Drug stock solutions of 10 mg/mL for ATZ and 5 mg/mL for LPV and CTZ were prepared in DMSO. Aqueous buffer solutions with 100 μg/mL predissolved HPMCAS were preheated at 37 °C prior to experiments except for LPV at 25 °C. To continually titrate the drug stock solution to the aqueous solution, a syringe pump (Harvard Apparatus, Holliston, MA) was used. Stock solutions containing the drug were titrated in the aqueous buffer solution with flow rates ranging from 5 to 40 μL/min for different drugs, and the mixture was stirred at 300 rpm. A UV/vis spectrometer (SI Photonics, Tucson, AZ) equipped with fiber-optic dip probes was used to monitor changes in light scattering. The inflection point of UV absorbance at a nonabsorbing wavelength (300 to 350 nm, depending on the drug) was considered as the amorphous solubility of the drug, which indicates the formation of small light scattering particles (amorphous drug aggregates).19,47 Drug concentrations were calculated using a wavelength with maximum UV absorption using a calibration curve covering the concentration ranges of 0–80 μg/mL for ATZ, 0–25 μg/mL for LPV, and 1–20 μg/mL for CTZ. Triplicate experiments were conducted.
Fluorescence spectroscopy: A fluorescent dye pyrene was added to 50 mM pH 6.5 phosphate buffer to a final concentration of 1 μM. A small amount of the drug stock solution was added into 2 mL of aqueous buffer with 100 μg/mL predissolved HPMCAS. Fluorescence spectra of the resultant mixture were measured using a Tecan Safire I-BABC plate reader (Tecan, Männedorf, Switzerland) using an excitation wavelength of 332 nm. The inflection point where the ratio of the third (λ = 383–386 nm) and the first (λ = 373–375 nm) peaks in the emission spectra increased, was considered to be the amorphous solubility of the drug, which is the onset concentration of liquid–liquid phase separation where pyrene partitions in drug-rich aggregates.48 All experiments were conducted in triplicate at 37 °C except for lopinavir at 25 °C.
Ultracentrifugation: Different amounts of drug stock solutions were added to 10 mL of the phosphate buffer containing 100 μg/mL of predissolved HPMCAS to form amorphous drug aggregates and stirred for 15 min prior to ultracentrifugation. The total amount of organic solvent added was kept below 2% (v/v). Ultracentrifugation was performed using an Optima L-100K ultracentrifuge (Beckman Coulter Inc., Brea, CA). All samples were spun at 35,000 rpm for 30 min using a TI-50 rotor. For each sample, 500 μL of the supernatant was sampled and diluted with 500 μL of the HPLC mobile phase immediately following centrifugal separation. Solution drug concentrations were then analyzed using HPLC. All experiments were performed in at least triplicate.
Wet Glass Transition Temperature (Wet Tg) Determination
The wet Tg (the Tg of amorphous drug precipitates saturated with water) of lopinavir was measured using differential scanning calorimetry (DSC Q-20 series, TA Instruments, New Castle, DE). The amorphous drug was prepared by solvent evaporation. Briefly, a total of 200 mg of the drug was weighed and dissolved in an excess of 1:1 methanol/dichloromethane solvent in a 40 mL scintillation vial. Amorphous solids were prepared directly from the scintillation vial using a rotary evaporator (BUCHI Rotavapor R-300, Essen, Germany) at 55 °C under reduced pressure. All samples were freshly prepared and kept in a vacuum oven at room temperature overnight to further remove residual solvents prior to DSC measurements. For measuring wet Tg, 5–10 mg of the dry amorphous lopinavir powder was weighed in open hermetic pans and equilibrated at 97% relative humidity (potassium sulfate saturated solution) for 48 h. Samples were then sealed with hermetic lids and analyzed using DSC. A heating ramp from 0 to 90 °C with a heating rate of 10 °C/min was used. The TA universal analysis software (TA Instruments, New Castle, DE) was used for data analysis. The onset glass transition temperature was recorded as wet Tg. Experiments were conducted in triplicate.
Flux Measurements
Franz diffusion cells (PermeGear, Hellertown, PA) with chamber volumes of 5 mL apical (donor) and 5 mL basolateral (receiver) and an orifice of 15 mm diameter were used. Donor and receiver compartments were separated by a mesh screen and stirred individually, similar to the experimental setup reported by Stewart et al.49 A sodium phosphate buffer solution with an ionic strength of 50 mM at pH 6.5 with 100 μg/mL of the predissolved HPMCAS as a stabilizer (assay buffer) was added to the donor chamber. A receiver buffer composed of 5 mL of 50 mM phosphate buffer solution at pH 6.5 with or without 3% (w/v) BSA was added to the receiver chamber. A hydrophilic polyvinylidene fluoride (PVDF) membrane (0.45 μm pore size, 25 mm diameter) purchased from MilliporeSigma (Burlington, MA) was used as a filter support, and 150 μL of 15% (w/v) soy lecithin dissolved in dodecane was impregnated onto the membrane to form a lipophilic permeation barrier. The concentration and amount of lecithin added were optimized to be the minimal amount of lipids needed to completely cover filter pores with a Lucifer Yellow leakage of equal to or less than 1% after 3 h (data not shown). The ″back diffusion″ of BSA was confirmed to be negligible, with less than 17 μg/mL (0.05% of the originally added amount) BSA present in the donor solution after 3 h (Table S1, Supporting Information).
Franz cells with buffer solutions were equilibrated at 37 °C (atazanavir and clotrimazole) or 25 °C (lopinavir) prior to permeation experiments. Diffusion experiments were then initiated by the addition of a small amount of drug DMSO stock solution to the donor chamber. The volume fraction of organic solvents introduced in aqueous buffer solutions was kept below or equal to 2% (v/v) to minimize Ostwald ripening rates due to solvent-induced solubility increase50 of the drug unless specified elsewhere. A stirring rate of 1000 rpm was used when generating amorphous drug particles unless specified elsewhere. Throughout the diffusion experiment, both donor and receiver compartments were stirred at predetermined stirring rates (150 to 1000 rpm). Aliquots of 200 μL donor solutions were withdrawn at 0 and 3 h to determine donor drug concentrations before and after the diffusion experiment. Receiver solutions of 200 μL were withdrawn at 1, 2, and 3 h. This was replenished by adding fresh buffer solutions of the same volume in the receiver compartment to maintain a constant receiver buffer volume.
To remove the BSA and excess lecithin in donor and receiver samples, 200 μL of sample solutions was mixed with 600 μL of acetonitrile, vortexed for 10 s, and then centrifuged at 16,500 rpm for 10 min using an Eppendorf 5430R centrifuge (Eppendorf, Hamburg, Germany). The supernatant was analyzed using HPLC.
The total drug content in the receiver solution was calculated taking into account the drug in the 200 μL sampling solution. The total amount of drug in the receiver was plotted as a function of time, with the amount of drug permeated in the receiver per unit time calculated from the slope of this graph as mass flow. Flux was then calculated by dividing the mass flow by the area of the orifice (round-shaped, 15 mm diameter). Each experiment was carried out at least three times.
Particle Size Determination
The initial particle size of amorphous aggregates formed in the donor chamber for diffusion experiments was measured at 37 °C (atazanavir and clotrimazole) and 25 °C (lopinavir) using a Malvern nanoZS Zetasizer (Malvern Instruments, Westborough, MA) dynamic light scattering (DLS) instrument. Experiments were performed in triplicate.
High-Performance Liquid Chromatography (HPLC)
An Agilent 1260 Infinity series HPLC (Agilent Technologies, Santa Clara, CA) equipped with an Agilent Eclipse C18 column (particle size: 4.6 μm; length: 150 mm) was used. Analyses were performed at a flow rate of 1 mL/min using an isocratic elution method. A run time of 8 min was used. All drugs were detected at 210 nm with an injection volume of 5 μL for donor samples and 100 μL for receiver samples. For atazanavir, a mobile phase of 40% acetonitrile and 60% water containing 0.1% (v/v) trifluoracetic acid was used. Calibration curves covering the concentration ranges of 10–80 and 50–400 μg/mL (5 μL injection volume) as well as 0.1–1 μg/mL (100 μL injection volume) were established. For lopinavir, a mobile phase containing 60% acetonitrile and 40% water was used, and calibration curves were established over the concentration ranges of 5–120 μg/mL (5 μL injection volume) and 0.025–5 μg/mL (100 μL injection volume). For clotrimazole, the mobile phase used consisted of 45% acetonitrile and 55% water containing 0.1% (v/v) trifluoracetic acid, and calibration curves of 0–20 and 50–400 μg/mL (5 μL injection volume) as well as 0.1–5 μg/mL (100 μL injection volume) were used. The retention time for ATZ, LPV, and CTZ was observed as 4.7, 5.3, and 5 min, respectively.
Mass Transport Modeling
Mechanistic Mass Transport Model
The kinetic model developed by Makino et al.51 (Figure S1) was used to analyze the impact of membrane asymmetry on the particle drifting effect. Calculation details and results are provided in the Supporting Information. Representative model drugs with three logP values (1, 2, and 5), four different receiver conditions [ε2=1 (control), 2, 5, and 50], and two different extents of particle drifting effect (ε1=0.5 and 0.8) were chosen to calculate receiver drug appearance kinetics. Model parameters were chosen using actual experimental conditions used in this study or parameters that give similar results to our experimental observations.
Steady-State Flux Models
At steady state, no drug accumulation occurs in any diffusion layer at any time. Therefore, when steady-state flux is achieved, there should be no change in concentration with time. However, in reality, steady-state flux cannot be achieved before equilibrium is reached in a membrane diffusion setup.31 This was also supported by the simulation results (Figure S2, Supporting Information) obtained from the mechanistic model described above.
The steady-state flux assumption was used for calculating nominal UWL thicknesses for flux prediction. However, it is worth noting that these calculated nominal UWL thickness values are not the actual UWL thicknesses, for reasons that (1) the steady-state flux assumption is not valid and (2) the initial bulk donor drug concentration C0 was used as C1 in eq S14 (Supporting Information). However, the actual C1 is a changing concentration as a function of time; for different drugs, C1 is also dependent on the membrane partition of the drug. For example, for drugs with high membrane partition (high logP), a significant amount of drug accumulates in the membrane, and therefore, drug concentrations in donor and receiver solutions become relatively low compared to drugs with low logP values (Figure S2, Supporting Information) even though starting with the same initial concentration C0. Therefore, results obtained using steady-state flux models from one drug cannot be transferred to another, and nominal UWL thicknesses obtained using steady-state flux models across different drugs cannot be compared side-by-side.
Stirring rate method: The stirring rate method was used to determine UWL thickness based on its dependence on stirring rates (eq S18). The stirring rate study was performed for atazanavir without BSA addition at concentrations below (20 and 40 μg/mL) and above the drug’s amorphous solubility (60–150 μg/mL) at 150, 300, 500, and 1000 rpm. For the atazanavir system with BSA addition in the receiver, two concentrations were tested at amorphous solubility (40 μg/mL) and above amorphous solubility (250 μg/mL) at 150, 300, 500, and 1000 rpm. For clotrimazole, diffusion experiments were carried out at 150 rpm at amorphous solubility (5 μg/mL) as well as at 60, 100, and 150 rpm with a donor drug concentration above amorphous solubility (50 μg/mL). All experiments were conducted in triplicate at 37 °C for 3 h.
Nominal UWL thicknesses were calculated using flux data obtained at different stirring rates for both the free drug and particles. Using eq S21, the best fitting α values for the free drug and amorphous aggregates of atazanavir and clotrimazole were calculated as shown in Figure S5 (Supporting Information). By substituting calculated α values in eq S19, the K value was calculated for each system as shown in Figure S6 (Supporting Information). These parameters were then used to calculate nominal UWL thickness values using eqs S20 and S22. Transmembrane flux values were subsequently calculated using calculated UWL thicknesses shown in Table 3, the diffusion coefficient for the species of interest (Table S4 in the Supporting Information), and the concentration gradient for each model compound using Fick’s first law of diffusion. Detailed equation derivations are provided in the Supporting Information.
Table 3. Calculated Nominal UWL Thicknesses Using the Stirring Rate Method.
| stirring rate (rpm) | calculated
nominal UWL thickness (μm) |
|||||
|---|---|---|---|---|---|---|
| ATZ | ATZ with BSA | CTZ with BSA | ||||
| free drug | aggregates | free drug | aggregates | free drug | aggregates | |
| 60 | 4518a | 37.8a | 1901.7a | 15.5a | 14,842a | 12.6 |
| 100 | 3058a | 25.6a | 1550.1a | 12.7a | 10,831a | 9.2 |
| 150 | 2243 | 18.8 | 1317.9 | 10.8 | 8435 | 7.1 |
| 300 | 1320 | 11.0 | 998.6 | 8.2 | 5501a | 4.6a |
| 500 | 894 | 7.5 | 814.0 | 6.7 | 4014a | 3.4a |
| 1000 | 526 | 4.4 | 616.8 | 5.1 | 2618a | 2.2a |
Experiments not performed at these conditions. Values of α and 1/K were determined (eqs S21 and S19) using 1/Papp values obtained from experimental data collected at different stirring rates, and nominal UWL thicknesses for the free drug and aggregates were then calculated using eqs 20 and 22.
Flux plateau method: The flux plateau method was used to determine UWL thickness assuming that all diffusional resistance comes from UWLs. For lipophilic membranes and poorly soluble drugs, membrane resistance is negligible compared to that from the UWLs. Here we assume that the concentration gradient in the membrane divided by the partition coefficient of the drug is negligible compared to the concentration gradient in the UWL, as membrane resistance is negligible compared to UWL resistance. Since receiver sink condition is well maintained and drug flux rate is low, we also assumed that the bulk receiver drug concentration is negligible compared to the bulk donor drug concentration. A schematic showing individual UWLs and concentration gradients is shown in Figure 2. Experimentally observed flux plateau concentrations are summarized in Table S5 in the Supporting Information. The flux plateau was calculated as an average of all maximum achievable flux values obtained at various particle concentrations. The top three flux values (plus or minus standard deviation) observed at three different particle concentrations were used as the flux plateau range, and all flux values within this range were included in flux plateau calculations. Nominal individual UWL thickness values were then calculated using experimental flux plateau values using eqs S23–S29 (Supporting Information). Detailed description and equations are provided in the Supporting Information. Transmembrane flux was then calculated using Fick’s first law of diffusion using calculated UWL thickness values shown in Table 4, diffusion coefficients summarized in Table S4 (Supporting Information), and the concentration gradient of the drug.
Figure 2.

Schematic showing individual UWLs and concentration gradients of a poorly soluble drug across a lipophilic membrane in the presence of (A) free drug only and (B) excess particles when a flux plateau is reached.
Table 4. Nominal Individual UWL Thicknesses Calculated Using the Flux Plateau Methoda.
| model drug | receiver buffer | stirring rate (rpm) | particle size (nm) | a | UWL
thickness (μm) |
||
|---|---|---|---|---|---|---|---|
| donor UWL for the free drug (hfUWLd) | receiver UWL for the free drug (hfUWLr) | donor UWL for particles (hpUWLd) | |||||
| atazanavir | no BSA | 150b | 460 | NA | NA | NA | NA |
| 300 | 460 | 0.80 | 1471.7 | 365.8 | 4.8 | ||
| 500 | 460 | 0.78 | 994.7 | 282.1 | 3.7 | ||
| 1000 | 460 | 0.81 | 999.0 | 240.3 | 4.4 | ||
| 3% BSA in receiver | 150 | 460 | 0.72 | 892.6 | 339.6 | 9.0 | |
| 300 | 460 | 0.73 | 562.1 | 209.0 | 5.9 | ||
| 300 | 193 | 0.74 | 524.6 | 187.2 | 6.5 | ||
| clotrimazole | 3% BSA in receiver | 150 | 276 | 0.97 | 1937.6 | 54.7 | 7.5 |
| lopinavir | 3% BSA in receiver | 300 | 254 | 0.74 | 1132.3 | 165.4 | 23.8 |
| 300 | 454 | NA | 1132.3c | 165.4c | 19.8d | ||
| 300 | 839 | NA | 1132.3c | 165.4c | 13.5d | ||
Here, p and f describe drug in the particle and free drug form; d and r denote donor and receiver, respectively; a is the UWL asymmetry coefficient; and hUWL is the UWL thickness. NA: not applicable.
Flux plateau not clear due to the low diffusional flux and high experimental error.
hfUWL was assumed to remain the same as the LPV 254 nm system since the same stirring rate was used.
Results
Physicochemical Properties of Model Drugs
Atazanavir, lopinavir, and clotrimazole have low crystallization propensities in aqueous solutions.19,45,52 No crystallization event was observed within the time duration and drug concentrations used for diffusion experiments in this study as confirmed by polarized light microscopy (data not shown). The physicochemical properties of atazanavir, lopinavir, and clotrimazole are summarized in Table 1.
Table 1. Physicochemical Properties of Model Compounds.
| model drug | atazanavir | lopinavir | clotrimazole |
|---|---|---|---|
| molecular weight | 704.8 | 628.8 | 344.8 |
| pKa | 4.52,45 basic | not dissociated at physiological pHs | 5.89,45 basic |
| logP | 5.253 | 5.954 | 6.155 |
| Tgs (°C, dry and wet) | 104,45 5145 | 69,46 42.2 ± 1.8 | 28,45 NAa |
| amorphous solubility in 50 mM pH 6.5 phosphate buffer w/ 100 μg/mL HPMCAS (μg/mL) | 37.7 ± 3.2 (ultracentrifugation) | 19.3 ± 2.0 (ultracentrifugation) | 7.7 ± 0.3 (ultracentrifugation) |
| 36.7 ± 4.9 (UV) | 15.4 ± 1.9 (UV) | 3.5 ± 0.9 (UV) | |
| 43.3 ± 11.5 (fluorescence) | 17.0 ± 0.0 (fluorescence) | 4.0 ± 1.0 (fluorescence) |
NA: not available.
Atazanavir and clotrimazole are weak bases, with reported pKa values of 4.52 and 5.89, respectively.45,56 Lopinavir is a neutral drug that is not expected to dissociate within physiological pH ranges. Therefore, all three compounds are largely unionized at pH 6.5. Atazanavir, lopinavir, and clotrimazole have glass transition temperatures (Tgs) of 104, 69, and 28 °C, respectively.45,46,57 When precipitated out in the solution in the form of amorphous drug aggregates, the drug precipitates are saturated with water and thus have suppressed Tgs. The Tg of water saturated amorphous precipitates (wet Tg) of atazanavir was reported to be 51 °C.45 For lopinavir, the wet Tg was experimentally determined to be 42 °C. Due to the plasticization effect of water, the wet Tg of clotrimazole is expected to be below 28 °C. Therefore, in aqueous buffer solutions at 37 °C, atazanavir is expected to precipitate as a glass, whereas clotrimazole is expected to precipitate as a supercooled liquid. Atazanavir and clotrimazole particles remained at a constant size at 37 °C throughout the 3 h diffusion experiments (Figures S9 and S11, Supporting Information). For lopinavir, experiments were carried out at 25 °C to obtain glassy precipitates to maintain particle stability (Figure S10, Supporting Information). Among all three model drugs, clotrimazole is the most lipophilic drug with the highest octanol–water partition coefficient and lowest aqueous solubility. The amorphous solubility values of atazanavir, lopinavir, and clotrimazole in 50 mM pH 6.5 phosphate buffer with 100 μg/mL predissolved stabilizer HPMCAS were determined to be 36.7–43.3, 15.4–19.3, and 3.5–7.7 μg/mL, respectively (Table 1).
Extent of the Particle Drifting Effect
Receiver Appearance Kinetics
To determine the time frame within which linear receiver drug appearance kinetics can be established and maintained, receiver drug concentration was determined in the absence and presence of amorphous drug aggregates as a function of time. Atazanavir was used as a model compound due to its high amorphous solubility, enabling flux measurements at donor drug concentrations below amorphous solubility where receiver concentrations are low. Results are shown in Figure 3.
Figure 3.

Receiver appearance kinetics of atazanavir at donor concentrations of (A) 40 μg/mL and (B) 400 μg/mL (dots: experimental data; lines: linear regression).
In both the absence and presence of amorphous drug aggregates, there was a linear increase in receiver drug concentration with time, with a lag period observed at the beginning of the diffusion experiment. Linear receiver appearance kinetics was achieved after about 30 min, for a duration up to 3 h (40 μg/mL) or longer (400 μg/mL). The time lag was determined by linear regression to be 36.5 and 38.7 min, respectively. Such a lag time in the receiver phase is expected when the partition of the drug in the membrane is high.58 Therefore, in further experiments, receiver drug concentrations obtained from 1 to 3 h were used to calculate flux.
As shown in Figure 3B, receiver atazanavir concentrations were significantly higher in the presence of amorphous drug aggregates compared to those without amorphous aggregates. At the third hour, the receiver concentration for the system with 400 μg/mL drug in the donor (above amorphous solubility) was almost 5-fold relative to that of the 40 μg/mL system (at amorphous solubility). Clearly, the formation of amorphous drug aggregates contributed significantly to the passive permeation of the drug across the membrane.
Impact of Stirring Rate
Since the thickness of UWL is dependent on solution hydrodynamics, to confirm the particle drifting effect where the UWL plays a critical role, the diffusion flux of atazanavir was measured at several stirring rates. Results are summarized in Figure 4.
Figure 4.

Impact of stirring rate on the diffusion flux of atazanavir at (A) 150 rpm, (B) 300 rpm, (C) 500 rpm, and (D) 1000 rpm.
Increasing stirring rates promoted atazanavir permeation
at concentrations
both below and above amorphous solubility. At amorphous solubility
(∼40 μg/mL), transmembrane flux increased from 0.048
± 0.012 μg/(min·cm2) at 300 rpm to 0.070
± 0.008 μg/(min·cm2) at 500 rpm and to
0.072 ± 0.019 μg/(min·cm2) at 1000 rpm.
A high experimental error was observed at 150 rpm at this concentration.
Flux at ∼20 μg/mL showed an increase from 0.023 ±
0.003 μg/(min·cm2) at 150 rpm to 0.030 ±
0.003 μg/(min·cm2) at 300 rpm and to 0.041 ±
0.005 μg/(min·cm2) at 500 rpm. Moreover, flux
enhancement by drug aggregates increased with increasing stirring
rate as shown in the arrowed regions. This is attributed to a decrease
in diffusional resistance resulting from reduced UWL thickness, and
confirms that the particle drifting effect occurs in the UWL. However,
flux enhancement by particles relative to that of the free drug remained
constant at different stirring rates when other conditions were kept
the same (Figure S13, Supporting Information).
This is because stirring rate alters UWL thickness for both the free
drug and particles. As described by eq S18, the particle drifting
effect  (
( , where ν is the stirring speed in
RPM, α is the stirring exponent representing solution hydrodynamics,
and p and f denote particle and free drug, respectively) is only dependent
on the constant K, which is a constant incorporating
the aqueous diffusivity of the free drug and particles, kinematic
viscosity of the buffer solution, as well as geometric factors of
the diffusion cell, and is independent of the stirring rate.
, where ν is the stirring speed in
RPM, α is the stirring exponent representing solution hydrodynamics,
and p and f denote particle and free drug, respectively) is only dependent
on the constant K, which is a constant incorporating
the aqueous diffusivity of the free drug and particles, kinematic
viscosity of the buffer solution, as well as geometric factors of
the diffusion cell, and is independent of the stirring rate.
At a donor concentration of about 150 μg/mL (above amorphous solubility), a plateau was observed at stirring rates equal to or higher than 300 rpm, and the transmembrane flux remained constant even if donor drug concentration increased further. Due to the high UWL diffusional resistance at the lowest stirring rate used (150 rpm), high experimental errors were observed in atazanavir flux, and no clear flux plateau concentration was observed.
Impact of Receiver Buffer Composition
To facilitate transmembrane flux, we added 3% bovine serum albumin (BSA) in the receiver buffer solution to create a higher solubilization capacity for lipophilic drugs.59 Although it is well established that good sink conditions are needed on the receiver side to facilitate drug diffusion, the impact of receiver sink on the extent of particle drifting effect remains unknown. We used atazanavir and lopinavir as two model drugs with sufficient amorphous solubility enabling flux measurement in the free drug region. To reduce UWL resistance and experimental error, lopinavir experiments were carried out at 300 rpm. Results are summarized in Figures 5 and 6 and Table S6 in the Supporting Information.
Figure 5.

The impact of receiver condition on the diffusion flux of (A, B) atazanavir at 150 rpm and 300 rpm and (C) lopinavir at 300 rpm.
Figure 6.

Impact of receiver BSA addition on (A) solubility and (B) the extent of particle drifting effect.
As shown in Table S6 in the Supporting Information, lopinavir showed a higher fold increase in permeability (15.7- and 5.3-fold increase for the free drug and particles, respectively) by BSA addition in the receiver compared to atazanavir (2.5- and 0.9-fold for the free drug and particles), although both drugs have a similar fold increase in solubility in the presence of 3% BSA (3.4-fold increase for atazanavir and 3.8-fold increase for lopinavir). This is possibly because lopinavir is more hydrophobic than atazanavir, and the presence of BSA was able to reduce lopinavir partition in the membrane and increase the receiver drug concentration to a greater extent. As shown in Figure 6, at a stirring rate of 300 rpm, BSA addition decreased the extent of particle drifting effect for both atazanavir and lopinavir, whereas at 150 rpm, flux enhancements by the particle drifting effect were similar for atazanavir with and without BSA.
Given the high experimental errors obtained (Figure 5A) as well as contradicting results seen at different stirring rates for atazanavir, we performed mass transport simulations using the Makino model51,60 to assess the impact of different receiver solubilization capacity on the particle drifting effect. The results are shown in Figure 7 and Figure S3 (Supporting Information). In the original model, ε1 and ε2 were introduced as constants describing changes in the partitioning rate constant of the drug between the membrane phase and the donor and receiver solution phases. Here we used ε1 and ε2 to describe the reduction in the unstirred water layer thickness (see the Supporting Information for the relationship between mass transfer coefficient and UWL), and thus, different ε1 values can represent different extents of the particle drifting effect caused by factors such as various particle sizes, and ε2 can possibly represent different solubilization capacities of the receiver solution. Larger ε values correspond to faster mass transport rates. Therefore, larger ε1 values are associated with smaller particles, and larger ε2 values represent higher receiver sink conditions. In all scenarios simulated, the extent of the particle drifting effect, Pappp/Pappf, decreased with increasing ε2 values, suggesting that the particle drifting effect is reduced by increasing receiver solubilization capacity. This is consistent with our experimental observations with atazanavir and lopinavir at 300 rpm (Figure 6B).
Figure 7.

Impact of receiver mass transport rate on the simulated extent of particle drifting effect. [Papp is the apparent permeability coefficient; p and f denote particle and free drug, respectively. See the Supporting Information for detailed calculations.]
Impact of Particle Size
In the UWL, mass transfer of the free drug occurs though diffusion, whereas for colloidal drug particles, their movements follow Brownian motion. Both diffusion and Brownian motion can be described by Fick’s first law of diffusion. Therefore, the diffusion coefficient of the moving species, either the free drug or drug particles, plays an important role in the mass transport rate.
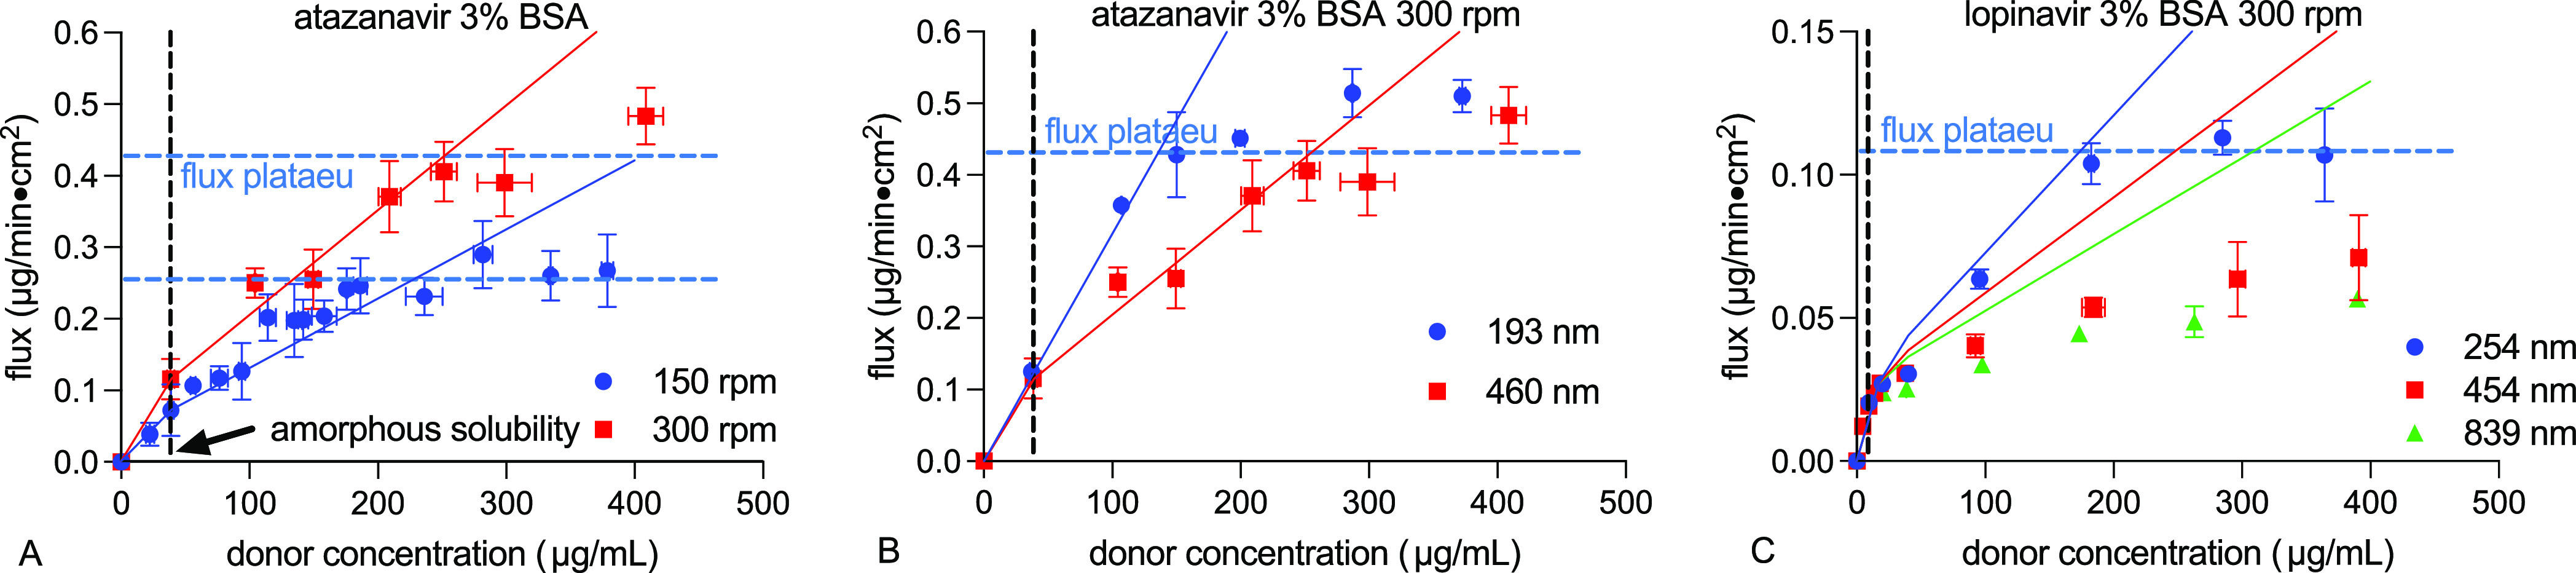
To determine the impact of particle diffusion coefficient, we prepared monodispersed amorphous drug aggregates of different particle sizes61 and measured their transmembrane flux. Atazanavir and lopinavir were used as two model drugs with sufficiently high amorphous solubility, enabling flux measurements at amorphous solubility where no particles are present (control). Also, glassy particles formed from these two drugs remained stable within the 3 h duration of diffusion experiments even with a high solvent concentration (Figures S9, S10, and S12, Supporting Information). All diffusion experiments were carried out at 300 rpm to facilitate transmembrane flux. Experimental conditions and results are summarized in Table 2 and Figure 8.
Table 2. Summary of Experimental Conditions Used to Modulate Particle Size and Results Obtained.
| drug | experimental conditions used to generate particlesa | results |
|||
|---|---|---|---|---|---|
| Z-average (nm) | diffusion coefficient Dp (×10–8 cm2/s) | permeability (×10–6 cm/s, free drug, Pappf) | permeability (×10–6 cm/s, particles, Pappp) | ||
| ATZ | drug stock solution 5 mg/mL, 1000 rpm, 37 °C | 193 ± 4 | 3.43 ± 0.07 | 56.0 ± 2.0 | 47.7 ± 2.8 |
| drug stock solution 20 mg/mL, 1000 rpm, 37 °C | 460 ± 23 | 1.44 ± 0.07 | 51.7 ± 8.1 | 22.9 ± 1.3 | |
| LPV | drug stock solution 5 mg/mL, 1000 rpm, 25 °C | 254 ± 3 | 1.94 ± 0.00 | 25.1 ± 3.6 | 7.9 ± 0.2 |
| drug stock solution 12 mg/mL, 300 rpm, 25 °C | 454 ± 10 | 1.09 ± 0.00 | 27.9 ± 2.2 | 2.1 ± 0.1 | |
| drug stock solution 20 mg/mL, 300 rpm, 25 °C | 839 ± 15 | 0.59 ± 0.01 | 19.6 ± 0.1 | 1.6 ± 0.1 | |
At typical experimental conditions, where mixing is moderate and stabilizers are in excess (particle size being independent of stabilizer concentration), the final particle size depends mainly on the mixing time and coalescence time, with the latter determined by the initial solute mass concentration.61
Figure 8.

Impact of particle size on the transmembrane flux of (A) atazanavir (300 rpm, 37 °C, 3% BSA) and (B) lopinavir (300 rpm, 25 °C, 3% BSA).
As shown in Figure 8, both drugs with smaller particles showed higher flux enhancements above amorphous solubility. The extent of the particle drifting effect increased with increasing diffusion coefficient. Because smaller particles have larger diffusion coefficients than larger particles, smaller particles move at faster rates, allowing more drug to be delivered at the membrane surface. As only the free drug was present below amorphous solubility, flux in the free drug region remained the same.
According to eqs S18 and S22, the ratio of UWL thicknesses hUWL for two different species is independent of apparatus geometry or solution hydrodynamics and is only a function of the aqueous diffusivity of the species and the kinematic viscosity of the solution [K is a constant incorporating the aqueous diffusivity D of the solute (to the power of 2/3), kinematic viscosity η (to the power of −1/6), and geometric factors of the diffusion cell]:35,62,63
| 1 |
Here p1 and p2 denote particles of two different sizes. Assuming the kinematic viscosity remained constant within the particle concentration ranges studied, for the same drug, the extent of the particle drifting effect is only dependent on particle size:
| 2 |
Using the system with
the largest particle as a reference, we then
calculated  and
and  for atazanavir and lopinavir, with results
shown in Figure 9.
For both drugs, the system with particles of around 200 and 250 nm
showed results in agreement with eq 2. Discrepancy was observed for the lopinavir 454 nm
particle system, suggesting that factors other than particle size
and solution kinematic viscosity are also involved in the particle
drifting effect.
for atazanavir and lopinavir, with results
shown in Figure 9.
For both drugs, the system with particles of around 200 and 250 nm
showed results in agreement with eq 2. Discrepancy was observed for the lopinavir 454 nm
particle system, suggesting that factors other than particle size
and solution kinematic viscosity are also involved in the particle
drifting effect.
Figure 9.

Impact of particle size on the particle drifting effect.
Mass Transport Mechanisms
The UWL is a part of the aqueous solution with no physical boundary separating the bulk solution and the aqueous boundary layer. Therefore, particles and free drug move freely from the bulk solution to the UWL without having to cross an interface. Once the drug particle reaches the vicinity of the membrane–UWL interface, drug molecules from amorphous aggregates may be incorporated into the membrane through two possible mechanisms: (1) dissolution of the drug particle occurs in the UWL, and mass transport from the UWL to the membrane occurs only through the molecularly dissolved drug present in the aqueous environment in equilibrium with the drug particle; or (2) the drug particle moves through the UWL intact and partitions into the membrane through a direct interaction. If mechanism 1 is valid, then we expect to observe a flux plateau when particle concentration increases to a certain level, where the aqueous environment is saturated with the free drug (reaching amorphous solubility) supplied by these amorphous particles. If mechanism 2 is valid, then transmembrane flux will continue to increase linearly with increasing particle concentration. Mechanism 1 was previously reported in bile micelle systems34 and was quantitatively demonstrated in systems containing amorphous drug particles.33 In this study, we conducted diffusion experiments using clotrimazole as a model drug, which has a low amorphous solubility and provides a large concentration window of particle formation, to allow direct visualization of the flux plateau.
As shown in Figure 10, a flux plateau was observed at bulk clotrimazole concentrations of around 150 μg/mL, well above the drug’s amorphous solubility. At higher particle concentrations, particles continue moving into the donor UWL, and therefore, mass transfer at the UWL–membrane interface is presumably the rate-limiting step. These results confirmed that the mass transfer of drug particles at the UWL–membrane interface occurs only through the molecularly dissolved drug (mechanism 1). Similar flux plateaus were also observed in atazanavir and lopinavir systems without and with BSA at different stirring rates (Figures 4, 5, and 8). These experimentally observed flux plateau concentrations are summarized in Table S5 in the Supporting Information.
Figure 10.

Experimentally observed flux plateau at high clotrimazole particle concentrations (150 rpm, 37 °C, 3% BSA).
It appears that the stirring rate did not affect the donor drug concentration where flux plateau was reached. Smaller particles saturated the UWL quicker due to higher Brownian motion rates and resulted in lower flux plateau concentrations compared to larger particles (Table S5 in the Supporting Information and Figure 8). BSA addition increased the flux plateau concentration (Figure 5 and Table S5 in the Supporting Information). This is because the extent of the particle drifting effect decreased with BSA addition (Figures 6 and 7), resulting from the improved mass transport and decreased membrane–UWL partition of the drug. The maximum achievable flux increased with increasing stirring rates and with BSA addition. This can be viewed as a result of the reduced UWL thickness and total diffusional resistance. Particles of different sizes did not impact the maximum achievable flux (flux plateaus were not achieved for lopinavir 454 and 839 nm particle systems within the concentration range studied). This is because the receiver side UWL remained constant at the same experimental conditions (hydrodynamics and receiver buffer) used. The maximum achievable flux is only dependent on the maximum achievable drug concentration (amorphous solubility) in the donor UWL at the UWL–membrane interface if the diffusional resistance from the membrane and receiver UWL remains identical (Figure 2B).
Modeling the Particle Drifting Effect
Stirring Rate Method
The stirring rate method is based on the stirring rate dependence of UWL thickness described by eq S1835,64 (PUWL = Kνα). Using the stirring rate method, we calculated nominal UWL thicknesses for each model drug. Results are summarized in Table 3. As we experienced complications using the stirring rate method, such as membrane leakage at high stirring rates and undetectable receiver drug concentrations at low stirring rates, different stirring rates were used for different drugs. As a result, values marked with superscript a shown in Table 3 were extrapolated using eqs S18 and S22 using experimental data obtained at other stirring rates.
Our calculations suggested that the nominal thickness of the UWL was reduced in the presence of drug aggregates relative to when only the free drug is present because the colloids act as carriers across the UWL and lead to reduced diffusional resistance. These results are in agreement with the UWL reduction hypothesis proposed by Sugano et al.32, that the particle drifting effect leads to a reduced thickness of the UWL on the donor side of the membrane. Also, for both drugs, the addition of BSA in the receiver buffer reduced the total UWL thicknesses for both the free drug and amorphous aggregates. This is because the addition of BSA in the receiver increased mass transport rate from the membrane to the bulk receiver buffer, and this would translate to a thinner UWL on the receiver side. For clotrimazole free drug, larger nominal UWL thicknesses were obtained compared to atazanavir free drug. This is attributed to the high lipophilicity of clotrimazole, leading to high membrane accumulation, low donor drug concentration, and subsequent low overall flux, and does not reflect the actual UWL thickness in the solution. Calculated nominal UWL thicknesses for drug particles were similar for both drugs at the same experimental condition possibly because the nominal UWL thickness for particles is dominated by particle size and is less affected by the membrane partition coefficient of the drug.
These nominal UWL thickness values were then used to calculate flux using Fick’s law of diffusion, with results shown in Figure 11 and Figure S7 in the Supporting Information. Good agreements were obtained for most systems evaluated, confirming the stirring rate dependency of the UWLs.
Figure 11.

Representative particle drifting effect predictions using the stirring rate method: (A) atazanavir with and without BSA and (B) clotrimazole.
Flux Plateau Method
We also used the flux plateau method to calculate nominal UWL thicknesses, with results shown in Table 4.
Using this method, we were able to assess the symmetry of UWLs on the donor and receiver sides of the membrane. Clearly, for the vertical Franz cell setup used in this study, solution hydrodynamics are highly asymmetric, with a thicker UWL on the donor side. This is possibly because of the mesh screen used to separate the membrane and the magnetic stir bar on the donor side of the membrane, which created an additional resistance layer of water on the donor side. The UWL asymmetry coefficient a was independent of stirring rate and remained the same for the same drug measured with identical receiver solutions. This is because changing the stirring rate alters the UWL thickness on both sides of the membrane simultaneously without affecting the proportion of each UWL. BSA addition in the receiver decreased the UWL asymmetry coefficient a for atazanavir. This is because changing the solubilization capacity of the receiver solution altered the UWL on the receiver side and the membrane partition of the drug, leading to altered UWL asymmetry. The presence of particles also led to a significant reduction in UWL thickness, consistent with results obtained using the stirring rate method.
For atazanavir particles of 460 and 193 nm, calculated
free drug
UWL thicknesses are very similar, confirming that UWL thickness with
respect to the free drug is not dependent on particle properties.
Therefore, the same UWL values obtained from lopinavir 254 nm particles
were used for other lopinavir particle systems to calculate the flux
plateau concentration and to predict flux. For atazanavir,  was calculated to be 1.1, with a
  value of 1.36, in close agreement with eq 1. For simplicity, we assumed
that the particle size dependent UWL thickness follows eq 1 and then calculated hpUWLd for lopinavir systems with 454 and 839 nm particles.
Transmembrane flux was then calculated using Fick’s first law
of diffusion with results shown in Figure 12 and Figure S8 in the Supporting Information. Excellent agreements between calculated
and experimental values were obtained for most systems using the flux
plateau method, with the only exception of lopinavir 454 and 839 nm
particle systems. Further investigations are needed to understand
other factors aside from diffusion coefficient and kinematic viscosity
involved in the particle drifting effect, as well as their impact
on UWL thickness.
value of 1.36, in close agreement with eq 1. For simplicity, we assumed
that the particle size dependent UWL thickness follows eq 1 and then calculated hpUWLd for lopinavir systems with 454 and 839 nm particles.
Transmembrane flux was then calculated using Fick’s first law
of diffusion with results shown in Figure 12 and Figure S8 in the Supporting Information. Excellent agreements between calculated
and experimental values were obtained for most systems using the flux
plateau method, with the only exception of lopinavir 454 and 839 nm
particle systems. Further investigations are needed to understand
other factors aside from diffusion coefficient and kinematic viscosity
involved in the particle drifting effect, as well as their impact
on UWL thickness.
Figure 12.
Representative particle drifting effect predictions using the flux plateau method: (A) atazanavir with and without BSA, (B) atazanavir different particle sizes, and (C) lopinavir different particle sizes.
Discussion
The Unstirred Water Layer
Mass Transport Significance
The unstirred water layer forms due to friction between water and the surface of a solid. Solute concentration is constant in the bulk solution, whereas in the immediate vicinity of the surface, solute concentration rapidly changes within the boundary layer. The thickness of the diffusion boundary layer h was solved by Levich under ideal rotating-disk conditions using convective diffusion equations:62
| 3 |
where ω is the angular velocity of the rotating disk.
In the Levich model, solute concentration was assumed to be a function of the distance from the disk surface and is independent of the distance from the rotating axis. Since the mathematical treatment and boundary conditions are similar to stagnant point flow, the convective diffusion model also applies in the case of membrane permeation.62
In steady-state flux models, the aqueous diffusion layer is assumed to be a stagnant layer where mass transfer occurs only through diffusion, and the concentration gradient across the stagnant water layer is assumed to be linear. However, since both convection and diffusion are accounted for in the Levich equation, instead of a stagnant layer of water, the diffusional boundary layer is more appropriately described as a dynamic convective diffusion layer where solute concentration gradient is the maximum. Within the diffusion boundary layer, both diffusion and convection (in the tangential direction) are important mass transport mechanisms. The thickness of the boundary layer is a function of not only the diffusion coefficient and kinematic viscosity but also the velocity of the solution. This is also the theoretical basis of using the stirring method to determine the UWL thickness.
The Particle Drifting Effect
Since the thickness of the diffusion boundary layer is dependent on the diffusion coefficient, every species moving in the UWL, with its own diffusion coefficient, will have its own corresponding diffusion boundary layer. If multiple species are present in the same system and moving across the UWL at the same time, several boundary layers with different thicknesses can exist simultaneously,62 with their ratio described by eq 1. If solution kinematic viscosity was kept the same, then the UWL thickness ratio is only dependent on diffusion coefficients. Thus, understanding the impact of various colloid sizes on UWL thickness in vitro will help us to understand the particle drifting effect in vivo. It may be difficult to pick the ″right″ individual UWL thickness for a model as the UWL thickness in vivo varies across species, individuals, and even within the same individual at different parts of the GI tract. Nevertheless, understanding the contribution of particles relative to that of the free drug to permeation rates is useful for parameterizing models.
High receiver sink conditions reduce the thickness of the UWL on the receiver side of the membrane, leading to reduced diffusional resistance and less significant particle drifting effect. Using the steady-state flux assumption, the relationship between UWL thickness and particle drifting effect can be described by:
| 4 |
Here, only hfUWLr is affected by receiver sink condition, and we assume that the rest remain constant for the same system. Therefore, the extent of the particle drifting effect is a linear function of the receiver UWL thickness and reaches the maximum when receiver UWL reduction is absent. Assuming a donor UWL thickness for the free drug of 300 μm and a UWL thickness for particles of 10 μm, using diffusion coefficients obtained for the atazanavir 460 nm particle system, we obtain the following linear relationship shown in Figure 13. Similar linear relationships were also obtained in simulated data using the Makino model (Figure S14, Supporting Information).
Figure 13.

Impact of receiver UWL thickness on the particle drifting effect.
As high receiver sink conditions are maintained in vivo, the particle drifting effect is expected to be reduced. Future studies are needed to determine the particle drifting effect and UWL thicknesses in vivo, thus allowing better model parameterization and more accurate bioavailability predictions.
Comparison of Different Models
A large amount of donor appearance, membrane accumulation, and receiver disappearance kinetics data is required to resolve multiple parameters in mechanistic mass transport models. This may be hard to achieve experimentally and is labor intensive. Although the steady-state flux assumption is not valid in a membrane diffusion setup, the simplicity and small amount of data required for model validation and prediction make steady-state flux models useful and convenient tools to understand the particle drifting effect quantitatively.
Comparing the two steady-state flux models used to determine UWL thicknesses, the flux plateau method requires less data to be collected, whereas the stirring rate method requires diffusion experiments at multiple stirring rates. Furthermore, it would be difficult to change hydrodynamic conditions in vivo to measure UWL thickness. Therefore, the flux plateau method appears to be a simple and reliable approach to determine nominal UWL thickness and the particle drifting effect in vitro and in vivo.
Since membrane drug accumulation
was not accounted for in these
steady-state flux models, the nominal UWL thickness obtained from
these models also reflects a membrane partition component. Instead
of eq 3, the nominal
UWL thickness calculated using the steady-state flux assumption is
described by eq S18, with K and α values varying
with different drugs, receiver buffer compositions, and geometric
factors. Since hydrodynamic conditions remain identical when the free
drug and particles are both present and simultaneously move across
the UWL, the extent of particle drifting effect is only dependent
on K values ( ). The ratio of K values
is dependent on intrinsic properties of the formulation such as logP
and diffusion coefficients, as well as extrinsic factors including
geometric factors and sink conditions.
). The ratio of K values
is dependent on intrinsic properties of the formulation such as logP
and diffusion coefficients, as well as extrinsic factors including
geometric factors and sink conditions.
In mechanistic mass transport models, extrinsic factors such as geometry and receiver sink conditions are already incorporated in the model, and thus, the mass transfer coefficient is only dependent on intrinsic properties of the formulation. Therefore, the impact of intrinsic and extrinsic factors on the particle drifting effect can be separated by using mechanistic mass transport models. It will also enable the prediction of the particle drifting effect using steady-state flux models by using appropriate scaling parameters to calibrate the impact of extrinsic factors. This is clearly a direction that warrants future investigation.
Implications to the Pharmaceutical Industry
The use of colloidal particles, including nanocrystals,25 amorphous drug aggregates,16,26,66 as well as surfactant and bile salt micelles,34−36 is drawing increasing attention in the pharmaceutical industry due to their associated effective permeability and bioavailability enhancements. However, unpredictable absorption37 and nonlinear pharmacokinetics16 often observed in these formulations have greatly limited their wide use. Understanding key factors affecting the particle drifting effect in vitro is likely essential to help us to predict absorption enhancement by particles more accurately in vivo. For example, if the flux plateau is reached, then neither increasing the dose nor reducing particle size will promote absorption. Also, since the extent of particle drifting effect is impacted by extrinsic factors such as receiver sink and geometric conditions, which may be very different in vivo, it would be critical to choose appropriate in vitro conditions to make accurate predictions.
The particle drifting effect can provide significant bioavailability enhancements in vivo. For example, the current marketed formulation of aprepitant is a nanocrystalline suspension, which provided approximately 2-fold bioavailability increase in healthy men compared to an earlier tablet formulation containing micronized crystalline particles.67 Currently, there are limited literature bioavailability data available on the particle drifting effect,16,25,26,66−70 and the degree of bioavailability enhancements varied for different drugs and formulations used. In this current in vitro investigation, significant flux enhancements were observed for all model drugs within relatively low particle concentrations, and the particle drifting effect appeared to be the most significant for clotrimazole, which had the lowest aqueous solubility among all model drugs used. Therefore, the use of drug nanoparticles, both crystalline and amorphous, appears to be an effective strategy to improve permeability and bioavailability especially for extremely poorly soluble drugs. However, the extent of particle drifting effect depends on multiple factors, and further investigations are needed to understand this phenomenon more quantitatively both in vitro and in vivo to aid in formulation design.
Understanding the particle drifting effect may also benefit food effect prediction of poorly soluble drugs. Food intake alters various physiological conditions such as gastric emptying time, bile secretion, hepatic blood flow, gastric pH, and fluid volume,71 as well as physicochemical properties of the formulation such as increases in aqueous solubility72 and dissolution rates.73 Following carefully designed physiologically based pharmacokinetic modeling protocols, accurate predictions are typically obtained for cases where physiological factors dominated the mechanisms of food effect, whereas food effect related to food-formulation interactions was generally predicted with low accuracy.74 Considering the large number of bile salt and fatty acid mixed micelles formed during digestion, these mixed micelles may also contribute to enhanced drug absorption through the particle drifting effect in addition to enhanced solubilization of the drug. Clearly, the particle drifting effect is an important mechanism that has not been considered in food effect predictions, and further investigations in this area are needed.
Conclusions
The extent of particle drifting effect in vitro was found to be dependent on particle size, the particle concentration at which flux is saturated, drug properties, as well as receiver sink conditions and independent of solution hydrodynamics. Steady-state flux models were used to calculate flux enhancement by amorphous drug particles, with good agreements obtained for different drugs at different experimental conditions. Our calculations also confirmed reduced UWL thickness by particles. Results obtained from this study could explain, at least in part, nonlinear pharmacokinetics observed in oral formulations due to the formation of colloidal drug particles or the occurrence of the flux plateau. These results confirmed that forming nanosized drug particles is a highly effective strategy to promote membrane permeation beyond the aqueous solubility of the drug, especially for drugs with high hydrophobicity. The combined experimental and modeling approach used in this study serves as a useful and widely applicable in vitro tool to assess and predict enhanced passive permeation by colloidal drug particles relative to that of the free drug and may contribute to improved bioavailability prediction for oral formulations containing nanosized drug particles.
Acknowledgments
The authors gratefully thank the University of Connecticut for providing startup funds to conduct this research. We also thank Dr. Yaliang Tang and graduate student Da Hye Yang for their assistance with ultracentrifugation experiments. We thank Prof. Xiuling Lu for the use of the dynamic light scattering instrument.
Glossary
Abbreviation Used
- ASD
amorphous solid dispersions
- ATZ
atazanavir
- BSA
bovine serum albumin
- CTZ
clotrimazole
- DLS
dynamic light scattering
- DMSO
dimethyl sulfoxide
- DSC
differential scanning calorimetry
- GI
gastrointestinal
- HPLC
high-performance liquid chromatography
- HPMCAS
hydroxypropyl methylcellulose acetate succinate
- LLPS
liquid–liquid phase separation
- LPV
lopinavir
- PAMPA
parallel artificial membrane permeability assay
- PVDF
polyvinylidene fluoride
- Tg
glass transition temperature
- UWL
unstirred water layer
- UV
ultraviolet spectroscopy
Supporting Information Available
The Supporting Information is available free of charge at https://pubs.acs.org/doi/10.1021/acs.molpharmaceut.2c00124.
BSA ″back diffusion″ determination (Table S1); mechanistic mass transport model (Figures S1–S4, Tables S2 and S3); steady-state flux models (Figures S5–S8, Tables S4 and S5); relationship between mass transfer coefficient and unstirred water layer thickness; stability of amorphous particles in the solution (Figures S9–S12); impact of BSA addition on the solubility and membrane permeability of atazanavir and lopinavir (Table S6); impact of stirring rate on flux enhancement by the particle drifting effect (Figure S13); and impact of receiver UWL reduction (simulation data from the Makino model) on the particle drifting effect (Figure S14) (PDF)
Author Contributions
§ A.N. and R.S. contributed equally to this work.
The authors declare no competing financial interest.
Supplementary Material
References
- Di L.; Kerns E. H.; Carter G. T. Drug-like property concepts in pharmaceutical design. Curr. Pharm. Des. 2009, 15, 2184–2194. 10.2174/138161209788682479. [DOI] [PubMed] [Google Scholar]
- Butler J. M.; Dressman J. B. The developability classification system: Application of biopharmaceutics concepts to formulation development. J. Pharm. Sci. 2010, 99, 4940–4954. 10.1002/jps.22217. [DOI] [PubMed] [Google Scholar]
- Lipinski C. A. Drug-like properties and the causes of poor solubility and poor permeability. J. Pharmacol. Toxicol. Methods 2000, 44, 235–249. 10.1016/S1056-8719(00)00107-6. [DOI] [PubMed] [Google Scholar]
- Williams H. D.; Trevaskis N. L.; Charman S. A.; Shanker R. M.; Charman W. N.; Pouton C. W.; Porter C. J. Strategies to address low drug solubility in discovery and development. Pharmacol. Rev. 2013, 65, 315–499. 10.1124/pr.112.005660. [DOI] [PubMed] [Google Scholar]
- Serajuddin A. T. Salt formation to improve drug solubility. Adv. Drug Delivery Rev. 2007, 59, 603–616. 10.1016/j.addr.2007.05.010. [DOI] [PubMed] [Google Scholar]
- Karimi-Jafari M.; Padrela L.; Walker G. M.; Croker D. M. Creating cocrystals: A review of pharmaceutical cocrystal preparation routes and applications. Cryst. Growth Des. 2018, 18, 6370–6387. 10.1021/acs.cgd.8b00933. [DOI] [Google Scholar]
- Porter C. J. H.; Trevaskis N. L.; Charman W. N. Lipids and lipid-based formulations: Optimizing the oral delivery of lipophilic drugs. Nat. Rev. Drug Discovery 2007, 6, 231–248. 10.1038/nrd2197. [DOI] [PubMed] [Google Scholar]
- Lawrence M. J. Surfactant systems: Their use in drug delivery. Chem. Soc. Rev. 1994, 23, 417–424. 10.1039/CS9942300417. [DOI] [Google Scholar]
- Loftsson T.; Duchêne D. Cyclodextrins and their pharmaceutical applications. Int. J. Pharm. 2007, 329, 1–11. 10.1016/j.ijpharm.2006.10.044. [DOI] [PubMed] [Google Scholar]
- Schittny A.; Huwyler J.; Puchkov M. Mechanisms of increased bioavailability through amorphous solid dispersions: A review. Drug Delivery 2020, 27, 110–127. 10.1080/10717544.2019.1704940. [DOI] [PMC free article] [PubMed] [Google Scholar]
- Raina S. A.; Zhang G. G.; Alonzo D. E.; Wu J.; Zhu D.; Catron N. D.; Gao Y.; Taylor L. S. Impact of solubilizing additives on supersaturation and membrane transport of drugs. Pharm. Res. 2015, 32, 3350–3364. 10.1007/s11095-015-1712-4. [DOI] [PubMed] [Google Scholar]
- Dahan A.; Beig A.; Lindley D.; Miller J. M. The solubility-permeability interplay and oral drug formulation design: Two heads are better than one. Adv. Drug Delivery Rev. 2016, 101, 99–107. 10.1016/j.addr.2016.04.018. [DOI] [PubMed] [Google Scholar]
- Miller J. M.; Beig A.; Carr R. A.; Webster G. K.; Dahan A. The solubility–permeability interplay when using cosolvents for solubilization: Revising the way we use solubility-enabling formulations. Mol. Pharmaceutics 2012, 9, 581–590. 10.1021/mp200460u. [DOI] [PubMed] [Google Scholar]
- Almeida e Sousa L.; Reutzel-Edens S. M.; Stephenson G. A.; Taylor L. S. Supersaturation potential of salt, co-crystal, and amorphous forms of a model weak base. Cryst. Growth Des. 2016, 16, 737–748. 10.1021/acs.cgd.5b01341. [DOI] [Google Scholar]
- Yeap Y. Y.; Trevaskis N. L.; Porter C. J. The potential for drug supersaturation during intestinal processing of lipid-based formulations may be enhanced for basic drugs. Mol. Pharmaceutics 2013, 10, 2601–2615. 10.1021/mp400035z. [DOI] [PubMed] [Google Scholar]
- Kesisoglou F.; Wang M.; Galipeau K.; Harmon P.; Okoh G.; Xu W. Effect of amorphous nanoparticle size on bioavailability of anacetrapib in dogs. J. Pharm. Sci. 2019, 108, 2917–2925. 10.1016/j.xphs.2019.04.006. [DOI] [PubMed] [Google Scholar]
- Ueda K.; Taylor L. S. Polymer type impacts amorphous solubility and drug-rich phase colloidal stability: A mechanistic study using nuclear magnetic resonance spectroscopy. Mol. Pharmaceutics 2020, 17, 1352–1362. 10.1021/acs.molpharmaceut.0c00061. [DOI] [PubMed] [Google Scholar]
- Mosquera-Giraldo L. I.; Taylor L. S. Glass–liquid phase separation in highly supersaturated aqueous solutions of telaprevir. Mol. Pharmaceutics 2015, 12, 496–503. 10.1021/mp500573z. [DOI] [PubMed] [Google Scholar]
- Ilevbare G. A.; Taylor L. S. Liquid–liquid phase separation in highly supersaturated aqueous solutions of poorly water-soluble drugs: Implications for solubility enhancing formulations. Cryst. Growth Des. 2013, 13, 1497–1509. 10.1021/cg301679h. [DOI] [Google Scholar]
- Saboo S.; Mugheirbi N. A.; Zemlyanov D. Y.; Kestur U. S.; Taylor L. S. Congruent release of drug and polymer: A ″sweet spot″ in the dissolution of amorphous solid dispersions. J. Controlled Release 2019, 298, 68–82. 10.1016/j.jconrel.2019.01.039. [DOI] [PubMed] [Google Scholar]
- Indulkar A. S.; Lou X.; Zhang G. G. Z.; Taylor L. S. Insights into the dissolution mechanism of ritonavir–copovidone amorphous solid dispersions: Importance of congruent release for enhanced performance. Mol. Pharmaceutics 2019, 16, 1327–1339. 10.1021/acs.molpharmaceut.8b01261. [DOI] [PubMed] [Google Scholar]
- Sassene P. J.; Knopp M. M.; Hesselkilde J. Z.; Koradia V.; Larsen A.; Rades T.; Müllertz A. Precipitation of a poorly soluble model drug during in vitro lipolysis: Characterization and dissolution of the precipitate. J. Pharm. Sci. 2010, 99, 4982–4991. 10.1002/jps.22226. [DOI] [PubMed] [Google Scholar]
- Di L.; Artursson P.; Avdeef A.; Ecker G. F.; Faller B.; Fischer H.; Houston J. B.; Kansy M.; Kerns E. H.; Krämer S. D.; et al. Evidence-based approach to assess passive diffusion and carrier-mediated drug transport. Drug Discovery Today 2012, 17, 905–912. 10.1016/j.drudis.2012.03.015. [DOI] [PubMed] [Google Scholar]
- Higuchi T. Physical chemical analysis of percutaneous absorption process from creams and ointments. J. Soc. Cosmet. Chem. 1960, 11, 85–97. [Google Scholar]
- Imono M.; Uchiyama H.; Yoshida S.; Miyazaki S.; Tamura N.; Tsutsumimoto H.; Kadota K.; Tozuka Y. The elucidation of key factors for oral absorption enhancement of nanocrystal formulations: In vitro-in vivo correlation of nanocrystals. Eur. J. Pharm. Biopharm. 2020, 146, 84–92. 10.1016/j.ejpb.2019.12.002. [DOI] [PubMed] [Google Scholar]
- Stewart A. M.; Grass M. E.; Brodeur T. J.; Goodwin A. K.; Morgen M. M.; Friesen D. T.; Vodak D. T. Impact of drug-rich colloids of itraconazole and HPMCAS on membrane flux in vitro and oral bioavailability in rats. Mol. Pharmaceutics 2017, 14, 2437–2449. 10.1021/acs.molpharmaceut.7b00338. [DOI] [PubMed] [Google Scholar]
- Kimura S.; Kasatani S.; Tanaka M.; Araki K.; Enomura M.; Moriyama K.; Inoue D.; Furubayashi T.; Tanaka A.; Kusamori K.; et al. Importance of the direct contact of amorphous solid particles with the surface of monolayers for the transepithelial permeation of curcumin. Mol. Pharmaceutics 2016, 13, 493–499. 10.1021/acs.molpharmaceut.5b00710. [DOI] [PubMed] [Google Scholar]
- Frank K. J.; Westedt U.; Rosenblatt K. M.; Hölig P.; Rosenberg J.; Mägerlein M.; Fricker G.; Brandl M. What is the mechanism behind increased permeation rate of a poorly soluble drug from aqueous dispersions of an amorphous solid dispersion?. J. Pharm. Sci. 2014, 103, 1779–1786. 10.1002/jps.23979. [DOI] [PubMed] [Google Scholar]
- Roos C.; Dahlgren D.; Berg S.; Westergren J.; Abrahamsson B.; Tannergren C.; Sjögren E.; Lennernäs H. In vivo mechanisms of intestinal drug absorption from aprepitant nanoformulations. Mol. Pharmaceutics 2017, 14, 4233–4242. 10.1021/acs.molpharmaceut.7b00294. [DOI] [PubMed] [Google Scholar]
- Sugano K. Possible reduction of effective thickness of intestinal unstirred water layer by particle drifting effect. Int. J. Pharm. 2010, 387, 103–109. 10.1016/j.ijpharm.2009.12.014. [DOI] [PubMed] [Google Scholar]
- Cussler E. L.Diffusion: mass transfer in fluid systems; Cambridge University Press, 2012. 10.1017/CBO9780511805134. [DOI] [Google Scholar]
- Sugano K. Aqueous boundary layers related to oral absorption of a drug: from dissolution of a drug to carrier mediated transport and intestinal wall metabolism. Mol. Pharmaceutics 2010, 7, 1362–1373. 10.1021/mp1001119. [DOI] [PubMed] [Google Scholar]
- Hate S. S.; Mosquera-Giraldo L. I.; Taylor L. S. A Mechanistic Study of Drug Mass Transport from Supersaturated Solutions Across PAMPA Membranes. J. Pharm. Sci. 2022, 111, 102–115. 10.1016/j.xphs.2021.07.003. [DOI] [PubMed] [Google Scholar]
- Westergaard H.; Dietschy J. M. The mechanism whereby bile acid micelles increase the rate of fatty acid and cholesterol uptake into the intestinal mucosal cell. J. Clin. Invest. 1976, 58, 97–108. 10.1172/JCI108465. [DOI] [PMC free article] [PubMed] [Google Scholar]
- Amidon G. E.; Higuchi W. I.; Ho N. F. H. Theoretical and experimental studies of transport of micelle-solubilized solutes. J. Pharm. Sci. 1982, 71, 77–84. 10.1002/jps.2600710120. [DOI] [PubMed] [Google Scholar]
- Arce F. A.; Setiawan N.; Campbell H. R.; Lu X.; Nethercott M. J.; Bummer P.; Su Y.; Marsac P. J. Toward developing discriminating dissolution methods for formulations containing nanoparticulates in solution: The impact of particle drift and drug activity in solution. Mol. Pharmaceutics 2020, 17, 4125–4140. 10.1021/acs.molpharmaceut.0c00599. [DOI] [PubMed] [Google Scholar]
- Song B.; Bransford P.; Peresypkin A.; Medek A.; Mudunuri P.; Randles E. G.; Dworakowski W.; Kumar S.; Snyder P. W. Overcoming the bile salt-mediated formation of nanocolloids that inhibit oral absorption of VX-985. J. Pharm. Sci. 2019, 108, 821–831. 10.1016/j.xphs.2018.10.036. [DOI] [PubMed] [Google Scholar]
- Stewart A. M.; Grass M. E. Practical approach to modeling the impact of amorphous drug nanoparticles on the oral absorption of poorly soluble drugs. Mol. Pharmaceutics 2020, 17, 180–189. 10.1021/acs.molpharmaceut.9b00889. [DOI] [PubMed] [Google Scholar]
- Pohl P.; Saparov S. M.; Antonenko Y. N. The size of the unstirred layer as a function of the solute diffusion coefficient. Biophys. J. 1998, 75, 1403–1409. 10.1016/S0006-3495(98)74058-5. [DOI] [PMC free article] [PubMed] [Google Scholar]
- Andreoli T. E.; Troutman S. L. An analysis of unstirred layers in series with ″tight″ and ″porous″ lipid bilayer membranes. J. Gen. Physiol. 1971, 57, 464–478. 10.1085/jgp.57.4.464. [DOI] [PMC free article] [PubMed] [Google Scholar]
- Wedner H. J.; Diamond J. M. Contributions of unstirred-layer effects to apparent electrokinetic phenomena in the gall-bladder. J. Membr. Biol. 1969, 1, 92–108. 10.1007/BF01869776. [DOI] [PubMed] [Google Scholar]
- Dietschy J. M.; Sallee V. L.; Wilson F. A. Unstirred water layers and absorption across the intestinal mucosa. Gastroenterology 1971, 61, 932–934. 10.1016/S0016-5085(19)33408-0. [DOI] [PubMed] [Google Scholar]
- Lukie B. E.; Westergaard H.; Dietschy J. M. Validation of a chamber that allows measurement of both tissue uptake rates and unstirred layer thicknesses in the intestine under conditions of controlled stirring. Gastroenterology 1974, 67, 652–661. 10.1016/S0016-5085(19)32790-8. [DOI] [PubMed] [Google Scholar]
- Baird J. A.; Van Eerdenbrugh B.; Taylor L. S. A classification system to assess the crystallization tendency of organic molecules from undercooled melts. J. Pharm. Sci. 2010, 99, 3787–3806. 10.1002/jps.22197. [DOI] [PubMed] [Google Scholar]
- Indulkar A. S.; Box K. J.; Taylor R.; Ruiz R.; Taylor L. S. pH-dependent liquid-liquid phase separation of highly supersaturated solutions of weakly basic drugs. Mol. Pharmaceutics 2015, 12, 2365–2377. 10.1021/acs.molpharmaceut.5b00056. [DOI] [PubMed] [Google Scholar]
- Li N.; Taylor L. S. Tailoring supersaturation from amorphous solid dispersions. J. Controlled Release 2018, 279, 114–125. 10.1016/j.jconrel.2018.04.014. [DOI] [PMC free article] [PubMed] [Google Scholar]
- Van Eerdenbrugh B.; Alonzo D. E.; Taylor L. S. Influence of particle size on the ultraviolet spectrum of particulate-containing solutions: Implications for in-situ concentration monitoring using UV/Vis fiber-optic probes. Pharm. Res. 2011, 28, 1643–1652. 10.1007/s11095-011-0399-4. [DOI] [PubMed] [Google Scholar]
- Raina S. A.; Alonzo D. E.; Zhang G. G.; Gao Y.; Taylor L. S. Using environment-sensitive fluorescent probes to characterize liquid-liquid phase separation in supersaturated solutions of poorly water soluble compounds. Pharm. Res. 2015, 32, 3660–3673. 10.1007/s11095-015-1725-z. [DOI] [PubMed] [Google Scholar]
- Stewart A. M.; Grass M. E.; Mudie D. M.; Morgen M. M.; Friesen D. T.; Vodak D. T. Development of a biorelevant, material-sparing membrane flux test for rapid screening of bioavailability-enhancing drug product formulations. Mol. Pharmaceutics 2017, 14, 2032–2046. 10.1021/acs.molpharmaceut.7b00121. [DOI] [PubMed] [Google Scholar]
- Liu Y.; Kathan K.; Saad W.; Prud’homme R. K. Ostwald Ripening of $\ensuremath{\beta}$-Carotene Nanoparticles. Phys. Rev. Lett. 2007, 98, 036102 10.1103/PhysRevLett.98.036102. [DOI] [PubMed] [Google Scholar]
- Makino K.; Ohshima H.; Kondo T. Kinetic model for membrane transport. III. Solute transport through an asymmetrical membrane. Biophys. J. 1992, 43, 89–105. 10.1016/0301-4622(92)80045-7. [DOI] [Google Scholar]
- Indulkar A. S.; Gao Y.; Raina S. A.; Zhang G. G.; Taylor L. S. Exploiting the phenomenon of liquid-liquid phase separation for enhanced and sustained membrane transport of a poorly water-soluble drug. Mol. Pharmaceutics 2016, 13, 2059–2069. 10.1021/acs.molpharmaceut.6b00202. [DOI] [PubMed] [Google Scholar]
- Xia X.; Zhou C.; Ballell L.; Garcia-Bennett A. E. In vivo enhancement in bioavailability of atazanavir in the presence of proton-pump inhibitors using mesoporous materials. ChemMedChem 2012, 7, 43–48. 10.1002/cmdc.201100500. [DOI] [PubMed] [Google Scholar]
- Yu J.; Yu D.; Lane S.; McConnachie L.; Ho R. J. Y. Controlled solvent removal from antiviral drugs and excipients in solution enables the formation of novel combination multi-drug-motifs in pharmaceutical powders composed of lopinavir, ritonavir and tenofovir. J. Pharm. Sci. 2020, 109, 3480–3489. 10.1016/j.xphs.2020.08.003. [DOI] [PMC free article] [PubMed] [Google Scholar]
- Bolla P. K.; Meraz C. A.; Rodriguez V. A.; Deaguero I.; Singh M.; Yellepeddi V. K.; Renukuntla J. Clotrimazole loaded ufosomes for topical delivery: Formulation development and in-vitro studies. Molecules 2019, 24, 3139. 10.3390/molecules24173139. [DOI] [PMC free article] [PubMed] [Google Scholar]
- Hsieh Y. L.; Ilevbare G. A.; Van Eerdenbrugh B.; Box K. J.; Sanchez-Felix M. V.; Taylor L. S. pH-Induced precipitation behavior of weakly basic compounds: determination of extent and duration of supersaturation using potentiometric titration and correlation to solid state properties. Pharm. Res. 2012, 29, 2738–2753. 10.1007/s11095-012-0759-8. [DOI] [PubMed] [Google Scholar]
- Law D.; Krill S. L.; Schmitt E. A.; Fort J. J.; Qiu Y.; Wang W.; Porter W. R. Physicochemical considerations in the preparation of amorphous ritonavir-poly(ethylene glycol) 8000 solid dispersions. J. Pharm. Sci. 2001, 90, 1015–1025. 10.1002/jps.1054. [DOI] [PubMed] [Google Scholar]
- Makino K.; Ohshima H.; Kondo T. Kinetic model for membrane transport: 2. Time lag and overshoot. Biophys. J. 1990, 38, 231–239. 10.1016/0301-4622(90)87005-6. [DOI] [PubMed] [Google Scholar]
- Raub T.; Barsuhn C.; Williams L.; Decker D.; Sawada G.; Ho N. Use of a biophysical-kinetic model to understand the roles of protein binding and membrane partitioning on passive diffusion of highly lipophilic molecules across cellular barriers. J. Drug Targeting 1993, 1, 269–286. 10.3109/10611869308996085. [DOI] [PubMed] [Google Scholar]
- Makino K.; Ohshima H.; Kondo T. Kinetic model for membrane transport: 1. Effects of membrane volume and partitioning kinetics. Biophys. J. 1990, 35, 85–95. 10.1016/0301-4622(90)80063-D. [DOI] [PubMed] [Google Scholar]
- Stepanyan R.; Lebouille J. G. J. L.; Slot J. J. M.; Tuinier R.; Stuart M. A. C. Controlled Nanoparticle Formation by Diffusion Limited Coalescence. Phys. Rev. Lett. 2012, 109, 138301 10.1103/PhysRevLett.109.138301. [DOI] [PubMed] [Google Scholar]
- Levich V. G.Physicochemical hydrodynamics; Englewood Cliffs, 1963. [Google Scholar]
- Avdeef A.Absorption and drug development : solubility, permeability, and charge state; John Wiley & Sons, Inc., 2012. [Google Scholar]
- Adson A.; Burton P. S.; Raub T. J.; Barsuhn C. L.; Audus K. L.; Ho N. F. Passive diffusion of weak organic electrolytes across Caco-2 cell monolayers: Uncoupling the contributions of hydrodynamic, transcellular, and paracellular barriers. J. Pharm. Sci. 1995, 84, 1197–1204. 10.1002/jps.2600841011. [DOI] [PubMed] [Google Scholar]
- Wilson V.; Lou X.; Osterling D. J.; Stolarik D. F.; Jenkins G.; Gao W.; Zhang G. G. Z.; Taylor L. S. Relationship between amorphous solid dispersion in vivo absorption and in vitro dissolution: phase behavior during dissolution, speciation, and membrane mass transport. J. Controlled Release 2018, 292, 172–182. 10.1016/j.jconrel.2018.11.003. [DOI] [PubMed] [Google Scholar]
- Clinical pharmacology and biopharmaceutics review for Emend (NDA 21–549); Food and Drug Administration, 2003. [Google Scholar]
- Jinno J.-i.; Kamada N.; Miyake M.; Yamada K.; Mukai T.; Odomi M.; Toguchi H.; Liversidge G. G.; Higaki K.; Kimura T. Effect of particle size reduction on dissolution and oral absorption of a poorly water-soluble drug, cilostazol, in beagle dogs. J. Controlled Release 2006, 111, 56–64. 10.1016/j.jconrel.2005.11.013. [DOI] [PubMed] [Google Scholar]
- Majumdar A. K.; Howard L.; Goldberg M. R.; Hickey L.; Constanzer M.; Rothenberg P. L.; Crumley T. M.; Panebianco D.; Bradstreet T. E.; Bergman A. J.; et al. Pharmacokinetics of Aprepitant After Single and Multiple Oral Doses in Healthy Volunteers. J. Clin. Pharmacol. 2006, 46, 291–300. 10.1177/0091270005283467. [DOI] [PubMed] [Google Scholar]
- Wu Y.; Loper A.; Landis E.; Hettrick L.; Novak L.; Lynn K.; Chen C.; Thompson K.; Higgins R.; Batra U.; et al. The role of biopharmaceutics in the development of a clinical nanoparticle formulation of MK-0869: a Beagle dog model predicts improved bioavailability and diminished food effect on absorption in human. Int. J. Pharm. 2004, 285, 135–146. 10.1016/j.ijpharm.2004.08.001. [DOI] [PubMed] [Google Scholar]
- Deng J.; Zhu X.; Chen Z.; Fan C. H.; Kwan H. S.; Wong C. H.; Shek K. Y.; Zuo Z.; Lam T. N. A review of food-drug interactions on oral drug absorption. Drugs 2017, 77, 1833–1855. 10.1007/s40265-017-0832-z. [DOI] [PubMed] [Google Scholar]
- Stappaerts J.; Wuyts B.; Tack J.; Annaert P.; Augustijns P. Human and simulated intestinal fluids as solvent systems to explore food effects on intestinal solubility and permeability. Eur. J. Pharm. Sci. 2014, 63, 178–186. 10.1016/j.ejps.2014.07.009. [DOI] [PubMed] [Google Scholar]
- Rezhdo O.; Speciner L.; Carrier R. Lipid-associated oral delivery: Mechanisms and analysis of oral absorption enhancement. J. Controlled Release 2016, 240, 544–560. 10.1016/j.jconrel.2016.07.050. [DOI] [PMC free article] [PubMed] [Google Scholar]
- Riedmaier A. E.; DeMent K.; Huckle J.; Bransford P.; Stillhart C.; Lloyd R.; Alluri R.; Basu S.; Chen Y.; Dhamankar V.; et al. Use of physiologically based pharmacokinetic (PBPK) modeling for predicting drug-food interactions: an industry perspective. AAPS J. 2020, 22, 123. 10.1208/s12248-020-00508-2. [DOI] [PMC free article] [PubMed] [Google Scholar]
Associated Data
This section collects any data citations, data availability statements, or supplementary materials included in this article.