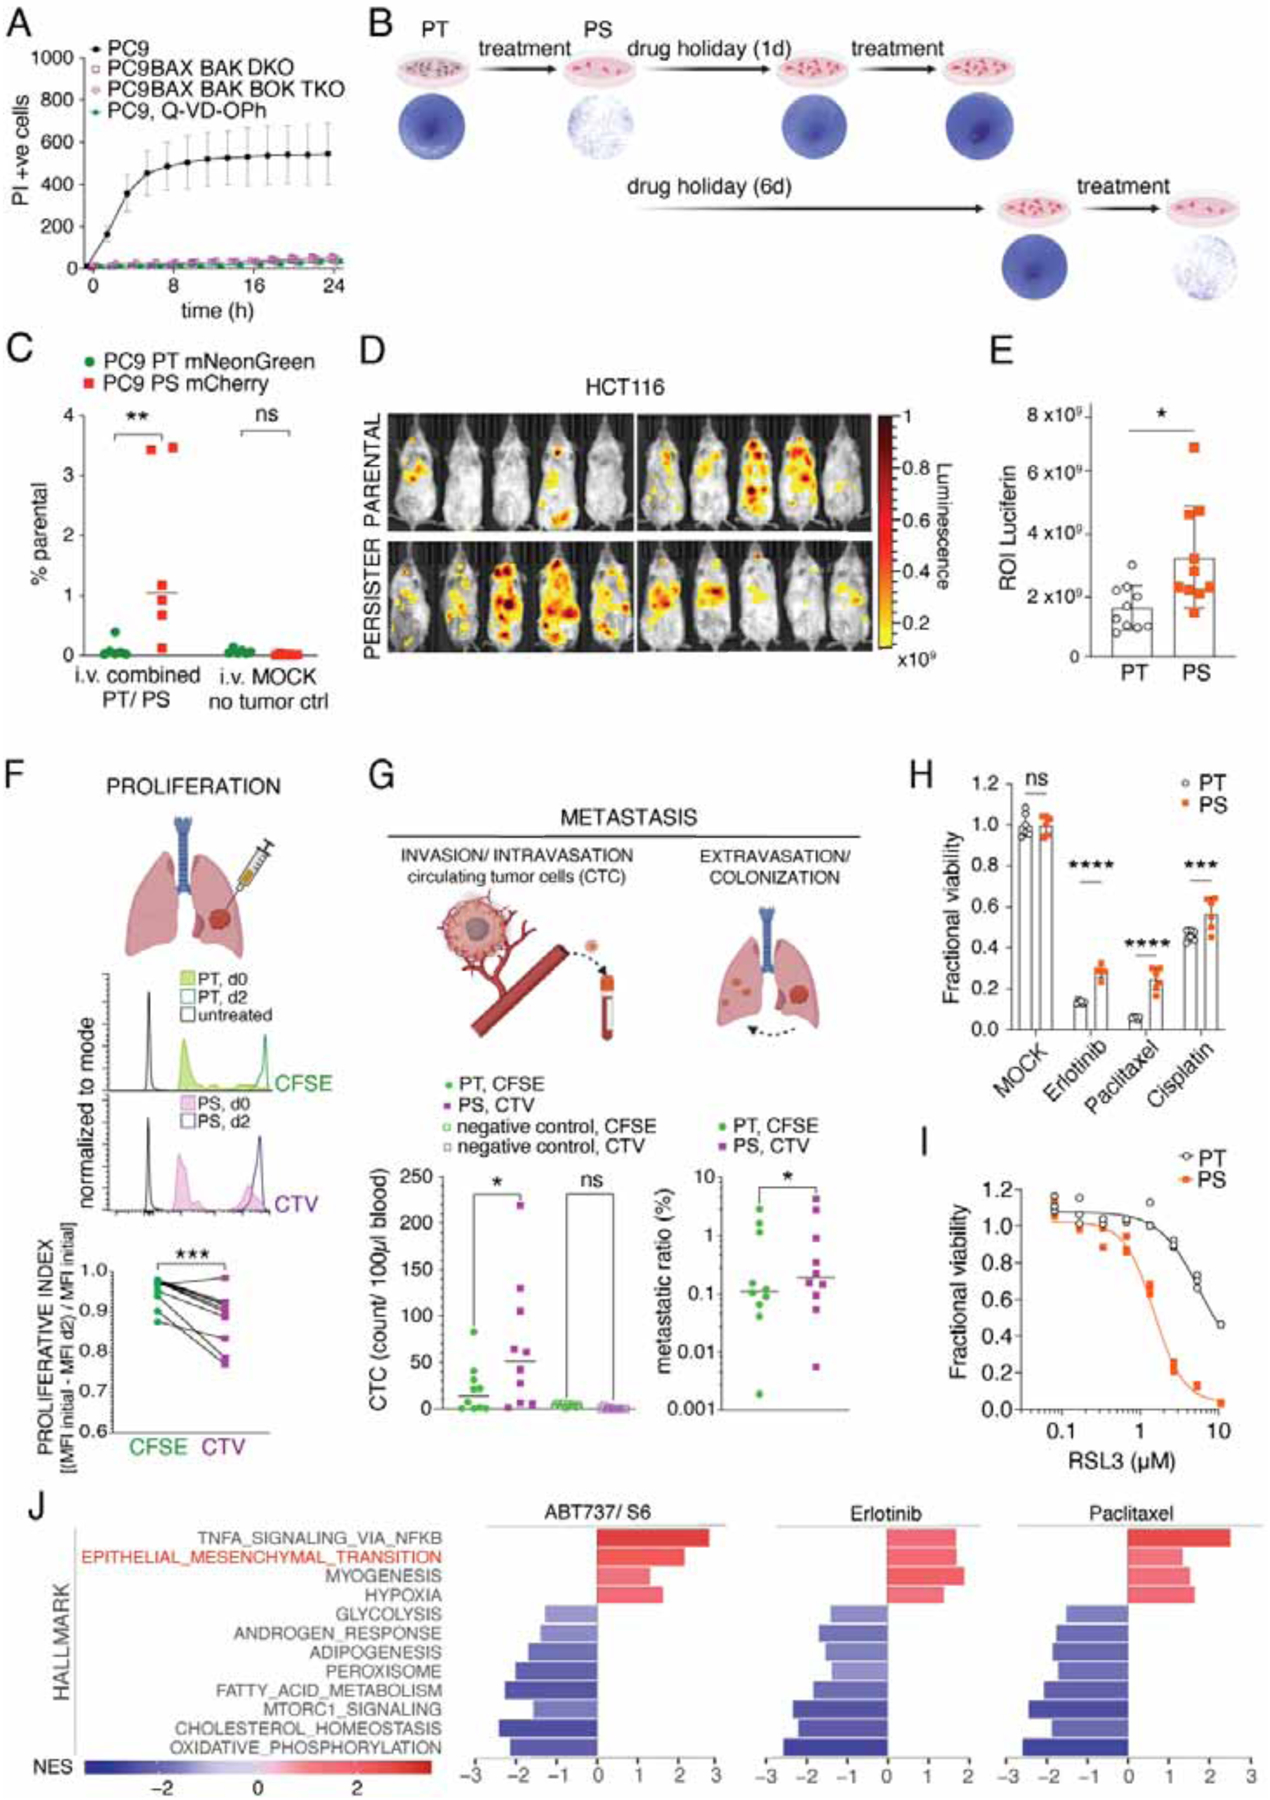
Figure 1. Targeting anti-apoptotic Bcl-2 proteins induces persister cells.

(A) IncuCyte quantification during treatment with 1.5μM ABT737 and 3μM S6 of PC9 WT, PC9 BAX- and BAK-knockout (DKO), PC9 BAX, BAK, BOK TKO cells and PC9 WT cells co-treated with 40μM Q-VD-OPh (mean ± s.d. of n=3 samples/group).
(B) Clonogenic survival of cells treated or not with 1.5 μM ABT737 and 3μM S6 for 6h washed and replated, or treated and then re-seeded again after 1d or 6d and then retreated, washed, and released to growth. Representative of 3 independent experiments, n=3/group.
(C) Flow analysis of mNeonGreen positive PT or mCherry positive PS, from lungs of NSG mice 3 months after combined tail vein injection; n=6 lungs/group. MOCK, lungs without tumor injection.
(D) Intravital images and (E) ROI quantification of luciferase activity 3 weeks after injection of either PT or PS firefly-luciferase-expressing HCT116 cells (n=10 mice, mean ± s.d.). Representative of 2 independent experiments.
(F) Flow analysis of CFSE-labelled PT and CTV-labelled PS. Representative histograms on day 0 before injection and 48h after injection into left apical lungs of NSG mice. Proliferative index calculated by CFSE or CTV MFI signal loss from initial measurement to d2 (n=10 lungs/group, data from 2 pooled experiments).
(G) Flow analysis of CFSE-labelled PT and CTV-labelled PS from RAG1−/− mice (n=10). Left: Quantification of circulating tumor cells from right heart ventricle blood 48h after injection. Right: Metastatic ratio representing the ratio between cells in contralateral lung and primary injection site for PT or PS cells, respectively.
(H) Fractional viability of PC9 PT and PS treated with MOCK, Erlotinib 5μM, Paclitaxel 1μM or Cisplatin 10μM for 3d. N=6 samples/group.
(I) Fractional viability of PC9 PT and PS treated with RSL3 for 3d. N=3 samples/group.
(J) Hallmark pathways enriched across treatment regimens. Enriched pathways were defined as false discovery rate (FDR) <0.05. Normalized enrichment scores (NES) are shown. PS were generated by treatment with ABT737 1.5μM and S6 3μM for 6h, or Erlotinib 5μM for 3d or Paclitaxel 0.5μM for 3d. Statistical analysis by 2-way ANOVA (C, G left, H), unpaired student’s t-test (E), paired student’s t-test (F and G, right) respectively.
*P <0.05; **P <0.01; ***P <0.001; ****P <0.0001. See also Figure S1.
