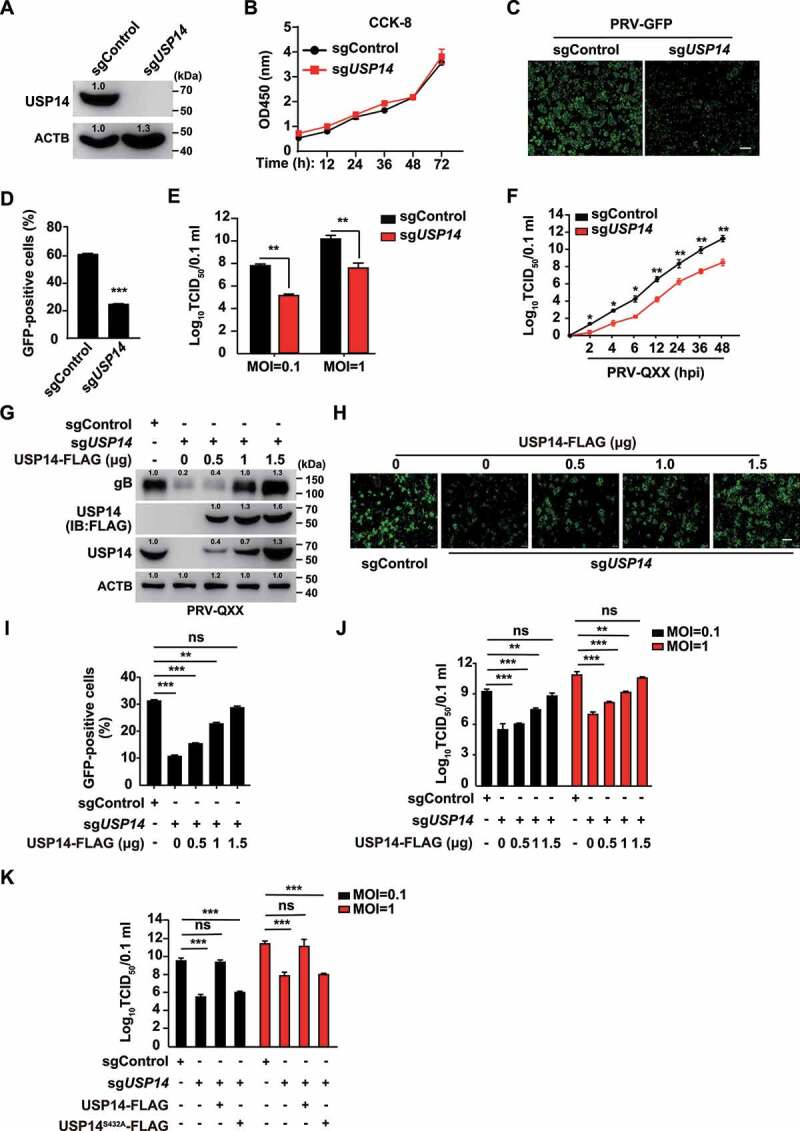
Figure 2.

Knockout of USP14 inhibits PRV infection. (A) USP14 in sgControl and sgUSP14 PK-15 cells was assessed by immunoblot analysis. (B) sgControl and sgUSP14 PK-15 cells were cultured for 0–72 h. Cell proliferation was assessed using the CCK-8 cell counting assay. (C) sgControl and sgUSP14 PK-15 cells were infected with PRV-GFP (MOI = 0.01) for 36 h. The fluorescence of GFP was detected by fluorescent microscopy. Scale bar: 400 μm. (D) Quantification of the percentage of GFP-positive cells from C by flow cytometry. (E) sgControl and sgUSP14 PK-15 cells were infected with PRV-QXX (MOI = 0.1 and 1) for 24 h. Viral titers were assessed by the TCID50 assay. (F) sgControl and sgUSP14 PK-15 cells were infected with PRV-QXX (MOI = 0.01) for 0–48 h. One-step growth curves of PRV-QXX were assessed using a TCID50 assay of viral titers. hpi, hour post infection. (G) sgControl and sgUSP14 PK-15 cells were transfected with plasmid encoding USP14-FLAG (0–1.5 μg) as indicated for 24 h, and then infected with PRV-QXX (MOI = 0.1) for 24 h. PRV gB, USP14-FLAG and USP14 were assessed by immunoblot analysis. (H) sgControl and sgUSP14 PK-15 cells were transfected with plasmid encoding USP14-FLAG (0–1.5 μg) as indicated for 24 h, and then infected with PRV-GFP (MOI = 0.01) for 36 h. The fluorescence of GFP was detected by fluorescent microscopy. Scale bar: 400 μm. (I) Quantification of the percentage of GFP-positive cells from H by flow cytometry. (J) sgControl and sgUSP14 PK-15 cells were transfected with plasmid encoding USP14-FLAG (0–1.5 μg) as indicated for 24 h, and then infected with PRV-QXX (MOI = 0.1 and 1) for 24 h. Viral titers were assessed by the TCID50 assay. (K) sgControl and sgUSP14 PK-15 cells were transfected with plasmid encoding USP14-FLAG (1.5 μg) and USP14S432A-FLAG (1.5 μg) as indicated for 24 h, and then infected with PRV-QXX (MOI = 0.1 and 1) for 24 h. Viral titers were assessed by the TCID50 assay. Data were shown as mean ± SD based on three independent experiments. * P < 0.05, ** P < 0.01, *** P < 0.001 determined by two-tailed Student’s t-test. ns, no significance.
