

Abstract
Introduction:
E-cigarette taxes have been enacted by 30 states through April 2020. E-cigarette tax schema vary, in contrast to cigarette taxes in the United States that are levied almost exclusively as excise taxes per pack. Some states use excise taxes on liquid and containers, others ad valorem taxes on wholesale prices, and others sales taxes. It is therefore difficult to understand the relative magnitudes of these e-cigarette taxes and the overall e-cigarette tax size relative to the cigarette tax size.
Objective:
To create and publish a database of state and local quarterly e-cigarette taxes from 2010 to 2020, standardized as the rate per milliliter of fluid.
Methods:
Using UPC-level e-cigarette sales from the NielsenIQ Retail Scanner Dataset along with e-cigarette product characteristics collected from internet searches and visits to e-cigarette retailers, we develop a method to standardize e-cigarette taxes as an equivalent average excise tax rate measured per milliliter of fluid.
Results:
In 2020, the average American resided in a location with $3.08 in cigarette taxes and $0.34 in e-cigarette taxes (assuming 1 pack = 0.7 fluid milliliters).
Conclusions:
The public availability of this state and local standardized e-cigarette tax data will allow tobacco control researchers to study the relationship between e-cigarette taxes and tobacco and related outcomes more effectively.
Introduction
E-cigarettes were first imported into the United States in 2006. By 2020, 19.6% of high school students used e-cigarettes in the last 30 days, though only a third used them at least 20 of the last 30 days.1 Adult 30-day e-cigarette use rates are lower at 4.5% in 2019.2 Several studies suggest higher e-cigarette tax rates reduce e-cigarette use.3–5 As of April 2021, 30 states have enacted e-cigarette taxes,6 but unlike cigarette taxes, which are usually levied as a fixed tax amount per pack of cigarettes, e-cigarette taxes are levied as unit specific excise taxes (i.e., fixed tax amount per fluid milliliter [ml] and/or container), ad valorem taxes (i.e., percent tax on the e-cigarette wholesale price), and as sales taxes (i.e., percent tax on the retail price). It is therefore challenging to understand the relative magnitudes of e-cigarette taxes across states with different tax schema.
We introduce a publicly available dataset of standardized e-cigarette taxes, measured as an average tax rate per ml of fluid, the most common unit for e-cigarette excise taxes (see Table 1). We also compare e-cigarette taxes and cigarette taxes over time.
Table 1:
E-cigarette tax changes through the end of 2020
| Tax Jurisdiction | Effective date | Unit taxed | Tax amount |
|---|---|---|---|
|
| |||
| District/State | |||
|
| |||
| Connecticut | 10/2019 | Per fluid milliliter1 | $0.40 |
| California | 4/2017, 7/2017, 7/2018, 7/2019, 7/2020 | Wholesale price | 27.3%, 65.1%, 62.8%, 59.3%, 56.9% |
| Delaware | 1/2018 | Per fluid milliliter | $0.05 |
| Illinois | 7/2019 | Wholesale price | 15.0% |
| Kansas | 1/2017, 7/2017 | Per fluid milliliter | $0.20, $0.05 |
| Kentucky | 8/2020 | Per container1 | $1.50 |
| Louisiana | 7/2015 | Per fluid milliliter | $0.05 |
| Maine | 1/2020 | Wholesale price | 43.0% |
| Massachusetts | 6/2020 | Wholesale price | 75.0% |
| Minnesota | 8/2010, 7/2013 | Wholesale price | 35.0%, 95.0% |
| North Carolina | 6/2015 | Per fluid milliliter | $0.05 |
| New Jersey | 10/2018, 11/2019 | Per fluid milliliter, Sales tax1 | $0.10, 10.0% |
| New Mexico | 7/2019 | Per container1 | $0.50 |
| Nevada | 1/2020 | Wholesale price | 30.0% |
| New Hampshire | 1/2020 | Per fluid milliliter1 | $0.30 |
| New York | 12/2019 | Sales tax | 20.0% |
| Ohio | 10/2019 | Per fluid milliliter2 | $0.10 |
| Pennsylvania | 7/2016 | Wholesale price | 40.0% |
| Utah | 7/2020 | Wholesale price | 56.0% |
| Vermont | 7/2019 | Wholesale price | 92.0% |
| Virginia | 7/2020 | Per fluid milliliter | $0.066 |
| Washington, DC | 10/2015, 10/2016, 10/2017, 10/2018 | Wholesale price | 67.0%, 65.0%,60.0%, 96.0% |
| Washington | 10/2019 | Per fluid milliliter3 | $0.27 |
| West Virginia | 7/2016 | Per fluid milliliter | $0.075 |
| Wisconsin | 10/2019 | Per fluid milliliter | $0.05 |
| Wyoming | 7/2020 | Wholesale price4 | 15.0% |
|
| |||
| County/City | |||
|
| |||
| Chicago, Illinois | 1/2016, 1/2019 | Per container / per fluid milliliter5 | $0.80 / $0.55, $1.50 / $1.20 |
| Cook County, Illinois | 5/2016 | Per fluid milliliter5 | $0.20 |
| Montgomery County, Maryland | 8/2015 | Wholesale price | 30.0% |
Notes:
Several states use a two-tier tax, with different taxes on cartridges and e-liquid. E-liquid tax amounts are as follows: Connecticut (10% wholesale), Kentucky (15% wholesale), New Hampshire (8% wholesale), New Mexico (12.5% wholesale), and New Jersey ($0.10 per fluid ml). We use just the tax on cartridges in these cases.
If the vapor product is sold in non-liquid form, tax unit is per gram instead of milliliter. We do not factor this into our standardization.
Open liquid products >5 ml taxed at $0.09 per fluid ml. We do not factor this into our standardization.
If the tax on the wholesale price is not paid, a sales tax at point of purchase of 7.5% is applied. We assume that the tax on the wholesale price is paid.
For Cook County, we do not have the ability to separate Chicago from the rest of Cook County in the NRSD data. Since Chicago constitutes approximately 52.1% of the population of Cook County in 2017, we weight the Chicago tax by this share of the population to approximate the Cook County tax.
Methods
Standardizing e-cigarette taxes requires a variety of assumptions. Our methodology attempts to derive variation from legislated tax changes and minimize the influence of factors such as changes in e-cigarette product offerings and consumer preferences that are otherwise difficult to control for in regression modelling and may introduce bias. We also provide alternative tax measures with relaxed assumptions.
We use NielsenIQ retail scanner data (NRSD) to determine retail prices. The NRSD provides scanner transaction data at the store-by-UPC-by-week level for approximately 30,000 to 50,000 stores annually, which represents over 20% of national sales in food, drug, and mass merchandise stores but only a small share (2%) of convenience store sales. The NRSD categorizes specific UPC codes as e-cigarettes beginning in 2013, whereas in earlier years we identify e-cigarette UPC codes grouped with other tobacco products by backdating known e-cigarettes from year 2013. We identified and linked product characteristics from internet searches and visits to e-cigarette retailers for 98.6% of the NRSD e-cigarette sales volume in 2013, or 97.7% from 2011 to 2019.4,7
We convert ad valorem and sales taxes to their excise tax equivalencies for each tax jurisdiction, defined as a state or large population center (i.e., Cook County, IL and Montgomery County, MD) that levies taxes. There is currently no federal e-cigarette tax.
Ad valorem taxes
We standardize taxes for the twelve jurisdictions using ad valorem taxes by the end of 2020:
| (1) |
where s indexes a tax jurisdiction on a quarterly basis t.
The variable ad valorem ratest is the quarterly tax rate reported by the CDC State System for each state (or Montgomery County, MD that also uses an ad valorem tax). As shown in online material, the ad valorem taxes range from a low of 15% (of wholesale price) in Illinois to a high of 96% in Washington DC. To determine the wholesaler’s selling price (wholesale price per ml) we need to determine the retail price per fluid ml and subtract an estimated retailer markup.
We begin by using the NRSD to calculate the retail price per fluid ml for all e-cigarettes (including disposables, starter kits, and replacement cartridges) after omitting zero nicotine products and products for which fluid or container amounts could not be identified from hand-collected data on UPC product characteristics.4,7 Next we calculate the sales-weighted retail price per fluid ml for 23 tax jurisdictions not adopting e-cigarette taxes by the end of 2020, which provides a consistent sample of jurisdictions and removes the need to make assumptions regarding pass-through of taxes to prices in jurisdictions that adopt taxes.
We find an average sales-weighted e-cigarette retail price of $4.04 per fluid ml in 2013 for the 23 non-tax jurisdictions. We calculate a wholesale price averaged just for the year 2013 (the first year e-cigarettes are categorized by the NRSD) to reduce the influence of time-varying factors, including the effect that state-level tax changes could have on wholesale prices in other states.
Next, utilizing the $4.04 per fluid ml measure of retail price, we subtract an estimated retailer markup of 35%, which is the markup rate used by a major e-cigarette company for nicotine-containing cartridges based on company purchasing form information reviewed by the authors. This 35% retailer markup yields a wholesale price of $2.63 per fluid ml ($4.04 × 65%). We alternatively subtract a 20% markup rate used in cigarette research,8 yielding a wholesale price of $3.23 and, hence, a larger ad valorem tax rate. We speculate larger markups were used for e-cigarettes to incentivize store owners to offer limited shelf space for newer e-cigarette products that have less proven profitability than cigarettes.
We examine the extent to which wholesale prices vary across time and geography in two ways. First, we check whether e-cigarette retail prices vary across the 23 non-taxing jurisdictions at a given point in time, which could reflect geographical differences in wholesale prices or retailer markups. We compare retail prices as recorded by the NRSD for the top three best-selling e-cigarette products (by liquid volume) sold across these jurisdictions for the store type that sold the most e-cigarettes (e.g., drug stores) in that particular year. For example, in 2011 the most popular product was a Blu e-cigarette and the most popular channel was convenience stores. For this product in these stores, the average sales-weighted price was $8.18 across the 23 non-tax jurisdictions, and the standard deviation was only $0.03, or approximately 0.4% of the retail price mean. Continuing this exercise for the top three products across each of the nine years provides 27 estimates in total and includes e-cigarettes sold by 5 different companies. The average standard deviation as a percent of the price was only 1.6% across these estimates. This provides evidence that large volume e-cigarette companies use national pricing strategies rather than regional pricing strategies and justifies our use of an average wholesale price in our preferred e-cigarette tax measure.
Second, we provide standardized e-cigarette tax rates using a time-varying measure of estimated wholesale prices. Here, instead of using the 2013 wholesale price, we calculate the average wholesale price for each quarter (again in the 23 jurisdictions). The NRSD is not yet available for 2020 as of Oct. 2021, so for this standardized tax we use Q4 2019 NRSD values and 2020 e-cigarette tax rates to project 2020 standardized tax values.
Other Taxes
For two states using sales taxes, we multiply the average retail price per fluid ml of liquid nicotine in 2013 for the 23 jurisdictions by the sales tax rate to determine the tax per fluid ml.
| (2) |
Similarly, taxes per container are standardized using the tax rate per container and the average containers per fluid ml in 2013 for the 23 jurisdictions.
| (3) |
The average retail price per ml and containers per ml for these jurisdictions was $4.05 and 1.02 respectively in 2013, or $4.49 and 0.99 from 2011 to 2019. For both equations (2) and (3), our time-varying standardized tax uses time-varying retail prices and containers per ml, rather than in 2013.
Results
We calculate population-weighted national average cigarette taxes and e-cigarette taxes and plot them over time in Figure 1. We sum the $1.01 federal cigarette tax, state-level cigarette tax provided by the CDC State System, and local cigarette taxes provided by the American Non-Smokers Rights Foundation to create total cigarette tax.
Figure 1.

E-cigarette and cigarette tax rates over time, 4th quarter of each year. All local taxes, state taxes and federal taxes (for cigarettes) are population weighted to the national level in this chart. The e-cigarette tax (35% retailer markup, time-invariant tax units) is expressed in 0.7 fluid mL units, assuming 1 pack=0.7 fluid mL.
To compare cigarette and e-cigarette tax rates, we assume that 0.7 fluid ml, the amount contained in a Juul pod, is equivalent to one pack of cigarettes.9 While this conversion factor is a useful way to compare current taxes, it likely underestimates the e-cigarette tax relative to the cigarette tax in earlier years when salt-based high-nicotine concentration e-liquid products were not yet on market. We find that in the fourth quarter of 2020 the population-weighted average cigarette tax was $3.08 per pack. The average e-cigarette tax for our preferred standardized tax measure was $0.34 per pod, rising from $0.22 in 2018 and $0.26 in 2019.
The online appendix tables provide actual and standardized e-cigarette tax rates disaggregated for each tax jurisdiction and quarter, through 2020. Online Table 1 lists our preferred e-cigarette tax using the time-invariant estimated tax units assuming a 35% markup; Online Table 2 lists e-cigarette taxes using time-invariant estimated tax units assuming a 20% markup; and Online Table 3 lists e-cigarette taxes using time-varying estimated tax units assuming a 35% markup. Figure 2 shows similarity in the two standardized e-cigarette taxes using a 35% markup except for some divergence occurring in year 2018, potentially due to Juul’s rapid ascendence, before returning to being quite similar in years 2019 and 2020. The decline in e-cigarette taxes from 2018 to 2019 using our time-varying measure, despite legislated tax increases occurring during this period of time, illustrates our rationale for preferring the use of time-invariant units for standardizing e-cigarette taxes.
Figure 2.
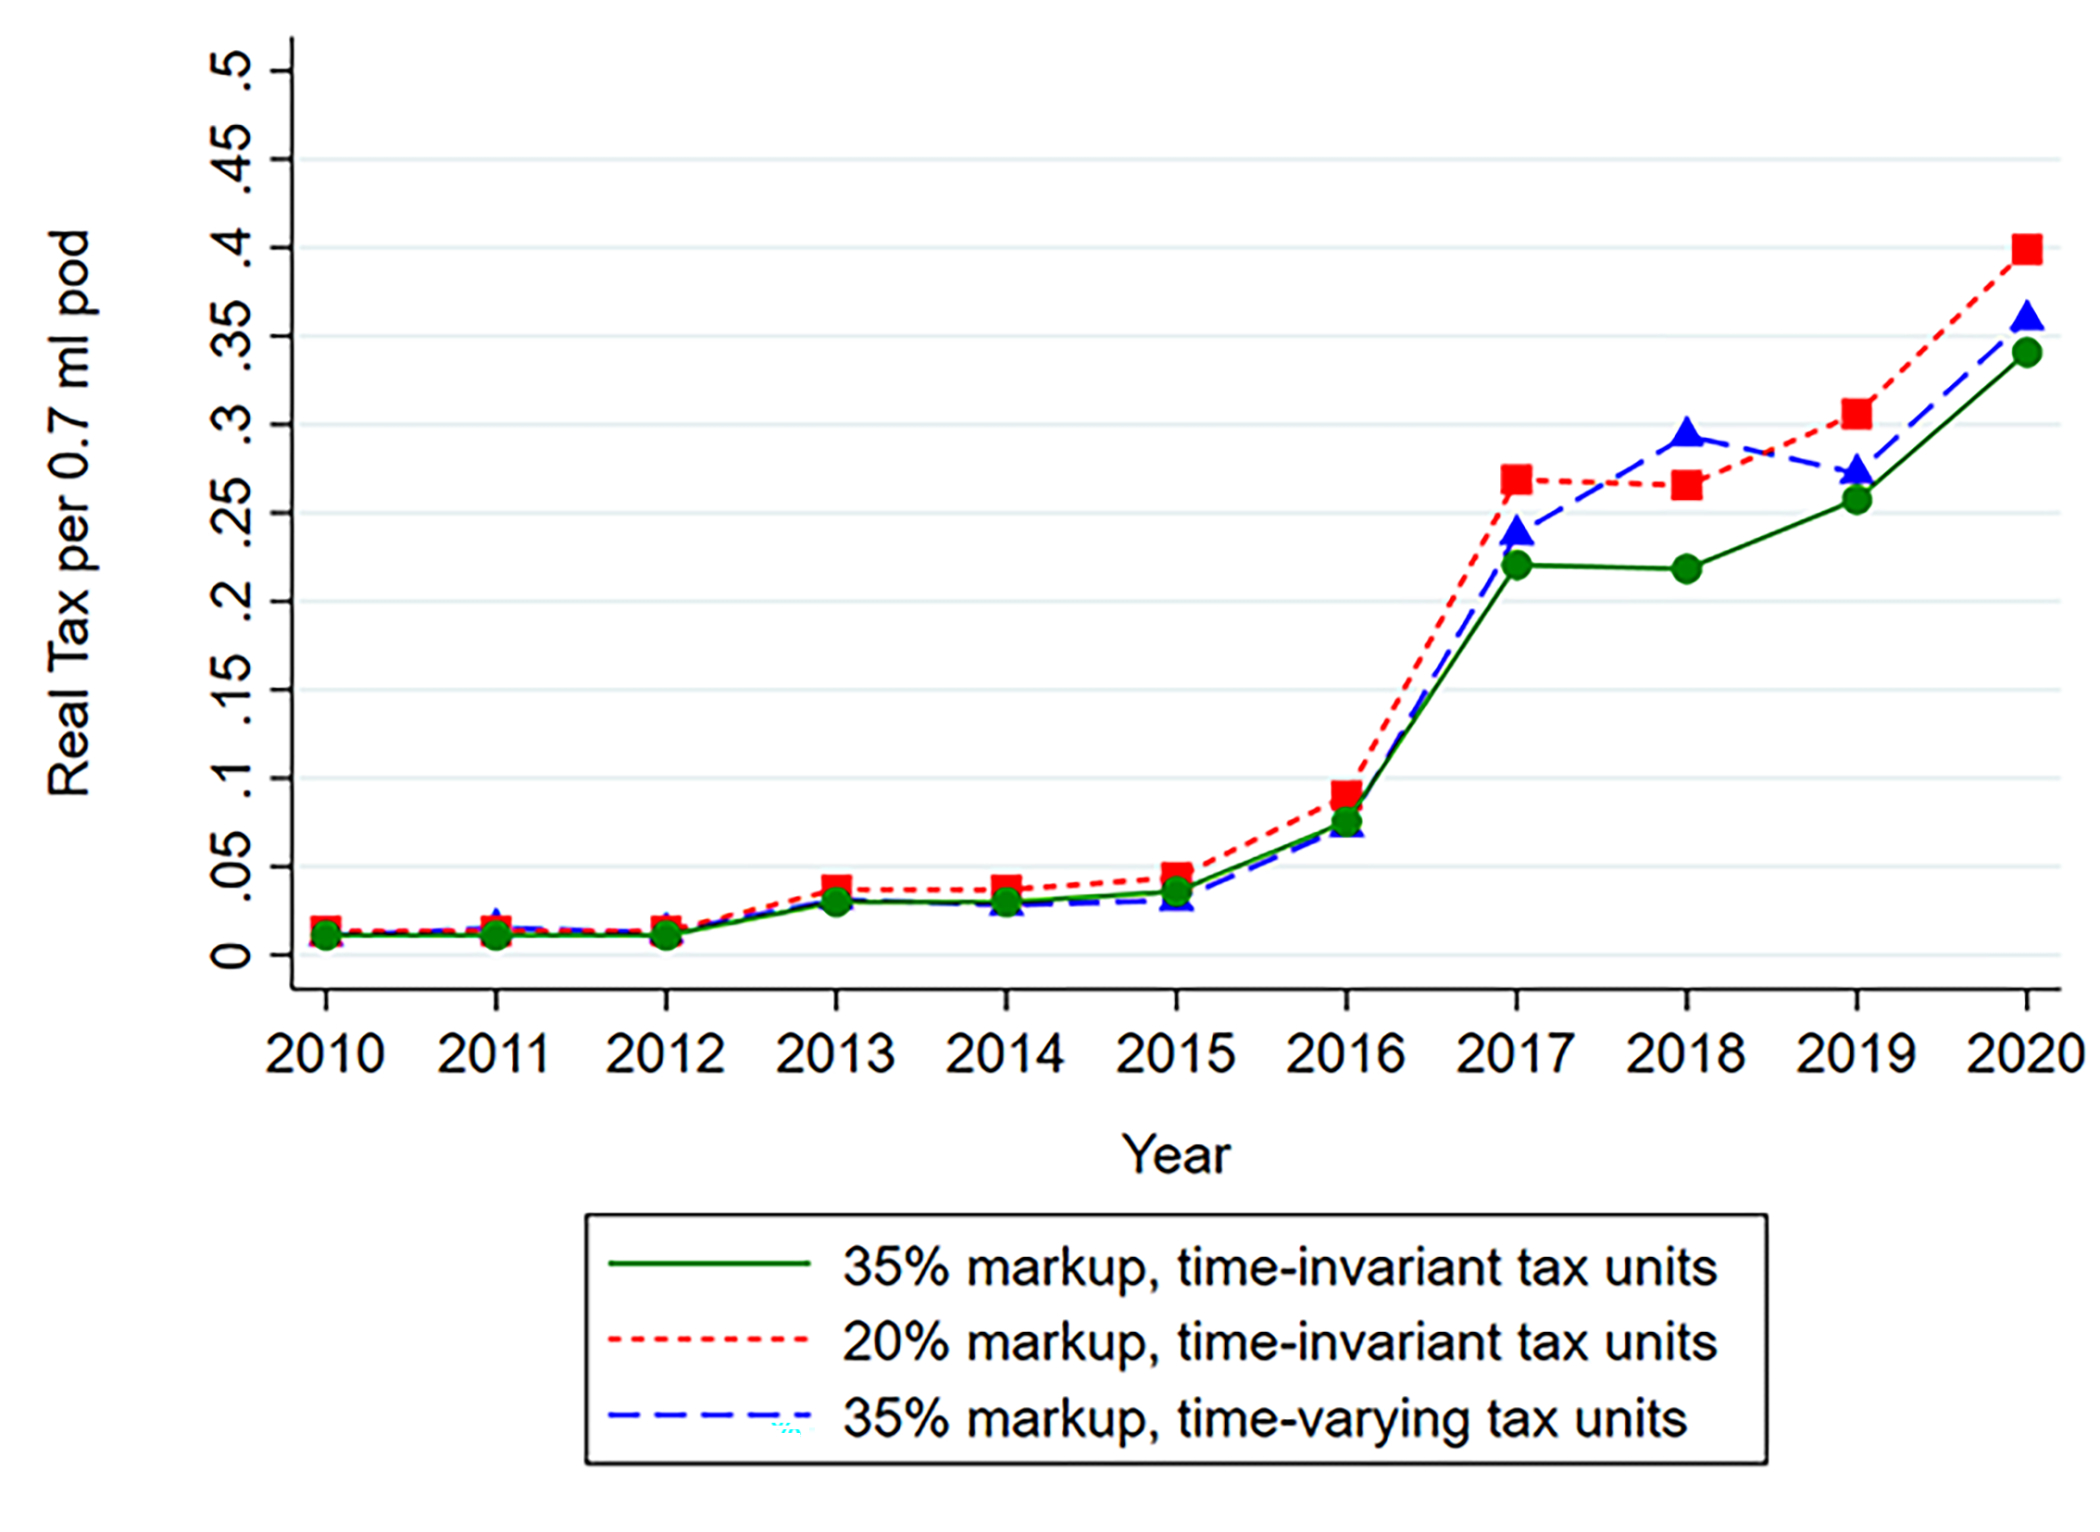
E-cigarette tax measures over time, 4th quarter of each year. All local taxes, state taxes and federal taxes (for cigarettes) are population weighted to the national level in this chart. E-cigarette taxes are expressed in 0.7 fluid mL units, assuming 1 pack=0.7 fluid mL.9
Discussion
Several studies use earlier versions of the e-cigarette tax data discussed in this study to find that e-cigarette tax rates raise e-cigarette prices,4,15 reduce e-cigarette sales and use, and increase cigarette sales and use.3–5,16 Other researchers are now free to use these data through 2020 in their own studies. We encourage best practices for quasi-experimental research, such as using fixed effect models for tax jurisdiction and time, and testing parallel trends and other relevant assumptions.10
The Tax Burden on Tobacco (TBOT) publications have long been regarded as a premier source of cigarette price and tax data. The TBOT uses a mail survey of approximately 15,000 to 16,000 retailers in recent years.11 Our sampling frame compares favorably by using 35,000 stores, and scanner data also provides more accuracy in retail prices than survey data. Our methodology to standardize e-cigarette taxes levied in different ways provides a companion resource to the TBOT for e-cigarette tax data going forward.
In 2020, e-cigarettes were taxed at around 11% of the rate at which cigarettes were taxed (13% assuming a 20% retailer markup). Setting e-cigarette taxes at parity with cigarette taxes is not necessarily optimal; for example, several editorials recommend a strategy of taxing e-cigarettes proportionate to their risk vis-à-vis cigarettes.12–14 As the relative risk of e-cigarettes and cigarettes becomes clearer, the data presented here can support policy decisions about setting e-cigarette tax rates.
Acknowledgments and Notes:
Authorship order is alphabetical to reflect equal co-authorship. The views expressed herein are those of the authors and do not necessarily reflect the views of the National Institutes of Health. Researcher(s) own analyses calculated (or derived) based in part on data from Nielsen Consumer LLC and marketing databases provided through the NielsenIQ Datasets at the Kilts Center for Marketing Data Center at The University of Chicago Booth School of Business. Dr. Tefft completed the work while a professor at Bates College.
Role of Funder/Sponsor:
Sponsors had no role in the design and conduct of the study.
Over the past 3 years, authors report funding from the National Institutes of Health (Pesko and Tefft), American Cancer Society (Pesko), University of Kentucky Institute for the Study of Free Enterprise (Pesko), Robert Wood Johnson Foundation (Tefft), and for COVID-related consulting/expert testimony for the United South and Eastern Tribes and American Civil Liberties Union (Cotti).
Abbreviations:
- CDC
Centers for Disease Control
- NRSD
Nielsen Retail Scanner Data
- TBOT
Tax Burden on Tobacco
Online Appendix:
Online Table 1:
E-cigarette Taxes by State/County from 2010 to 2020, 35% Retailer Markup, Time-Invariant Tax Units
| Online Table 1A: E-cigarette Taxes by State/County from 2010 to 2011, 35% Retailer Markup, Time-Invariant Tax Units | ||||||||
| Jurisdiction | Y2010Q1 | Y2010Q2 | Y2010Q3 | Y2010Q4 | Y2011Q1 | Y2011Q2 | Y2011Q3 | Y2011Q4 |
| AL | . | . | . | . | . | . | . | . |
| AK | . | . | . | . | . | . | . | . |
| AR | . | . | . | . | . | . | . | . |
| AZ | . | . | . | . | . | . | . | . |
| CA | . | . | . | . | . | . | . | . |
| CO | . | . | . | . | . | . | . | . |
| CT | . | . | . | . | . | . | . | . |
| DC | . | . | . | . | . | . | . | . |
| DE | . | . | . | . | . | . | . | . |
| FL | . | . | . | . | . | . | . | . |
| GA | . | . | . | . | . | . | . | . |
| HI | . | . | . | . | . | . | . | . |
| IA | . | . | . | . | . | . | . | . |
| ID | . | . | . | . | . | . | . | . |
| IL | . | . | . | . | . | . | . | . |
| IN | . | . | . | . | . | . | . | . |
| KS | . | . | . | . | . | . | . | . |
| KY | . | . | . | . | . | . | . | . |
| LA | . | . | . | . | . | . | . | . |
| MA | . | . | . | . | . | . | . | . |
| MD | . | . | . | . | . | . | . | . |
| ME | . | . | . | . | . | . | . | . |
| MI | . | . | . | . | . | . | . | . |
| MN | . | . | 0.61 | 0.92 | 0.92 | 0.92 | 0.92 | 0.92 |
| MO | . | . | . | . | . | . | . | . |
| MS | . | . | . | . | . | . | . | . |
| MT | . | . | . | . | . | . | . | . |
| NC | . | . | . | . | . | . | . | . |
| ND | . | . | . | . | . | . | . | . |
| NE | . | . | . | . | . | . | . | . |
| NH | . | . | . | . | . | . | . | . |
| NJ | . | . | . | . | . | . | . | . |
| NM | . | . | . | . | . | . | . | . |
| NV | . | . | . | . | . | . | . | . |
| NY | . | . | . | . | . | . | . | . |
| OH | . | . | . | . | . | . | . | . |
| OK | . | . | . | . | . | . | . | . |
| OR | . | . | . | . | . | . | . | . |
| PA | . | . | . | . | . | . | . | . |
| RI | . | . | . | . | . | . | . | . |
| SC | . | . | . | . | . | . | . | . |
| SD | . | . | . | . | . | . | . | . |
| TN | . | . | . | . | . | . | . | . |
| TX | . | . | . | . | . | . | . | . |
| UT | . | . | . | . | . | . | . | . |
| VA | . | . | . | . | . | . | . | . |
| VT | . | . | . | . | . | . | . | . |
| WA | . | . | . | . | . | . | . | . |
| WI | . | . | . | . | . | . | . | . |
| WV | . | . | . | . | . | . | . | . |
| WY | . | . | . | . | . | . | . | . |
| Cook, IL | . | . | . | . | . | . | . | . |
| Mont., MD | . | . | . | . | . | . | . | . |
| Online Table 1B: E-cigarette Taxes by State/County from 2012 to 2013, 35% Retailer Markup, Time-Invariant Tax Units | ||||||||
| Jurisdiction | Y2012Q1 | Y2012Q2 | Y2012Q3 | Y2012Q4 | Y2013Q1 | Y2013Q2 | Y2013Q3 | Y2013Q4 |
| AL | . | . | . | . | . | . | . | . |
| AK | . | . | . | . | . | . | . | . |
| AR | . | . | . | . | . | . | . | . |
| AZ | . | . | . | . | . | . | . | . |
| CA | . | . | . | . | . | . | . | . |
| CO | . | . | . | . | . | . | . | . |
| CT | . | . | . | . | . | . | . | . |
| DC | . | . | . | . | . | . | . | . |
| DE | . | . | . | . | . | . | . | . |
| FL | . | . | . | . | . | . | . | . |
| GA | . | . | . | . | . | . | . | . |
| HI | . | . | . | . | . | . | . | . |
| IA | . | . | . | . | . | . | . | . |
| ID | . | . | . | . | . | . | . | . |
| IL | . | . | . | . | . | . | . | . |
| IN | . | . | . | . | . | . | . | . |
| KS | . | . | . | . | . | . | . | . |
| KY | . | . | . | . | . | . | . | . |
| LA | . | . | . | . | . | . | . | . |
| MA | . | . | . | . | . | . | . | . |
| MD | . | . | . | . | . | . | . | . |
| ME | . | . | . | . | . | . | . | . |
| MI | . | . | . | . | . | . | . | . |
| MN | 0.92 | 0.92 | 0.92 | 0.92 | 0.92 | 0.92 | 2.50 | 2.50 |
| MO | . | . | . | . | . | . | . | . |
| MS | . | . | . | . | . | . | . | . |
| MT | . | . | . | . | . | . | . | . |
| NC | . | . | . | . | . | . | . | . |
| ND | . | . | . | . | . | . | . | . |
| NE | . | . | . | . | . | . | . | . |
| NH | . | . | . | . | . | . | . | . |
| NJ | . | . | . | . | . | . | . | . |
| NM | . | . | . | . | . | . | . | . |
| NV | . | . | . | . | . | . | . | . |
| NY | . | . | . | . | . | . | . | . |
| OH | . | . | . | . | . | . | . | . |
| OK | . | . | . | . | . | . | . | . |
| OR | . | . | . | . | . | . | . | . |
| PA | . | . | . | . | . | . | . | . |
| RI | . | . | . | . | . | . | . | . |
| SC | . | . | . | . | . | . | . | . |
| SD | . | . | . | . | . | . | . | . |
| TN | . | . | . | . | . | . | . | . |
| TX | . | . | . | . | . | . | . | . |
| UT | . | . | . | . | . | . | . | . |
| VA | . | . | . | . | . | . | . | . |
| VT | . | . | . | . | . | . | . | . |
| WA | . | . | . | . | . | . | . | . |
| WI | . | . | . | . | . | . | . | . |
| WV | . | . | . | . | . | . | . | . |
| WY | . | . | . | . | . | . | . | . |
| Cook, IL | . | . | . | . | . | . | . | . |
| Mont., MD | . | . | . | . | . | . | . | . |
| Online Table 1C: E-cigarette Taxes by State/County from 2014 to 2015, 35% Retailer Markup, Time-Invariant Tax Units | ||||||||
| Jurisdiction | Y2014Q1 | Y2014Q2 | Y2014Q3 | Y2014Q4 | Y2015Q1 | Y2015Q2 | Y2015Q3 | Y2015Q4 |
| AL | . | . | . | . | . | . | . | . |
| AK | . | . | . | . | . | . | . | . |
| AR | . | . | . | . | . | . | . | . |
| AZ | . | . | . | . | . | . | . | . |
| CA | . | . | . | . | . | . | . | . |
| CO | . | . | . | . | . | . | . | . |
| CT | . | . | . | . | . | . | . | . |
| DC | . | . | . | . | . | . | . | 1.76 |
| DE | . | . | . | . | . | . | . | . |
| FL | . | . | . | . | . | . | . | . |
| GA | . | . | . | . | . | . | . | . |
| HI | . | . | . | . | . | . | . | . |
| IA | . | . | . | . | . | . | . | . |
| ID | . | . | . | . | . | . | . | . |
| IL | . | . | . | . | . | . | . | . |
| IN | . | . | . | . | . | . | . | . |
| KS | . | . | . | . | . | . | . | . |
| KY | . | . | . | . | . | . | . | . |
| LA | . | . | . | . | . | . | 0.05 | 0.05 |
| MA | . | . | . | . | . | . | . | . |
| MD | . | . | . | . | . | . | . | . |
| ME | . | . | . | . | . | . | . | . |
| MI | . | . | . | . | . | . | . | . |
| MN | 2.50 | 2.50 | 2.50 | 2.50 | 2.50 | 2.50 | 2.50 | 2.50 |
| MO | . | . | . | . | . | . | . | . |
| MS | . | . | . | . | . | . | . | . |
| MT | . | . | . | . | . | . | . | . |
| NC | . | . | . | . | . | 0.02 | 0.05 | 0.05 |
| ND | . | . | . | . | . | . | . | . |
| NE | . | . | . | . | . | . | . | . |
| NH | . | . | . | . | . | . | . | . |
| NJ | . | . | . | . | . | . | . | . |
| NM | . | . | . | . | . | . | . | . |
| NV | . | . | . | . | . | . | . | . |
| NY | . | . | . | . | . | . | . | . |
| OH | . | . | . | . | . | . | . | . |
| OK | . | . | . | . | . | . | . | . |
| OR | . | . | . | . | . | . | . | . |
| PA | . | . | . | . | . | . | . | . |
| RI | . | . | . | . | . | . | . | . |
| SC | . | . | . | . | . | . | . | . |
| SD | . | . | . | . | . | . | . | . |
| TN | . | . | . | . | . | . | . | . |
| TX | . | . | . | . | . | . | . | . |
| UT | . | . | . | . | . | . | . | . |
| VA | . | . | . | . | . | . | . | . |
| VT | . | . | . | . | . | . | . | . |
| WA | . | . | . | . | . | . | . | . |
| WI | . | . | . | . | . | . | . | . |
| WV | . | . | . | . | . | . | . | . |
| WY | . | . | . | . | . | . | . | . |
| Cook, IL | . | . | . | . | . | . | . | . |
| Mont., MD | . | . | . | . | . | . | 0.53 | 0.79 |
| Online Table 1D: E-cigarette Taxes by State/County from 2015 to 2016, 35% Retailer Markup, Time-Invariant Tax Units | ||||||||
| Jurisdiction | Y2016Q1 | Y2016Q2 | Y2016Q3 | Y2016Q4 | Y2017Q1 | Y2017Q2 | Y2017Q3 | Y2017Q4 |
| AL | . | . | . | . | . | . | . | . |
| AK | . | . | . | . | . | . | . | . |
| AR | . | . | . | . | . | . | . | . |
| AZ | . | . | . | . | . | . | . | . |
| CA | . | . | . | . | . | 0.72 | 1.71 | 1.71 |
| CO | . | . | . | . | . | . | . | . |
| CT | . | . | . | . | . | . | . | . |
| DC | 1.76 | 1.76 | 1.76 | 1.71 | 1.71 | 1.71 | 1.71 | 1.58 |
| DE | . | . | . | . | . | . | . | . |
| FL | . | . | . | . | . | . | . | . |
| GA | . | . | . | . | . | . | . | . |
| HI | . | . | . | . | . | . | . | . |
| IA | . | . | . | . | . | . | . | . |
| ID | . | . | . | . | . | . | . | . |
| IL | . | . | . | . | . | . | . | . |
| IN | . | . | . | . | . | . | . | . |
| KS | . | . | . | . | 0.20 | 0.20 | 0.05 | 0.05 |
| KY | . | . | . | . | . | . | . | . |
| LA | 0.05 | 0.05 | 0.05 | 0.05 | 0.05 | 0.05 | 0.05 | 0.05 |
| MA | . | . | . | . | . | . | . | . |
| MD | . | . | . | . | . | . | . | . |
| ME | . | . | . | . | . | . | . | . |
| MI | . | . | . | . | . | . | . | . |
| MN | 2.50 | 2.50 | 2.50 | 2.50 | 2.50 | 2.50 | 2.50 | 2.50 |
| MO | . | . | . | . | . | . | . | . |
| MS | . | . | . | . | . | . | . | . |
| MT | . | . | . | . | . | . | . | . |
| NC | 0.05 | 0.05 | 0.05 | 0.05 | 0.05 | 0.05 | 0.05 | 0.05 |
| ND | . | . | . | . | . | . | . | . |
| NE | . | . | . | . | . | . | . | . |
| NH | . | . | . | . | . | . | . | . |
| NJ | . | . | . | . | . | . | . | . |
| NM | . | . | . | . | . | . | . | . |
| NV | . | . | . | . | . | . | . | . |
| NY | . | . | . | . | . | . | . | . |
| OH | . | . | . | . | . | . | . | . |
| OK | . | . | . | . | . | . | . | . |
| OR | . | . | . | . | . | . | . | . |
| PA | . | . | 1.05 | 1.05 | 1.05 | 1.05 | 1.05 | 1.05 |
| RI | . | . | . | . | . | . | . | . |
| SC | . | . | . | . | . | . | . | . |
| SD | . | . | . | . | . | . | . | . |
| TN | . | . | . | . | . | . | . | . |
| TX | . | . | . | . | . | . | . | . |
| UT | . | . | . | . | . | . | . | . |
| VA | . | . | . | . | . | . | . | . |
| VT | . | . | . | . | . | . | . | . |
| WA | . | . | . | . | . | . | . | . |
| WI | . | . | . | . | . | . | . | . |
| WV | . | . | 0.08 | 0.08 | 0.08 | 0.08 | 0.08 | 0.08 |
| WY | . | . | . | . | . | . | . | . |
| Cook, IL | 0.70 | 0.83 | 0.90 | 0.90 | 0.90 | 0.90 | 0.90 | 0.90 |
| Mont., MD | 0.79 | 0.79 | 0.79 | 0.79 | 0.79 | 0.79 | 0.79 | 0.79 |
| Online Table 1E: E-cigarette Taxes by State/County from 2018 to 2019, 35% Retailer Markup, Time-Invariant Tax Units | ||||||||
| Jurisdiction | Y2018Q1 | Y2018Q2 | Y2018Q3 | Y2018Q4 | Y2019Q1 | Y2019Q2 | Y2019Q3 | Y2019Q4 |
| AL | . | . | . | . | . | . | . | . |
| AK | . | . | . | . | . | . | . | . |
| AR | . | . | . | . | . | . | . | . |
| AZ | . | . | . | . | . | . | . | . |
| CA | 1.71 | 1.71 | 1.65 | 1.65 | 1.65 | 1.65 | 1.56 | 1.56 |
| CO | . | . | . | . | . | . | . | . |
| CT | . | . | . | . | . | . | . | 0.40 |
| DC | 1.58 | 1.58 | 1.58 | 2.53 | 2.53 | 2.53 | 2.53 | 2.53 |
| DE | 0.05 | 0.05 | 0.05 | 0.05 | 0.05 | 0.05 | 0.05 | 0.05 |
| FL | . | . | . | . | . | . | . | . |
| GA | . | . | . | . | . | . | . | . |
| HI | . | . | . | . | . | . | . | . |
| IA | . | . | . | . | . | . | . | . |
| ID | . | . | . | . | . | . | . | . |
| IL | . | . | . | . | . | . | 0.39 | 0.39 |
| IN | . | . | . | . | . | . | . | . |
| KS | 0.05 | 0.05 | 0.05 | 0.05 | 0.05 | 0.05 | 0.05 | 0.05 |
| KY | . | . | . | . | . | . | . | . |
| LA | 0.05 | 0.05 | 0.05 | 0.05 | 0.05 | 0.05 | 0.05 | 0.05 |
| MA | . | . | . | . | . | . | . | . |
| MD | . | . | . | . | . | . | . | . |
| ME | . | . | . | . | . | . | . | . |
| MI | . | . | . | . | . | . | . | . |
| MN | 2.50 | 2.50 | 2.50 | 2.50 | 2.50 | 2.50 | 2.50 | 2.50 |
| MO | . | . | . | . | . | . | . | . |
| MS | . | . | . | . | . | . | . | . |
| MT | . | . | . | . | . | . | . | . |
| NC | 0.05 | 0.05 | 0.05 | 0.05 | 0.05 | 0.05 | 0.05 | 0.05 |
| ND | . | . | . | . | . | . | . | . |
| NE | . | . | . | . | . | . | . | . |
| NH | . | . | . | . | . | . | . | . |
| NJ | . | . | . | 0.10 | 0.10 | 0.10 | 0.10 | 0.30 |
| NM | . | . | . | . | . | . | 0.49 | 0.49 |
| NV | . | . | . | . | . | . | . | . |
| NY | . | . | . | . | . | . | . | 0.27 |
| OH | . | . | . | . | . | . | . | 0.10 |
| OK | . | . | . | . | . | . | . | . |
| OR | . | . | . | . | . | . | . | . |
| PA | 1.05 | 1.05 | 1.05 | 1.05 | 1.05 | 1.05 | 1.05 | 1.05 |
| RI | . | . | . | . | . | . | . | . |
| SC | . | . | . | . | . | . | . | . |
| SD | . | . | . | . | . | . | . | . |
| TN | . | . | . | . | . | . | . | . |
| TX | . | . | . | . | . | . | . | . |
| UT | . | . | . | . | . | . | . | . |
| VA | . | . | . | . | . | . | . | . |
| VT | . | . | . | . | . | . | 2.42 | 2.42 |
| WA | . | . | . | . | . | . | . | 0.27 |
| WI | . | . | . | . | . | . | . | 0.05 |
| WV | 0.08 | 0.08 | 0.08 | 0.08 | 0.08 | 0.08 | 0.08 | 0.08 |
| WY | . | . | . | . | . | . | . | . |
| Cook, IL | 0.90 | 0.90 | 0.90 | 0.90 | 1.44 | 1.44 | 1.84 | 1.84 |
| Mont., MD | 0.79 | 0.79 | 0.79 | 0.79 | 0.79 | 0.79 | 0.79 | 0.79 |
| Online Table 1F: E-cigarette Taxes by State/County from 2020, 35% Retailer Markup, Time-Invariant Tax Units | ||||||||
| Jurisdiction | Y2020Q1 | Y2020Q2 | Y2020Q3 | Y2020Q4 | ||||
| AL | . | . | . | . | ||||
| AK | . | . | . | . | ||||
| AR | . | . | . | . | ||||
| AZ | . | . | . | . | ||||
| CA | 1.56 | 1.56 | 1.50 | 1.50 | ||||
| CO | . | . | . | . | ||||
| CT | 0.40 | 0.40 | 0.40 | 0.40 | ||||
| DC | 2.53 | 2.53 | 2.53 | 2.53 | ||||
| DE | 0.05 | 0.05 | 0.05 | 0.05 | ||||
| FL | . | . | . | . | ||||
| GA | . | . | . | . | ||||
| HI | . | . | . | . | ||||
| IA | . | . | . | . | ||||
| ID | . | . | . | . | ||||
| IL | 0.39 | 0.39 | 0.39 | 0.39 | ||||
| IN | . | . | . | . | ||||
| KS | 0.05 | 0.05 | 0.05 | 0.05 | ||||
| KY | . | . | 0.98 | 1.48 | ||||
| LA | 0.05 | 0.05 | 0.05 | 0.05 | ||||
| MA | . | 0.66 | 1.97 | 1.97 | ||||
| MD | . | . | . | . | ||||
| ME | 1.13 | 1.13 | 1.13 | 1.13 | ||||
| MI | . | . | . | . | ||||
| MN | 2.50 | 2.50 | 2.50 | 2.50 | ||||
| MO | . | . | . | . | ||||
| MS | . | . | . | . | ||||
| MT | . | . | . | . | ||||
| NC | 0.05 | 0.05 | 0.05 | 0.05 | ||||
| ND | . | . | . | . | ||||
| NE | . | . | . | . | ||||
| NH | 0.30 | 0.30 | 0.30 | 0.30 | ||||
| NJ | 0.40 | 0.40 | 0.40 | 0.40 | ||||
| NM | 0.49 | 0.49 | 0.49 | 0.49 | ||||
| NV | 0.79 | 0.79 | 0.79 | 0.79 | ||||
| NY | 0.81 | 0.81 | 0.81 | 0.81 | ||||
| OH | 0.10 | 0.10 | 0.10 | 0.10 | ||||
| OK | . | . | . | . | ||||
| OR | . | . | . | . | ||||
| PA | 1.05 | 1.05 | 1.05 | 1.05 | ||||
| RI | . | . | . | . | ||||
| SC | . | . | . | . | ||||
| SD | . | . | . | . | ||||
| TN | . | . | . | . | ||||
| TX | . | . | . | . | ||||
| UT | . | . | 1.47 | 1.47 | ||||
| VA | . | . | 0.07 | 0.07 | ||||
| VT | 2.42 | 2.42 | 2.42 | 2.42 | ||||
| WA | 0.27 | 0.27 | 0.27 | 0.27 | ||||
| WI | 0.05 | 0.05 | 0.05 | 0.05 | ||||
| WV | 0.08 | 0.08 | 0.08 | 0.08 | ||||
| WY | . | . | 0.39 | 0.39 | ||||
| Cook, IL | 1.84 | 1.84 | 1.84 | 1.84 | ||||
| Mont., MD | 0.79 | 0.79 | 0.79 | 0.79 | ||||
Online Table 2:
E-cigarette Taxes by State/County from 2010 to 2020, 20% Retailer Markup, Time-Invariant Tax Units
| Online Table 2A: E-cigarette Taxes by State/County from 2010 to 2011, 20% Retailer Markup, Time-Invariant Tax Units | ||||||||
| Jurisdiction | Y2010Q1 | Y2010Q2 | Y2010Q3 | Y2010Q4 | Y2011Q1 | Y2011Q2 | Y2011Q3 | Y2011Q4 |
| AL | . | . | . | . | . | . | . | . |
| AK | . | . | . | . | . | . | . | . |
| AR | . | . | . | . | . | . | . | . |
| AZ | . | . | . | . | . | . | . | . |
| CA | . | . | . | . | . | . | . | . |
| CO | . | . | . | . | . | . | . | . |
| CT | . | . | . | . | . | . | . | . |
| DC | . | . | . | . | . | . | . | . |
| DE | . | . | . | . | . | . | . | . |
| FL | . | . | . | . | . | . | . | . |
| GA | . | . | . | . | . | . | . | . |
| HI | . | . | . | . | . | . | . | . |
| IA | . | . | . | . | . | . | . | . |
| ID | . | . | . | . | . | . | . | . |
| IL | . | . | . | . | . | . | . | . |
| IN | . | . | . | . | . | . | . | . |
| KS | . | . | . | . | . | . | . | . |
| KY | . | . | . | . | . | . | . | . |
| LA | . | . | . | . | . | . | . | . |
| MA | . | . | . | . | . | . | . | . |
| MD | . | . | . | . | . | . | . | . |
| ME | . | . | . | . | . | . | . | . |
| MI | . | . | . | . | . | . | . | . |
| MN | . | . | 0.76 | 1.13 | 1.13 | 1.13 | 1.13 | 1.13 |
| MO | . | . | . | . | . | . | . | . |
| MS | . | . | . | . | . | . | . | . |
| MT | . | . | . | . | . | . | . | . |
| NC | . | . | . | . | . | . | . | . |
| ND | . | . | . | . | . | . | . | . |
| NE | . | . | . | . | . | . | . | . |
| NH | . | . | . | . | . | . | . | . |
| NJ | . | . | . | . | . | . | . | . |
| NM | . | . | . | . | . | . | . | . |
| NV | . | . | . | . | . | . | . | . |
| NY | . | . | . | . | . | . | . | . |
| OH | . | . | . | . | . | . | . | . |
| OK | . | . | . | . | . | . | . | . |
| OR | . | . | . | . | . | . | . | . |
| PA | . | . | . | . | . | . | . | . |
| RI | . | . | . | . | . | . | . | . |
| SC | . | . | . | . | . | . | . | . |
| SD | . | . | . | . | . | . | . | . |
| TN | . | . | . | . | . | . | . | . |
| TX | . | . | . | . | . | . | . | . |
| UT | . | . | . | . | . | . | . | . |
| VA | . | . | . | . | . | . | . | . |
| VT | . | . | . | . | . | . | . | . |
| WA | . | . | . | . | . | . | . | . |
| WI | . | . | . | . | . | . | . | . |
| WV | . | . | . | . | . | . | . | . |
| WY | . | . | . | . | . | . | . | . |
| Cook, IL | . | . | . | . | . | . | . | . |
| Mont., MD | . | . | . | . | . | . | . | . |
| Online Table 2B: E-cigarette Taxes by State/County from 2012 to 2013, 20% Retailer Markup, Time-Invariant Tax Units | ||||||||
| Jurisdiction | Y2012Q1 | Y2012Q2 | Y2012Q3 | Y2012Q4 | Y2013Q1 | Y2013Q2 | Y2013Q3 | Y2013Q4 |
| AL | . | . | . | . | . | . | . | . |
| AK | . | . | . | . | . | . | . | . |
| AR | . | . | . | . | . | . | . | . |
| AZ | . | . | . | . | . | . | . | . |
| CA | . | . | . | . | . | . | . | . |
| CO | . | . | . | . | . | . | . | . |
| CT | . | . | . | . | . | . | . | . |
| DC | . | . | . | . | . | . | . | . |
| DE | . | . | . | . | . | . | . | . |
| FL | . | . | . | . | . | . | . | . |
| GA | . | . | . | . | . | . | . | . |
| HI | . | . | . | . | . | . | . | . |
| IA | . | . | . | . | . | . | . | . |
| ID | . | . | . | . | . | . | . | . |
| IL | . | . | . | . | . | . | . | . |
| IN | . | . | . | . | . | . | . | . |
| KS | . | . | . | . | . | . | . | . |
| KY | . | . | . | . | . | . | . | . |
| LA | . | . | . | . | . | . | . | . |
| MA | . | . | . | . | . | . | . | . |
| MD | . | . | . | . | . | . | . | . |
| ME | . | . | . | . | . | . | . | . |
| MI | . | . | . | . | . | . | . | . |
| MN | 1.13 | 1.13 | 1.13 | 1.13 | 1.13 | 1.13 | 3.08 | 3.08 |
| MO | . | . | . | . | . | . | . | . |
| MS | . | . | . | . | . | . | . | . |
| MT | . | . | . | . | . | . | . | . |
| NC | . | . | . | . | . | . | . | . |
| ND | . | . | . | . | . | . | . | . |
| NE | . | . | . | . | . | . | . | . |
| NH | . | . | . | . | . | . | . | . |
| NJ | . | . | . | . | . | . | . | . |
| NM | . | . | . | . | . | . | . | . |
| NV | . | . | . | . | . | . | . | . |
| NY | . | . | . | . | . | . | . | . |
| OH | . | . | . | . | . | . | . | . |
| OK | . | . | . | . | . | . | . | . |
| OR | . | . | . | . | . | . | . | . |
| PA | . | . | . | . | . | . | . | . |
| RI | . | . | . | . | . | . | . | . |
| SC | . | . | . | . | . | . | . | . |
| SD | . | . | . | . | . | . | . | . |
| TN | . | . | . | . | . | . | . | . |
| TX | . | . | . | . | . | . | . | . |
| UT | . | . | . | . | . | . | . | . |
| VA | . | . | . | . | . | . | . | . |
| VT | . | . | . | . | . | . | . | . |
| WA | . | . | . | . | . | . | . | . |
| WI | . | . | . | . | . | . | . | . |
| WV | . | . | . | . | . | . | . | . |
| WY | . | . | . | . | . | . | . | . |
| Cook, IL | . | . | . | . | . | . | . | . |
| Mont., MD | . | . | . | . | . | . | . | . |
| Online Table 2C: E-cigarette Taxes by State/County from 2014 to 2015, 20% Retailer Markup, Time-Invariant Tax Units | ||||||||
| Jurisdiction | Y2014Q1 | Y2014Q2 | Y2014Q3 | Y2014Q4 | Y2015Q1 | Y2015Q2 | Y2015Q3 | Y2015Q4 |
| AL | . | . | . | . | . | . | . | . |
| AK | . | . | . | . | . | . | . | . |
| AR | . | . | . | . | . | . | . | . |
| AZ | . | . | . | . | . | . | . | . |
| CA | . | . | . | . | . | . | . | . |
| CO | . | . | . | . | . | . | . | . |
| CT | . | . | . | . | . | . | . | . |
| DC | . | . | . | . | . | . | . | 2.17 |
| DE | . | . | . | . | . | . | . | . |
| FL | . | . | . | . | . | . | . | . |
| GA | . | . | . | . | . | . | . | . |
| HI | . | . | . | . | . | . | . | . |
| IA | . | . | . | . | . | . | . | . |
| ID | . | . | . | . | . | . | . | . |
| IL | . | . | . | . | . | . | . | . |
| IN | . | . | . | . | . | . | . | . |
| KS | . | . | . | . | . | . | . | . |
| KY | . | . | . | . | . | . | . | . |
| LA | . | . | . | . | . | . | 0.05 | 0.05 |
| MA | . | . | . | . | . | . | . | . |
| MD | . | . | . | . | . | . | . | . |
| ME | . | . | . | . | . | . | . | . |
| MI | . | . | . | . | . | . | . | . |
| MN | 3.08 | 3.08 | 3.08 | 3.08 | 3.08 | 3.08 | 3.08 | 3.08 |
| MO | . | . | . | . | . | . | . | . |
| MS | . | . | . | . | . | . | . | . |
| MT | . | . | . | . | . | . | . | . |
| NC | . | . | . | . | . | 0.02 | 0.05 | 0.05 |
| ND | . | . | . | . | . | . | . | . |
| NE | . | . | . | . | . | . | . | . |
| NH | . | . | . | . | . | . | . | . |
| NJ | . | . | . | . | . | . | . | . |
| NM | . | . | . | . | . | . | . | . |
| NV | . | . | . | . | . | . | . | . |
| NY | . | . | . | . | . | . | . | . |
| OH | . | . | . | . | . | . | . | . |
| OK | . | . | . | . | . | . | . | . |
| OR | . | . | . | . | . | . | . | . |
| PA | . | . | . | . | . | . | . | . |
| RI | . | . | . | . | . | . | . | . |
| SC | . | . | . | . | . | . | . | . |
| SD | . | . | . | . | . | . | . | . |
| TN | . | . | . | . | . | . | . | . |
| TX | . | . | . | . | . | . | . | . |
| UT | . | . | . | . | . | . | . | . |
| VA | . | . | . | . | . | . | . | . |
| VT | . | . | . | . | . | . | . | . |
| WA | . | . | . | . | . | . | . | . |
| WI | . | . | . | . | . | . | . | . |
| WV | . | . | . | . | . | . | . | . |
| WY | . | . | . | . | . | . | . | . |
| Cook, IL | . | . | . | . | . | . | . | . |
| Mont., MD | . | . | . | . | . | . | 0.65 | 0.97 |
| Online Table 2D: E-cigarette Taxes by State/County from 2016 to 2017, 20% Retailer Markup, Time-Invariant Tax Units | ||||||||
| Jurisdiction | Y2016Q1 | Y2016Q2 | Y2016Q3 | Y2016Q4 | Y2017Q1 | Y2017Q2 | Y2017Q3 | Y2017Q4 |
| AL | . | . | . | . | . | . | . | . |
| AK | . | . | . | . | . | . | . | . |
| AR | . | . | . | . | . | . | . | . |
| AZ | . | . | . | . | . | . | . | . |
| CA | . | . | . | . | . | 0.88 | 2.11 | 2.11 |
| CO | . | . | . | . | . | . | . | . |
| CT | . | . | . | . | . | . | . | . |
| DC | 2.17 | 2.17 | 2.17 | 2.11 | 2.11 | 2.11 | 2.11 | 1.94 |
| DE | . | . | . | . | . | . | . | . |
| FL | . | . | . | . | . | . | . | . |
| GA | . | . | . | . | . | . | . | . |
| HI | . | . | . | . | . | . | . | . |
| IA | . | . | . | . | . | . | . | . |
| ID | . | . | . | . | . | . | . | . |
| IL | . | . | . | . | . | . | . | . |
| IN | . | . | . | . | . | . | . | . |
| KS | . | . | . | . | 0.20 | 0.20 | 0.05 | 0.05 |
| KY | . | . | . | . | . | . | . | . |
| LA | 0.05 | 0.05 | 0.05 | 0.05 | 0.05 | 0.05 | 0.05 | 0.05 |
| MA | . | . | . | . | . | . | . | . |
| MD | . | . | . | . | . | . | . | . |
| ME | . | . | . | . | . | . | . | . |
| MI | . | . | . | . | . | . | . | . |
| MN | 3.08 | 3.08 | 3.08 | 3.08 | 3.08 | 3.08 | 3.08 | 3.08 |
| MO | . | . | . | . | . | . | . | . |
| MS | . | . | . | . | . | . | . | . |
| MT | . | . | . | . | . | . | . | . |
| NC | 0.05 | 0.05 | 0.05 | 0.05 | 0.05 | 0.05 | 0.05 | 0.05 |
| ND | . | . | . | . | . | . | . | . |
| NE | . | . | . | . | . | . | . | . |
| NH | . | . | . | . | . | . | . | . |
| NJ | . | . | . | . | . | . | . | . |
| NM | . | . | . | . | . | . | . | . |
| NV | . | . | . | . | . | . | . | . |
| NY | . | . | . | . | . | . | . | . |
| OH | . | . | . | . | . | . | . | . |
| OK | . | . | . | . | . | . | . | . |
| OR | . | . | . | . | . | . | . | . |
| PA | . | . | 1.30 | 1.30 | 1.30 | 1.30 | 1.30 | 1.30 |
| RI | . | . | . | . | . | . | . | . |
| SC | . | . | . | . | . | . | . | . |
| SD | . | . | . | . | . | . | . | . |
| TN | . | . | . | . | . | . | . | . |
| TX | . | . | . | . | . | . | . | . |
| UT | . | . | . | . | . | . | . | . |
| VA | . | . | . | . | . | . | . | . |
| VT | . | . | . | . | . | . | . | . |
| WA | . | . | . | . | . | . | . | . |
| WI | . | . | . | . | . | . | . | . |
| WV | . | . | 0.08 | 0.08 | 0.08 | 0.08 | 0.08 | 0.08 |
| WY | . | . | . | . | . | . | . | . |
| Cook, IL | 0.70 | 0.83 | 0.90 | 0.90 | 0.90 | 0.90 | 0.90 | 0.90 |
| Mont., MD | 0.97 | 0.97 | 0.97 | 0.97 | 0.97 | 0.97 | 0.97 | 0.97 |
| Online Table 2E: E-cigarette Taxes by State/County from 2018 to 2019, 20% Retailer Markup, Time-Invariant Tax Units | ||||||||
| Jurisdiction | Y2018Q1 | Y2018Q2 | Y2018Q3 | Y2018Q4 | Y2019Q1 | Y2019Q2 | Y2019Q3 | Y2019Q4 |
| AL | . | . | . | . | . | . | . | . |
| AK | . | . | . | . | . | . | . | . |
| AR | . | . | . | . | . | . | . | . |
| AZ | . | . | . | . | . | . | . | . |
| CA | 2.11 | 2.11 | 2.03 | 2.03 | 2.03 | 2.03 | 1.92 | 1.92 |
| CO | . | . | . | . | . | . | . | . |
| CT | . | . | . | . | . | . | . | 0.40 |
| DC | 1.94 | 1.94 | 1.94 | 3.11 | 3.11 | 3.11 | 3.11 | 3.11 |
| DE | 0.05 | 0.05 | 0.05 | 0.05 | 0.05 | 0.05 | 0.05 | 0.05 |
| FL | . | . | . | . | . | . | . | . |
| GA | . | . | . | . | . | . | . | . |
| HI | . | . | . | . | . | . | . | . |
| IA | . | . | . | . | . | . | . | . |
| ID | . | . | . | . | . | . | . | . |
| IL | . | . | . | . | . | . | 0.49 | 0.49 |
| IN | . | . | . | . | . | . | . | . |
| KS | 0.05 | 0.05 | 0.05 | 0.05 | 0.05 | 0.05 | 0.05 | 0.05 |
| KY | . | . | . | . | . | . | . | . |
| LA | 0.05 | 0.05 | 0.05 | 0.05 | 0.05 | 0.05 | 0.05 | 0.05 |
| MA | . | . | . | . | . | . | . | . |
| MD | . | . | . | . | . | . | . | . |
| ME | . | . | . | . | . | . | . | . |
| MI | . | . | . | . | . | . | . | . |
| MN | 3.08 | 3.08 | 3.08 | 3.08 | 3.08 | 3.08 | 3.08 | 3.08 |
| MO | . | . | . | . | . | . | . | . |
| MS | . | . | . | . | . | . | . | . |
| MT | . | . | . | . | . | . | . | . |
| NC | 0.05 | 0.05 | 0.05 | 0.05 | 0.05 | 0.05 | 0.05 | 0.05 |
| ND | . | . | . | . | . | . | . | . |
| NE | . | . | . | . | . | . | . | . |
| NH | . | . | . | . | . | . | . | . |
| NJ | . | . | . | 0.10 | 0.10 | 0.10 | 0.10 | 0.30 |
| NM | . | . | . | . | . | . | 0.49 | 0.49 |
| NV | . | . | . | . | . | . | . | . |
| NY | . | . | . | . | . | . | . | 0.27 |
| OH | . | . | . | . | . | . | . | 0.10 |
| OK | . | . | . | . | . | . | . | . |
| OR | . | . | . | . | . | . | . | . |
| PA | 1.30 | 1.30 | 1.30 | 1.30 | 1.30 | 1.30 | 1.30 | 1.30 |
| RI | . | . | . | . | . | . | . | . |
| SC | . | . | . | . | . | . | . | . |
| SD | . | . | . | . | . | . | . | . |
| TN | . | . | . | . | . | . | . | . |
| TX | . | . | . | . | . | . | . | . |
| UT | . | . | . | . | . | . | . | . |
| VA | . | . | . | . | . | . | . | . |
| VT | . | . | . | . | . | . | 2.98 | 2.98 |
| WA | . | . | . | . | . | . | . | 0.27 |
| WI | . | . | . | . | . | . | . | 0.05 |
| WV | 0.08 | 0.08 | 0.08 | 0.08 | 0.08 | 0.08 | 0.08 | 0.08 |
| WY | . | . | . | . | . | . | . | . |
| Cook, IL | 0.90 | 0.90 | 0.90 | 0.90 | 1.44 | 1.44 | 1.93 | 1.93 |
| Mont., MD | 0.97 | 0.97 | 0.97 | 0.97 | 0.97 | 0.97 | 0.97 | 0.97 |
| Online Table 2F: E-cigarette Taxes by State/County from 2020, 20% Retailer Markup, Time-Invariant Tax Units | ||||||||
| Jurisdiction | Y2020Q1 | Y2020Q2 | Y2020Q3 | Y2020Q4 | ||||
| AL | . | . | . | . | ||||
| AK | . | . | . | . | ||||
| AR | . | . | . | . | ||||
| AZ | . | . | . | . | ||||
| CA | 1.92 | 1.92 | 1.84 | 1.84 | ||||
| CO | . | . | . | . | ||||
| CT | 0.40 | 0.40 | 0.40 | 0.40 | ||||
| DC | 3.11 | 3.11 | 3.11 | 3.11 | ||||
| DE | 0.05 | 0.05 | 0.05 | 0.05 | ||||
| FL | . | . | . | . | ||||
| GA | . | . | . | . | ||||
| HI | . | . | . | . | ||||
| IA | . | . | . | . | ||||
| ID | . | . | . | . | ||||
| IL | 0.49 | 0.49 | 0.49 | 0.49 | ||||
| IN | . | . | . | . | ||||
| KS | 0.05 | 0.05 | 0.05 | 0.05 | ||||
| KY | . | . | 0.98 | 1.48 | ||||
| LA | 0.05 | 0.05 | 0.05 | 0.05 | ||||
| MA | . | 0.81 | 2.43 | 2.43 | ||||
| MD | . | . | . | . | ||||
| ME | 1.39 | 1.39 | 1.39 | 1.39 | ||||
| MI | . | . | . | . | ||||
| MN | 3.08 | 3.08 | 3.08 | 3.08 | ||||
| MO | . | . | . | . | ||||
| MS | . | . | . | . | ||||
| MT | . | . | . | . | ||||
| NC | 0.05 | 0.05 | 0.05 | 0.05 | ||||
| ND | . | . | . | . | ||||
| NE | . | . | . | . | ||||
| NH | 0.30 | 0.30 | 0.30 | 0.30 | ||||
| NJ | 0.40 | 0.40 | 0.40 | 0.40 | ||||
| NM | 0.49 | 0.49 | 0.49 | 0.49 | ||||
| NV | 0.97 | 0.97 | 0.97 | 0.97 | ||||
| NY | 0.81 | 0.81 | 0.81 | 0.81 | ||||
| OH | 0.10 | 0.10 | 0.10 | 0.10 | ||||
| OK | . | . | . | . | ||||
| OR | . | . | . | . | ||||
| PA | 1.30 | 1.30 | 1.30 | 1.30 | ||||
| RI | . | . | . | . | ||||
| SC | . | . | . | . | ||||
| SD | . | . | . | . | ||||
| TN | . | . | . | . | ||||
| TX | . | . | . | . | ||||
| UT | . | . | 1.81 | 1.81 | ||||
| VA | . | . | 0.07 | 0.07 | ||||
| VT | 2.98 | 2.98 | 2.98 | 2.98 | ||||
| WA | 0.27 | 0.27 | 0.27 | 0.27 | ||||
| WI | 0.05 | 0.05 | 0.05 | 0.05 | ||||
| WV | 0.08 | 0.08 | 0.08 | 0.08 | ||||
| WY | . | . | 0.49 | 0.49 | ||||
| Cook, IL | 1.93 | 1.93 | 1.93 | 1.93 | ||||
| Mont., MD | 0.97 | 0.97 | 0.97 | 0.97 | ||||
Online Table 3:
E-cigarette Taxes by State/County from 2010 to 2020, 35% Retailer Markup, Time-Varying Tax Units
| Online Table 3A: E-cigarette Taxes by State/County from 2010 to 2011, 35% Retailer Markup, Time-Varying Tax Units | ||||||||
| Jurisdiction | Y2010Q1 | Y2010Q2 | Y2010Q3 | Y2010Q4 | Y2011Q1 | Y2011Q2 | Y2011Q3 | Y2011Q4 |
| AL | . | . | . | . | . | . | . | . |
| AK | . | . | . | . | . | . | . | . |
| AR | . | . | . | . | . | . | . | . |
| AZ | . | . | . | . | . | . | . | . |
| CA | . | . | . | . | . | . | . | . |
| CO | . | . | . | . | . | . | . | . |
| CT | . | . | . | . | . | . | . | . |
| DC | . | . | . | . | . | . | . | . |
| DE | . | . | . | . | . | . | . | . |
| FL | . | . | . | . | . | . | . | . |
| GA | . | . | . | . | . | . | . | . |
| HI | . | . | . | . | . | . | . | . |
| IA | . | . | . | . | . | . | . | . |
| ID | . | . | . | . | . | . | . | . |
| IL | . | . | . | . | . | . | . | . |
| IN | . | . | . | . | . | . | . | . |
| KS | . | . | . | . | . | . | . | . |
| KY | . | . | . | . | . | . | . | . |
| LA | . | . | . | . | . | . | . | . |
| MA | . | . | . | . | . | . | . | . |
| MD | . | . | . | . | . | . | . | . |
| ME | . | . | . | . | . | . | . | . |
| MI | . | . | . | . | . | . | . | . |
| MN | . | . | 0.61 | 0.91 | 0.91 | 0.92 | 0.97 | 1.28 |
| MO | . | . | . | . | . | . | . | . |
| MS | . | . | . | . | . | . | . | . |
| MT | . | . | . | . | . | . | . | . |
| NC | . | . | . | . | . | . | . | . |
| ND | . | . | . | . | . | . | . | . |
| NE | . | . | . | . | . | . | . | . |
| NH | . | . | . | . | . | . | . | . |
| NJ | . | . | . | . | . | . | . | . |
| NM | . | . | . | . | . | . | . | . |
| NV | . | . | . | . | . | . | . | . |
| NY | . | . | . | . | . | . | . | . |
| OH | . | . | . | . | . | . | . | . |
| OK | . | . | . | . | . | . | . | . |
| OR | . | . | . | . | . | . | . | . |
| PA | . | . | . | . | . | . | . | . |
| RI | . | . | . | . | . | . | . | . |
| SC | . | . | . | . | . | . | . | . |
| SD | . | . | . | . | . | . | . | . |
| TN | . | . | . | . | . | . | . | . |
| TX | . | . | . | . | . | . | . | . |
| UT | . | . | . | . | . | . | . | . |
| VA | . | . | . | . | . | . | . | . |
| VT | . | . | . | . | . | . | . | . |
| WA | . | . | . | . | . | . | . | . |
| WI | . | . | . | . | . | . | . | . |
| WV | . | . | . | . | . | . | . | . |
| WY | . | . | . | . | . | . | . | . |
| Cook, IL | . | . | . | . | . | . | . | . |
| Mont., MD | . | . | . | . | . | . | . | . |
| Online Table 3B: E-cigarette Taxes by State/County from 2012 to 2013, 35% Retailer Markup, Time-Varying Tax Units | ||||||||
| Jurisdiction | Y2012Q1 | Y2012Q2 | Y2012Q3 | Y2012Q4 | Y2013Q1 | Y2013Q2 | Y2013Q3 | Y2013Q4 |
| AL | . | . | . | . | . | . | . | . |
| AK | . | . | . | . | . | . | . | . |
| AR | . | . | . | . | . | . | . | . |
| AZ | . | . | . | . | . | . | . | . |
| CA | . | . | . | . | . | . | . | . |
| CO | . | . | . | . | . | . | . | . |
| CT | . | . | . | . | . | . | . | . |
| DC | . | . | . | . | . | . | . | . |
| DE | . | . | . | . | . | . | . | . |
| FL | . | . | . | . | . | . | . | . |
| GA | . | . | . | . | . | . | . | . |
| HI | . | . | . | . | . | . | . | . |
| IA | . | . | . | . | . | . | . | . |
| ID | . | . | . | . | . | . | . | . |
| IL | . | . | . | . | . | . | . | . |
| IN | . | . | . | . | . | . | . | . |
| KS | . | . | . | . | . | . | . | . |
| KY | . | . | . | . | . | . | . | . |
| LA | . | . | . | . | . | . | . | . |
| MA | . | . | . | . | . | . | . | . |
| MD | . | . | . | . | . | . | . | . |
| ME | . | . | . | . | . | . | . | . |
| MI | . | . | . | . | . | . | . | . |
| MN | 1.22 | 1.19 | 1.16 | 1.07 | 0.94 | 0.87 | 2.47 | 2.62 |
| MO | . | . | . | . | . | . | . | . |
| MS | . | . | . | . | . | . | . | . |
| MT | . | . | . | . | . | . | . | . |
| NC | . | . | . | . | . | . | . | . |
| ND | . | . | . | . | . | . | . | . |
| NE | . | . | . | . | . | . | . | . |
| NH | . | . | . | . | . | . | . | . |
| NJ | . | . | . | . | . | . | . | . |
| NM | . | . | . | . | . | . | . | . |
| NV | . | . | . | . | . | . | . | . |
| NY | . | . | . | . | . | . | . | . |
| OH | . | . | . | . | . | . | . | . |
| OK | . | . | . | . | . | . | . | . |
| OR | . | . | . | . | . | . | . | . |
| PA | . | . | . | . | . | . | . | . |
| RI | . | . | . | . | . | . | . | . |
| SC | . | . | . | . | . | . | . | . |
| SD | . | . | . | . | . | . | . | . |
| TN | . | . | . | . | . | . | . | . |
| TX | . | . | . | . | . | . | . | . |
| UT | . | . | . | . | . | . | . | . |
| VA | . | . | . | . | . | . | . | . |
| VT | . | . | . | . | . | . | . | . |
| WA | . | . | . | . | . | . | . | . |
| WI | . | . | . | . | . | . | . | . |
| WV | . | . | . | . | . | . | . | . |
| WY | . | . | . | . | . | . | . | . |
| Cook, IL | . | . | . | . | . | . | . | . |
| Mont., MD | . | . | . | . | . | . | . | . |
| Online Table 3C: E-cigarette Taxes by State/County from 2014 to 2015, 35% Retailer Markup, Time-Varying Tax Units | ||||||||
| Jurisdiction | Y2014Q1 | Y2014Q2 | Y2014Q3 | Y2014Q4 | Y2015Q1 | Y2015Q2 | Y2015Q3 | Y2015Q4 |
| AL | . | . | . | . | . | . | . | . |
| AK | . | . | . | . | . | . | . | . |
| AR | . | . | . | . | . | . | . | . |
| AZ | . | . | . | . | . | . | . | . |
| CA | . | . | . | . | . | . | . | . |
| CO | . | . | . | . | . | . | . | . |
| CT | . | . | . | . | . | . | . | . |
| DC | . | . | . | . | . | . | . | 1.51 |
| DE | . | . | . | . | . | . | . | . |
| FL | . | . | . | . | . | . | . | . |
| GA | . | . | . | . | . | . | . | . |
| HI | . | . | . | . | . | . | . | . |
| IA | . | . | . | . | . | . | . | . |
| ID | . | . | . | . | . | . | . | . |
| IL | . | . | . | . | . | . | . | . |
| IN | . | . | . | . | . | . | . | . |
| KS | . | . | . | . | . | . | . | . |
| KY | . | . | . | . | . | . | . | . |
| LA | . | . | . | . | . | . | 0.05 | 0.05 |
| MA | . | . | . | . | . | . | . | . |
| MD | . | . | . | . | . | . | . | . |
| ME | . | . | . | . | . | . | . | . |
| MI | . | . | . | . | . | . | . | . |
| MN | 2.69 | 2.57 | 2.76 | 2.34 | 2.32 | 2.23 | 1.88 | 2.14 |
| MO | . | . | . | . | . | . | . | . |
| MS | . | . | . | . | . | . | . | . |
| MT | . | . | . | . | . | . | . | . |
| NC | . | . | . | . | . | 0.02 | 0.05 | 0.05 |
| ND | . | . | . | . | . | . | . | . |
| NE | . | . | . | . | . | . | . | . |
| NH | . | . | . | . | . | . | . | . |
| NJ | . | . | . | . | . | . | . | . |
| NM | . | . | . | . | . | . | . | . |
| NV | . | . | . | . | . | . | . | . |
| NY | . | . | . | . | . | . | . | . |
| OH | . | . | . | . | . | . | . | . |
| OK | . | . | . | . | . | . | . | . |
| OR | . | . | . | . | . | . | . | . |
| PA | . | . | . | . | . | . | . | . |
| RI | . | . | . | . | . | . | . | . |
| SC | . | . | . | . | . | . | . | . |
| SD | . | . | . | . | . | . | . | . |
| TN | . | . | . | . | . | . | . | . |
| TX | . | . | . | . | . | . | . | . |
| UT | . | . | . | . | . | . | . | . |
| VA | . | . | . | . | . | . | . | . |
| VT | . | . | . | . | . | . | . | . |
| WA | . | . | . | . | . | . | . | . |
| WI | . | . | . | . | . | . | . | . |
| WV | . | . | . | . | . | . | . | . |
| WY | . | . | . | . | . | . | . | . |
| Cook, IL | . | . | . | . | . | . | . | . |
| Mont., MD | . | . | . | . | . | . | 0.40 | 0.68 |
| Online Table 3D: E-cigarette Taxes by State/County from 2016 to 2017, 35% Retailer Markup, Time-Varying Tax Units | ||||||||
| Jurisdiction | Y2016Q1 | Y2016Q2 | Y2016Q3 | Y2016Q4 | Y2017Q1 | Y2017Q2 | Y2017Q3 | Y2017Q4 |
| AL | . | . | . | . | . | . | . | . |
| AK | . | . | . | . | . | . | . | . |
| AR | . | . | . | . | . | . | . | . |
| AZ | . | . | . | . | . | . | . | . |
| CA | . | . | . | . | . | 0.70 | 1.80 | 1.86 |
| CO | . | . | . | . | . | . | . | . |
| CT | . | . | . | . | . | . | . | . |
| DC | 1.48 | 1.51 | 1.59 | 1.65 | 1.75 | 1.68 | 1.80 | 1.71 |
| DE | . | . | . | . | . | . | . | . |
| FL | . | . | . | . | . | . | . | . |
| GA | . | . | . | . | . | . | . | . |
| HI | . | . | . | . | . | . | . | . |
| IA | . | . | . | . | . | . | . | . |
| ID | . | . | . | . | . | . | . | . |
| IL | . | . | . | . | . | . | . | . |
| IN | . | . | . | . | . | . | . | . |
| KS | . | . | . | . | 0.20 | 0.20 | 0.05 | 0.05 |
| KY | . | . | . | . | . | . | . | . |
| LA | 0.05 | 0.05 | 0.05 | 0.05 | 0.05 | 0.05 | 0.05 | 0.05 |
| MA | . | . | . | . | . | . | . | . |
| MD | . | . | . | . | . | . | . | . |
| ME | . | . | . | . | . | . | . | . |
| MI | . | . | . | . | . | . | . | . |
| MN | 2.09 | 2.15 | 2.25 | 2.42 | 2.56 | 2.45 | 2.63 | 2.72 |
| MO | . | . | . | . | . | . | . | . |
| MS | . | . | . | . | . | . | . | . |
| MT | . | . | . | . | . | . | . | . |
| NC | 0.05 | 0.05 | 0.05 | 0.05 | 0.05 | 0.05 | 0.05 | 0.05 |
| ND | . | . | . | . | . | . | . | . |
| NE | . | . | . | . | . | . | . | . |
| NH | . | . | . | . | . | . | . | . |
| NJ | . | . | . | . | . | . | . | . |
| NM | . | . | . | . | . | . | . | . |
| NV | . | . | . | . | . | . | . | . |
| NY | . | . | . | . | . | . | . | . |
| OH | . | . | . | . | . | . | . | . |
| OK | . | . | . | . | . | . | . | . |
| OR | . | . | . | . | . | . | . | . |
| PA | . | . | 0.95 | 1.02 | 1.08 | 1.03 | 1.11 | 1.14 |
| RI | . | . | . | . | . | . | . | . |
| SC | . | . | . | . | . | . | . | . |
| SD | . | . | . | . | . | . | . | . |
| TN | . | . | . | . | . | . | . | . |
| TX | . | . | . | . | . | . | . | . |
| UT | . | . | . | . | . | . | . | . |
| VA | . | . | . | . | . | . | . | . |
| VT | . | . | . | . | . | . | . | . |
| WA | . | . | . | . | . | . | . | . |
| WI | . | . | . | . | . | . | . | . |
| WV | . | . | 0.08 | 0.08 | 0.08 | 0.08 | 0.08 | 0.08 |
| WY | . | . | . | . | . | . | . | . |
| Cook, IL | 0.62 | 0.74 | 0.82 | 0.82 | 0.83 | 0.83 | 0.83 | 0.84 |
| Mont., MD | 0.66 | 0.68 | 0.71 | 0.76 | 0.81 | 0.77 | 0.83 | 0.86 |
| Online Table 3E: E-cigarette Taxes by State/County from 2018 to 2019, 35% Retailer Markup, Time-Varying Tax Units | ||||||||
| Jurisdiction | Y2018Q1 | Y2018Q2 | Y2018Q3 | Y2018Q4 | Y2019Q1 | Y2019Q2 | Y2019Q3 | Y2019Q4 |
| AL | . | . | . | . | . | . | . | . |
| AK | . | . | . | . | . | . | . | . |
| AR | . | . | . | . | . | . | . | . |
| AZ | . | . | . | . | . | . | . | . |
| CA | 2.10 | 2.24 | 2.21 | 2.25 | 2.24 | 2.14 | 1.75 | 1.67 |
| CO | . | . | . | . | . | . | . | . |
| CT | . | . | . | . | . | . | . | 0.40 |
| DC | 1.94 | 2.07 | 2.11 | 3.44 | 3.42 | 3.28 | 2.84 | 2.70 |
| DE | 0.05 | 0.05 | 0.05 | 0.05 | 0.05 | 0.05 | 0.05 | 0.05 |
| FL | . | . | . | . | . | . | . | . |
| GA | . | . | . | . | . | . | . | . |
| HI | . | . | . | . | . | . | . | . |
| IA | . | . | . | . | . | . | . | . |
| ID | . | . | . | . | . | . | . | . |
| IL | . | . | . | . | . | . | 0.44 | 0.42 |
| IN | . | . | . | . | . | . | . | . |
| KS | 0.05 | 0.05 | 0.05 | 0.05 | 0.05 | 0.05 | 0.05 | 0.05 |
| KY | . | . | . | . | . | . | . | . |
| LA | 0.05 | 0.05 | 0.05 | 0.05 | 0.05 | 0.05 | 0.05 | 0.05 |
| MA | . | . | . | . | . | . | . | . |
| MD | . | . | . | . | . | . | . | . |
| ME | . | . | . | . | . | . | . | . |
| MI | . | . | . | . | . | . | . | . |
| MN | 3.06 | 3.28 | 3.35 | 3.41 | 3.38 | 3.24 | 2.81 | 2.67 |
| MO | . | . | . | . | . | . | . | . |
| MS | . | . | . | . | . | . | . | . |
| MT | . | . | . | . | . | . | . | . |
| NC | 0.05 | 0.05 | 0.05 | 0.05 | 0.05 | 0.05 | 0.05 | 0.05 |
| ND | . | . | . | . | . | . | . | . |
| NE | . | . | . | . | . | . | . | . |
| NH | . | . | . | . | . | . | . | . |
| NJ | . | . | . | 0.10 | 0.10 | 0.10 | 0.10 | 0.32 |
| NM | . | . | . | . | . | . | 0.49 | 0.47 |
| NV | . | . | . | . | . | . | . | . |
| NY | . | . | . | . | . | . | . | 0.29 |
| OH | . | . | . | . | . | . | . | 0.10 |
| OK | . | . | . | . | . | . | . | . |
| OR | . | . | . | . | . | . | . | . |
| PA | 1.29 | 1.38 | 1.41 | 1.43 | 1.42 | 1.37 | 1.18 | 1.12 |
| RI | . | . | . | . | . | . | . | . |
| SC | . | . | . | . | . | . | . | . |
| SD | . | . | . | . | . | . | . | . |
| TN | . | . | . | . | . | . | . | . |
| TX | . | . | . | . | . | . | . | . |
| UT | . | . | . | . | . | . | . | . |
| VA | . | . | . | . | . | . | . | . |
| VT | . | . | . | . | . | . | 2.72 | 2.59 |
| WA | . | . | . | . | . | . | . | 0.27 |
| WI | . | . | . | . | . | . | . | 0.05 |
| WV | 0.08 | 0.08 | 0.08 | 0.08 | 0.08 | 0.08 | 0.08 | 0.08 |
| WY | . | . | . | . | . | . | . | . |
| Cook, IL | 0.93 | 0.98 | 1.00 | 1.00 | 1.58 | 1.54 | 1.88 | 1.83 |
| Mont., MD | 0.97 | 1.03 | 1.06 | 1.08 | 1.07 | 1.02 | 0.89 | 0.84 |
| Online Table 3F: E-cigarette Taxes by State/County from 2020, 35% Retailer Markup, Time-Varying Tax Units | ||||||||
| Jurisdiction | Y2020Q1 | Y2020Q2 | Y2020Q3 | Y2020Q4 | ||||
| AL | . | . | . | . | ||||
| AK | . | . | . | . | ||||
| AR | . | . | . | . | ||||
| AZ | . | . | . | . | ||||
| CA | 1.67 | 1.67 | 1.60 | 1.60 | ||||
| CO | . | . | . | . | ||||
| CT | 0.40 | 0.40 | 0.40 | 0.40 | ||||
| DC | 2.70 | 2.70 | 2.70 | 2.70 | ||||
| DE | 0.05 | 0.05 | 0.05 | 0.05 | ||||
| FL | . | . | . | . | ||||
| GA | . | . | . | . | ||||
| HI | . | . | . | . | ||||
| IA | . | . | . | . | ||||
| ID | . | . | . | . | ||||
| IL | 0.42 | 0.42 | 0.42 | 0.42 | ||||
| IN | . | . | . | . | ||||
| KS | 0.05 | 0.05 | 0.05 | 0.05 | ||||
| KY | . | . | 0.93 | 1.40 | ||||
| LA | 0.05 | 0.05 | 0.05 | 0.05 | ||||
| MA | . | 0.70 | 2.11 | 2.11 | ||||
| MD | . | . | . | . | ||||
| ME | 1.21 | 1.21 | 1.21 | 1.21 | ||||
| MI | . | . | . | . | ||||
| MN | 2.67 | 2.67 | 2.67 | 2.67 | ||||
| MO | . | . | . | . | ||||
| MS | . | . | . | . | ||||
| MT | . | . | . | . | ||||
| NC | 0.05 | 0.05 | 0.05 | 0.05 | ||||
| ND | . | . | . | . | ||||
| NE | . | . | . | . | ||||
| NH | 0.30 | 0.30 | 0.30 | 0.30 | ||||
| NJ | 0.43 | 0.43 | 0.43 | 0.43 | ||||
| NM | 0.47 | 0.47 | 0.47 | 0.47 | ||||
| NV | 0.84 | 0.84 | 0.84 | 0.84 | ||||
| NY | 0.86 | 0.86 | 0.86 | 0.86 | ||||
| OH | 0.10 | 0.10 | 0.10 | 0.10 | ||||
| OK | . | . | . | . | ||||
| OR | . | . | . | . | ||||
| PA | 1.12 | 1.12 | 1.12 | 1.12 | ||||
| RI | . | . | . | . | ||||
| SC | . | . | . | . | ||||
| SD | . | . | . | . | ||||
| TN | . | . | . | . | ||||
| TX | . | . | . | . | ||||
| UT | . | . | 1.57 | 1.57 | ||||
| VA | . | . | 0.07 | 0.07 | ||||
| VT | 2.59 | 2.59 | 2.59 | 2.59 | ||||
| WA | 0.27 | 0.27 | 0.27 | 0.27 | ||||
| WI | 0.05 | 0.05 | 0.05 | 0.05 | ||||
| WV | 0.08 | 0.08 | 0.08 | 0.08 | ||||
| WY | . | . | 0.42 | 0.42 | ||||
| Cook, IL | 1.83 | 1.83 | 1.83 | 1.83 | ||||
| Mont., MD | 0.84 | 0.84 | 0.84 | 0.84 | ||||
Footnotes
Competing Interests: Drs. Pesko and Phillips are supported in their work on this manuscript by R01DA045016 from the National Institute on Drug Abuse of the National Institutes of Health.
All online tables are available as an Excel file here, or by sending a request to mpesko@gsu.edu.
References
- 1.Pesko M, Warman C. Re-exploring the early relationship between teenage cigarette and e-cigarette use using price and tax changes, 2021. Health Economics. [DOI] [PMC free article] [PubMed] [Google Scholar]
- 2.Centers for Disease Control and Prevention. Tobacco Product Use Among Adults — United States, 2017. Morbidity and Mortality Weekly Report. 2018;67(44):1225–1232. [DOI] [PMC free article] [PubMed] [Google Scholar]
- 3.Abouk R, Adams S, Feng B, Maclean JC, Pesko MF. The Effect of E-Cigarette Taxes on Pre-Pregnancy and Prenatal Smoking, and Birth Outcomes. NBER Working Paper No 26126. 2020. [Google Scholar]
- 4.Cotti CD, Courtemanche C, Maclean C, Nesson E, Pesko M, Tefft N. The Effects of E-Cigarette Taxes on E-Cigarette Prices and Tobacco Product Sales: Evidence from Retail Panel Data. NBER Working Paper No 26724. 2020. [DOI] [PMC free article] [PubMed] [Google Scholar]
- 5.Pesko MF, Courtemanche CJ, Maclean JC. The Effects of Traditional Cigarette and E-Cigarette Taxes on Adult Tobacco Product Use. Journal of Risk and Uncertainty. 2020;60(3):229–258. [DOI] [PMC free article] [PubMed] [Google Scholar]
- 6.States & Territories with Laws Taxing E-Cigarettes Enacted as of March 15, 2021. Public Health Law Center at the Mitchell Hamline School of Law; 2021. https://www.publichealthlawcenter.org/sites/default/files/States-with-Laws-Taxing-ECigarettes-March2021.pdf.
- 7.Cotti C, Nesson E, Tefft N. The Effects of Tobacco Control Policies on Tobacco Products, Tar, and Nicotine Purchases among Adults: Evidence from Household Panel Data. American Economic Journal: Economic Policy. 2016;8(4):103–123. [Google Scholar]
- 8.Chaloupka FJ, Tauras JA. Taxation of emerging tobacco products. Tobacconomics. 2020. https://tobacconomics.org/uploads/misc/2020/02/Emer.-Tob.-Tax.-Report-Relayout.pdf. [Google Scholar]
- 9.Truth Initative. How much nicotine is in JUUL? 2021; https://truthinitiative.org/research-resources/emerging-tobacco-products/how-much-nicotine-juul. Accessed 5/5/2021.
- 10.Cunningham S Causal Inference, The Mixtape. Vol 1. New Haven, CT: Yale University Press; 2021. [Google Scholar]
- 11.Pesko MF, Tauras JA, Huang J, Chaloupka FJ. The Influence of Geography and Measurement in Estimating Cigarette Price Responsiveness. National Bureau of Economic Research Working Paper Series. 2016;No. 22296. [Google Scholar]
- 12.Chaloupka FJ, Sweanor D, Warner KE. Differential Taxes for Differential Risks--Toward Reduced Harm from Nicotine-Yielding Products. New England Journal of Medicine. 2015;373:594–597. [DOI] [PubMed] [Google Scholar]
- 13.Sindelar J Regulating Vaping — Policies, Possibilities, and Perils. New England Journal of Medicine. 2020;382:e54. [DOI] [PubMed] [Google Scholar]
- 14.Balfour DJ, Benowitz NL, Colby SM, et al. Balancing Consideration of the Risks and Benefits of E-Cigarettes. American Journal of Public Health. 2021(0):e1–e12. [DOI] [PMC free article] [PubMed] [Google Scholar]
- 15.Allcott H, Rafkin C. Optimal Regulation of E-cigarettes: Theory and Evidence. NBER Working Paper No 27000. 2021. [Google Scholar]
- 16.Abouk R, Courtemanche CJ, Dave DM, et al. Intended and Unintended Effects of E-cigarette Taxes on Youth Tobacco Use. NBER Working Paper No 29216. 2021. [DOI] [PMC free article] [PubMed] [Google Scholar]