Abstract
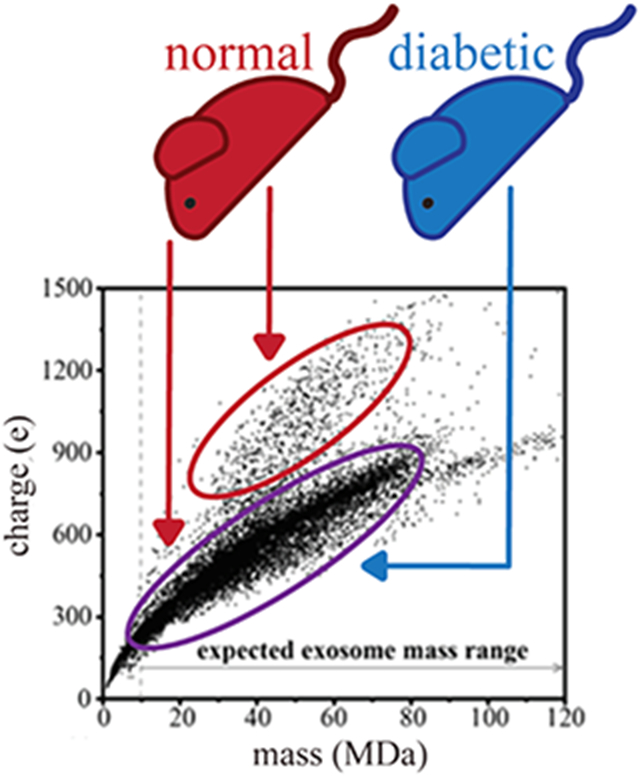
Unresolved inflammation compromises diabetic wound healing. Recently, we reported that inadequate RNA packaging in murine wound-edge keratinocyte-originated exosomes (Exoκ) leads to persistent inflammation [Zhou, X.et al.ACS Nano 2020, 14(10), 12732–12748]. Herein, we use charge detection mass spectrometry (CDMS) to analyze intact Exoκ isolated from a 5 day old wound-edge tissue of diabetic mice and a heterozygous nondiabetic littermate control group. In CDMS, the charge (z) and mass-to-charge ratio (m/z) of individual exosome particles are measured simultaneously, enabling the direct analysis of masses in the 1–200 MDa range anticipated for exosomes. These measurements reveal a broad mass range for Exoκ from ~10 to >100 MDa. The m and z values for these exosomes appear to fall into families (subpopulations); a statistical modeling analysis partially resolves ~10–20 Exoκ subpopulations. Complementary proteomics, immunofluorescence, and electron microscopy studies support the CDMS results that Exoκ from diabetic and nondiabetic mice vary substantially. Subpopulations having high z (>650) and high m (>44 MDa) are more abundant in nondiabetic animals. We propose that these high m and z particles may arise from differences in cargo packaging. The veracity of this idea is discussed in light of other recent CDMS results involving genome packaging in vaccines, as well as exosome imaging experiments. Characterization of intact exosome particles based on the physical properties of m and z provides a new means of investigating wound healing and suggests that CDMS may be useful for other pathologies.
Graphical Abstract
INTRODUCTION
Exosomes, a subclass of extracellular vesicles (EVs) having diameters of ~30–150 nm, are secreted by all cell types.1,2 These particles can contain influential cargo including genetic materials, proteins, glycoproteins, complex carbohydrates, and secondary metabolites.1-3 The lipid membrane surfaces of exosomes include recognition species that bind receptors of other cells, leading to the transfer of exosomal cargo.4 This mechanism of cell-to-cell communication is now associated with numerous pathologies (e.g., inflammation,5 immunity,6,7 cancer metastasis,8-11 and wound healing12). Because of this, understanding the physical and chemical characteristics of these particles is important and attracts considerable attention.12-14
Recently, we examined exosomes found at wound-edge sites in wild-type nondiabetic (WT) mice.12 We reported evidence that keratinocyte-derived exosomes (Exoκ) from the wound-edge tissue of WT mice carry signals to macrophages (wmϕ) at the wound site, enabling crosstalk between cells.12 Exosomal packaging of microribonucleic acid (miRNA) is selective and involves the recognition of exomotif sequences by small ubiquitin-like modifier (SUMOylated) heterogeneous nuclear ribonucleoproteins (hnRNPs).15,16 We found that the inhibition of hnRNP-dependent mechanisms results in persistent inflammation in mice.12 Santangelo and co-workers suggested that the loading of hnRNP may involve multiple molecular species and that binding to specific exomotifs varies, suggesting cooperative interactions between hnRNP proteins.16 From this hypothesis, we infer that miRNA packaging into Exoκ affects the wound inflammation response. Persistent inflammation at the wound site is a common complication in diabetic wound healing.17-21 Unlike WT animals that undergo efficient wound healing, wound closure in diabetic mice is delayed, which leads to persistent inflammation.17
Below, we explore the use of charge detection mass spectrometry (CDMS) as a means of discerning differences between Exoκ particles isolated from the wound-edge tissue of diabetic and nondiabetic mice. While there are multiple ways of performing CDMS,22-25 an electrostatic linear ion trap was used here. In CDMS, single particles oscillate back and forth in an electrostatic linear ion trap where they make multiple passes through a charge-sensitive amplifier that simultaneously measures the charge (z) and mass-to-charge (m/z) ratio for each ion. The product of the combined measurements enables the direct determination of the mass distributions of large molecules in the MDa-to-GDa regime, far beyond the ~1 MDa limit of conventional mass spectrometers.23,25-28 The measured CDMS spectra of intact Exoκ from 5 day wound-edge tissue of diabetic and nondiabetic mice show that distributions of particles can be grouped into multiple families (subpopulations) based on similarities in m vs z. Moreover, the distributions of particles from nondiabetic mice differ from those measured for diabetic mice. The ability of CDMS to capture these differences is significant because it suggests that the physical properties of exosome m and z could be used to distinguish between physiological states. Based on our previous observations of the crucial role of hnRNP-dependent mechanisms in sorting miRNAs into nondiabetic Exoκ and the low abundance of hnRNP Q in diabetic mice,15 we speculate that the dearth of high m and z subpopulations observed in diabetic Exoκ may be associated with compromised packaging in exosomes. Comparisons of these data sets suggest that some subpopulations derived from a single-cell lineage may be implicated in the symptoms of diabetes.
EXPERIMENTAL SECTION
General.
Detailed descriptions of the electron microscopy (EM) measurements,29,30 immunoprecipitation and microscopy,31,32 complementary nanoparticle tracking,33 and proteomics studies are provided in the Supporting Information (SI). Except for CDMS, all experimental measurements were carried out using commercially available instrumentations and established protocols. Therefore, we limit a discussion of these more standard experiments to the SI.
Animals and Sample Preparation.
Homozygous (BKS.Cg-Dock7m +/+ Leprdb/J or db/db) and heterozygous (BKS.Cg-Dock7m +/+ Leprdb/J or m+db) mice were obtained from Jackson Laboratory (Bar Harbor, ME). The animals used for the experiment were 12–14 weeks old. All animal studies were performed in accordance with the protocols approved by the Laboratory Animal Resource Center of Indiana University. Keratinocyte-specific exosomes were isolated from mice wound tissues, as described previously.12 Briefly, mice were anesthetized using a 1.5% isoflurane inhalant and transfected using tissue nanotransfection (TNT) with a cocktail of mouse Keratin14 promotor-driven plasmids expressing the mouse-specific cluster of differentiation (CD) 9, CD63, and CD81 proteins with an in-frame green fluorescent protein (GFP) as a reporter. One day post-TNT, four 8 mm excisional wounds were created on the dorsal skin adjacent to the midline. Five days post-TNT, the wound-edge tissue was collected and snap-frozen. The tissue was homogenized, suspended in phosphate-buffered saline (PBS), and briefly centrifuged. The supernatant was sequentially centrifuged at 5000g for 15 min and 20 000g for 45 min. The supernatant was incubated with GFP-trap magnetic agarose beads (Chromotek, Islandia, NY) at room temperature for 4 h. Exosomes were isolated using magnetic separation and washed thrice with PBS. Exosomes were separated from beads using a 0.2 M glycine (pH = 3) solution. The pH was adjusted using 1.0 M tris. Exosomes were pelleted by ultracentrifuging at 245 000g for 2 h. The resulting exosome-containing pellet was resolubilized in ~500 μL of 100 mM ammonium acetate and was used for further analysis.
CDMS Measurements.
Samples containing intact exosomes in 100 mM ammonium acetate were analyzed by CDMS using an experimental approach described in detail previously.34 Briefly, ions were generated using a nanoelectrospray source and introduced into a prototype CDMS instrument through a capillary inlet.35-37 Upon entering the instrument, ions are transported through a hybrid ion funnel-ion carpet (FUNPET) and thermalized in an RF-only hexapole.38 Thermalized ions enter an RF-only quadrupole high-pass filter (>12 000 m/z) that eliminates molecules that are below the expected size range of exosomes. Ions exiting the quadrupole are focused onto a dual hemispherical deflection energy analyzer (HDA) that transmits a narrow band of energies centered around 100 eV/z. The narrow distribution of energy-selected ions is focused onto a modified cone trap that contains the charge detection cylinder. After a trapping period of 100 ms, the trap was opened (both end caps set to ground). The ion oscillating through the detection cylinder induces a periodic signal, which is amplified, digitized, and analyzed using fast Fourier transforms. The m/z is derived from the fundamental frequency, and the charge is derived from the magnitude of the fundamental frequency and the first harmonic.23,25,27,28,39-44 The mass of each particle is obtained by multiplying its measured m/z and z values. The distribution of particle masses spans a wide mass range (>100 MDa in some cases). The mass of each exosome is accumulated into 100–400 kDa bins to plot the mass spectra for the ensemble of particles. In some cases, the detected ions fall into bands associated with their m/z and z values. The abundances of these subpopulations are analyzed using a statistical two-dimensional GMM technique, the mechanics of which are described in the SI.
RESULTS AND DISCUSSION
Example CDMS Analysis of Diabetic versus Nondiabetic Murine Wound-Edge Keratinocyte-Derived Exosomes.
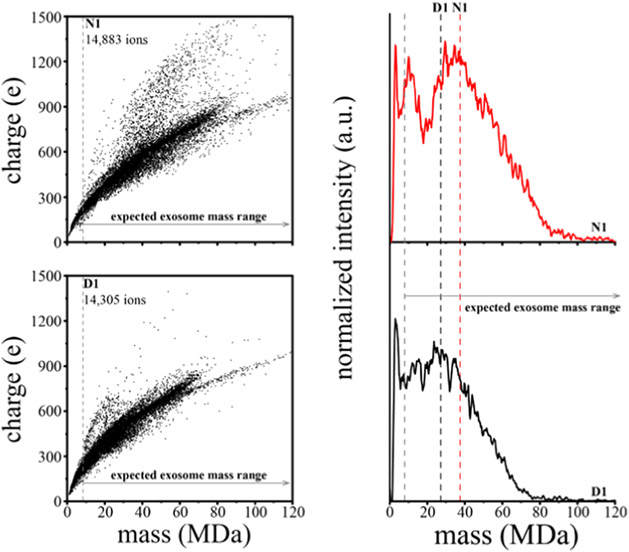
Figure 1a,b shows the m versus z scatter plots for the nondiabetic (N1) and diabetic (D1) samples, respectively. While most particles (~90%) fall into a broad family extending from m ~ 1 MDa up to 75 MDa and z ~ 50 e up to 950 e, the population densities of specific m/z distributions differ between N1 and D1 measurements. Specifically, in the D1 sample, a greater abundance of particles with a median m/z of 43 834 (m ~ 21.5 MDa and z ~ 400 e) is observed when compared to N1. A feature observed in both sample sets is a densely populated distribution of particles extending from m ~ 40 MDa up to 70 MDa and z ~ 600 e up to 720 e. Of particular interest are the high m and high z populations centered at m ~ 44.5 MDa, ~68.8 MDa (unique to nondiabetic samples), and ~17.7 MDa (more abundant in diabetic mice). Another less populated region extending from m ~ 63 MDa up to 175 MDa and z ~ 709 e up to 1190 e is also conserved between both sample sets. However, this feature in N1 begins at m ~ 73 MDa and extends up to m ~ 196 MDa (Figure S13).
Figure 1.
(a, b) Mass versus charge CDMS measurements for nondiabetic (N1) and diabetic (D1) wound-edge keratinocyte-derived exosome samples. (c) N1 (red trace) and D1 (black trace) mass spectra generated upon integrating the ion signal across the charge dimension using 0.35 MDa bins. Red (N1) and black (D1) dashed lines mark the average mass. The gray line denotes the expected mass range of exosomes based on assuming a spherical geometry, a 30 nm minimum exosome diameter, and an average density of 1.17 g/mL.
Figure 1c shows the mass spectra for the nondiabetic (N1, red trace) and diabetic (D1, black trace) samples that are obtained by integrating across the entire distribution of charges for both samples. Overall, these broad mass distributions in the N1 and D1 samples are very similar in appearance. Both N1 and D1 contain a sharp peak centered at m ~ 2 MDa, and the abundance of this peak decreases at m ~ 5 MDa. N1 contains a peak at m ~ 10 MDa compared to D1, which has no distinct peak in this range. N1 also contains a new feature corresponding to larger particles appearing at m ~ 22 MDa and increasing in abundance until plateauing at m ~ 35 MDa. However, in the D1 distribution, two unique features are apparent. The first feature begins at m ~ 18 MDa and increases in abundance until plateauing m ~ 25 MDa, and the second feature appears at m ~ 32 MDa and plateaus at m ~ 34 MDa. At higher masses, the intensity decreases until m ~ 120 and m ~ 90 MDa for N1 and D1, respectively. The largest particle (beyond the range of masses shown in Figure 1) was observed for only N1 at m = 300 MDa and z = 1529 e. The largest particle for D1 was observed at m = 174 MDa and z = 1150 e.
There are some differences in the abundances of various species between these samples. Comparison of the abundances in binned mass distributions from 22 to 300 MDa corrected for the length of the CDMS measurement indicates that the N1 distribution has a greater abundance of larger-sized particles, ~10% more than D1. Furthermore, the N1 Exoκ overall average mass (m = 37.8 MDa) is ~10 MDa greater than D1 (m = 27.3 MDa).
Complementary Size Information from Electron Microscopy Measurements.
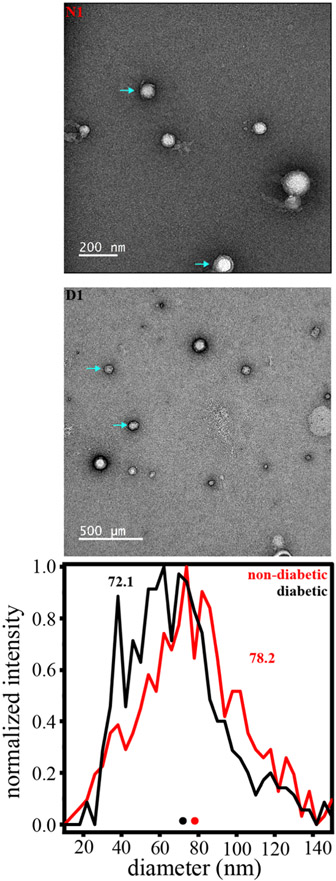
To gain more insight into both nondiabetic and diabetic Exoκ samples, we characterized the size distributions by EM (experimental details are included in the SI). Figure 2 shows representative EM images for the same Exoκ samples that were analyzed by CDMS and shown in Figure 1. Particle diameters as low as 15 nm and up to ~190 nm are observed. Arrows in Figure 2 indicate particles having diameters that are near the median value (~71 nm) for the distribution. Particles having diameters below 20 nm are too small to be ascribed to exosomes. A summary comparing the size distributions of both samples is also shown in Figure 2. From the measured diameters of a total of 1012 particles (506 particles each for the nondiabetic and diabetic samples), we find that 94% correspond to the size range expected for exosomes. A comparison of the diabetic and nondiabetic Exoκ samples shows a small difference in size. The average diameter associated with the nondiabetic Exoκ sample is larger (~78 nm) compared with that determined from the diabetic sample (72.1 nm). This result is consistent with the differences in mass distributions for these samples shown in Figure 1; N1 has a greater abundance of larger mass particles compared to D1.
Figure 2.
(Top) EM images of both diabetic (D1) and nondiabetic (N1) exosome-enriched samples. (Bottom) Size distribution (shown in diameter) determined by analyzing 1012 particles across the EM images recorded for three separate diabetic and nondiabetic samples. Note: the particle diameter scale is in 4 nm increments, and deformed or clearly damaged particles as well as those clearly too small to be exosomes (below ~10 nm) were not included in this analysis.
GMM Analysis of CDMS Spectra from Diabetic and Nondiabetic Keratinocyte-Derived Murine Exosomes to Estimate Subpopulations.
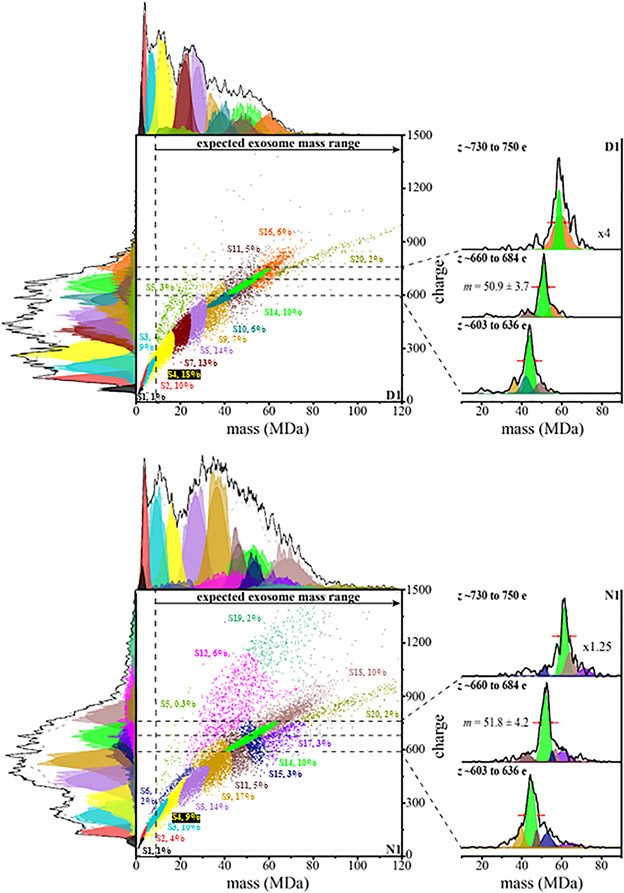
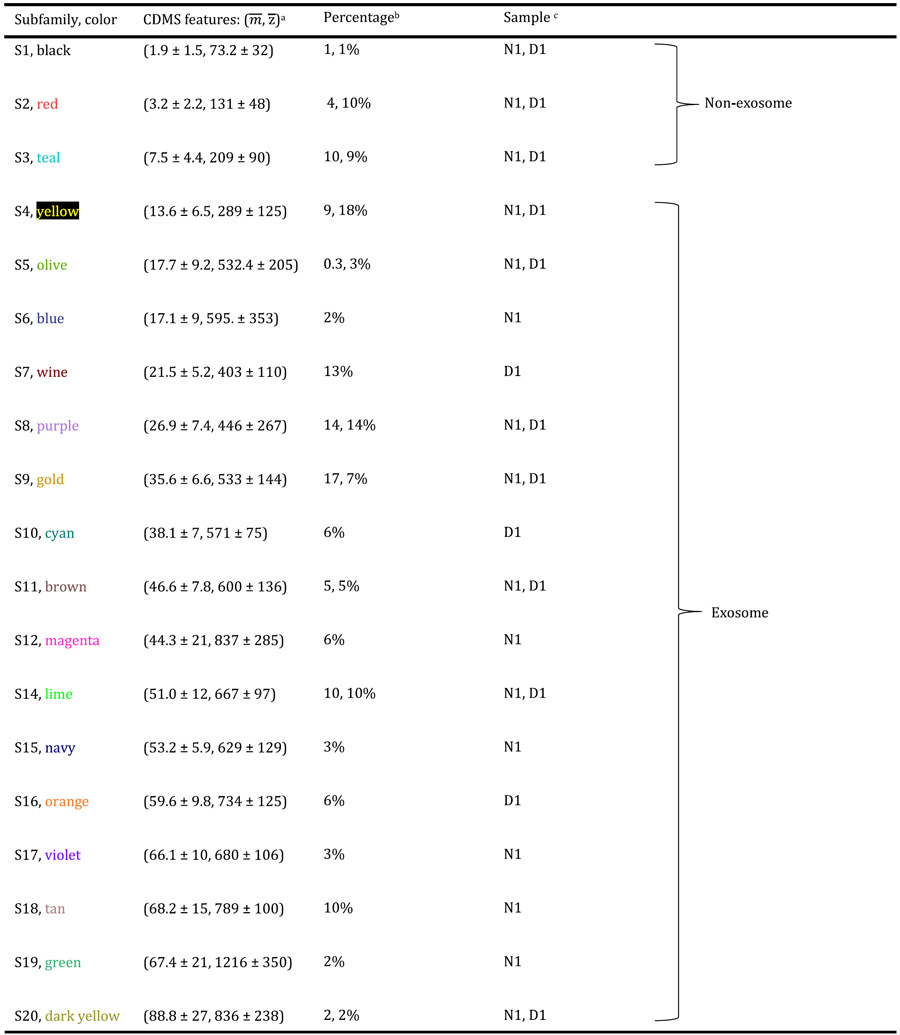
GMM has been used previously to analyze CDMS measurements of intact milk exosomes and to quantitatively examine subpopulations of exosomes within those measurements.29 We applied this analysis to six separate CDMS measurements of Exoκ derived from three independent N samples and three independent D samples (included in the SI). The results of the GMM analysis for the N1 and D1 samples are shown in Figure 3. This analysis indicates that many subpopulations coexist and are statistically discernible. A summary of the average two-dimensional peak positions and associated uncertainties for the N1 and D1 samples is provided in Table 1. The subpopulations for all six separate preparations are provided in the SI. We named these populations in order of the lowest mass (S1) to highest mass (S20). The color ascribed to each subpopulation shown in Figure 3 is denoted in Table 1. The GMM analysis estimates a total of 16 and 13 subpopulations for N1 and D1, respectively. The boundary of each two-dimensional GMM varies (inherent to the GMM), but the centers of each subpopulation are reproducible (±1.9 MDa, and ±24 e). In total, this analysis indicates that 19 subpopulations are found in the N1 and D1 samples shown in the figures. [We note that when all six samples are analyzed, there are a total of 20 unique subpopulations]. For the N1 and D1 samples shown in the figures, 10 are conserved. That is, the peak centers and widths of 10 (S1–S5, S8, S9, S11, S14, and S20) of the 19 families in these two samples are very similar in both samples. Note that the abundances of these subpopulations vary, and this variation provides insight into the overall shifts in the mass distributions for N1 and D1. As an example, consider Figure 1c; the relative abundance of smaller particles is larger for D1 than for N1. Examination of the populations in Figure 3 shows that one of the contributors to this difference is the S4 subpopulation, centered at m = 13.6 ± 6.5 MDa and z = 289.1 ± 125 e. In the D1 sample, the S4 subpopulation comprises ~18% of the population, whereas S4 makes up only ~9% of the N1 particles. A feeling for the different relative abundances of those subpopulations that are in common to both samples can be obtained by examining Table 1.
Figure 3.
Two-dimensional mass versus charge plot showing subpopulations obtained from Gaussian fits to the experimental data for the first CDMS measurement of nondiabetic and diabetic Exoκ samples. See the text for details. This model finds evidence for 15 and 13 subpopulations with abundances over 1% for nondiabetic and diabetic samples, respectively. Each point represents the mass and charge measured for a single particle and is assigned to a subpopulation (indicated by a color). Subfamily assignment is based on the highest probability of each particle belonging to a specific subfamily. Visually, this assignment leads to boundaries that are artificially strict when in reality the subpopulations overlap. The top and left side traces show the integrated raw data for the mass and charge dimensions, respectively, and the corresponding sums of the Gaussian curves as black lines for these dimensions. The determined fits for each subpopulation are also shown and delineated using the same color scheme. The percentage of each subpopulation is also indicated. The dashed vertical line provides an estimate of the delineation between those particles having masses in the range that is expected for exosomes and those particles that are too small to be exosomes. To the right of both the N1 and D1 mass versus charge plots is the integrated mass distribution of the N1 and D1 Exoκ at specified charge ranges (described above, horizontal dashed lines visually show these regions) corresponding to cross sections of the densely populated S14 subpopulation. The S9, S10, S11, S15, S16, S17, and S18 subpopulation mass distributions are also included. The data were normalized to 1 and treated as a composite data set. Mass spectra generated upon integrating the ion signal across the charge dimension used 0.45 MDa bins.
Table 1.
|
is the peak center from the extracted mass subpopulations given in units of MDa and is the peak center from the extracted charge populations given in units of e. Values are reported as the average of each subpopulation across N1 and D1. Error is reported as the average goodness of fit for the individual Gaussians of each subfamily.
Percentage of each subpopulation’s ion intensity within the total.
Denotation of the cohort (N1 and/or D1) in which each subpopulation is observed.
In some cases, subpopulations that are in common also have very similar abundances. For example, the S14 subpopulation (at m = 51.0 ± 12 MDa and z = 667 ± 97 MDa) comprises ~10% of both N1 (1539/14 883 particles) and D1 (1329/14 305 particles). The inset in Figure 3 shows another interesting aspect of this family; across a narrow range of charges, the mass spectral peak is quite sharp, and a comparison of the overall positions, shapes, and abundances shows that this subpopulation is highly conserved for the N1 and D1 samples.
Several of the GMM subpopulations are apparently unique to either N1 or D1. Such differences could be important as they may be associated with variations in inflammation and wound healing. For example, as indicated in Table 1, the S7, S10, and S16 subpopulations are observed in significant abundance in only D1. The S6, S12, S15, and S17–S19 subpopulations are only in significant abundance in the N1 sample. Some of the most striking differences observed between the conserved families for both the N1 and D1 samples were the three subpopulations having high z. The lowest m subpopulation of the three, S5, is centered at m = 17.7 ± 9.2 MDa and z = 532.4 ± 205 e and was observed in measurements of all six samples (see the SI). In the data shown in Figure 3 for N1 and D1, the S5 subpopulation is an order of magnitude more abundant in the D1 sample. The high m and z S12 subpopulation, centered at m = 44.3 ± 21 MDa, and z = 837 ± 285 e, is not observed in D1 and comprises 6% (874/14 883 particles) of the total N1 distribution. Finally, the highest m and z subpopulation, S19, is unique to all nondiabetic Exoκ samples (centered at m = 67.4 ± 21 MDa and z = 1216 ± 350 e) and comprises 2% (276/14 883 particles) of the total.
Comparison of Size Distributions Obtained from CDMS Data with Size Distributions Obtained from EM Measurements.
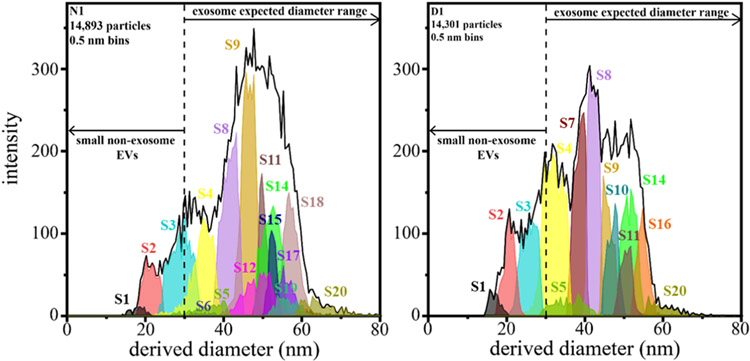
As a final assessment of the CDMS data, we compared the measured mass with the distributions (Figure 2) from the EM imaging. Particle diameters measured by EM are determined from an average Feret’s diameter for each particle. Examination of the EM data shows that particles may vary in shape, highlighting the possibility that dehydration during sample processing may alter exosome shape.45 With this factor in mind, it is still useful to compare the CDMS data with those from the EM measurements shown in Figure 2. For this comparison, particle diameters are derived from CDMS mass measurements using an average exosome density of 1.17 g/mL46 and assuming that particles are spherical and that exosomal contents are retained upon electrospraying samples into the gas phase. Figure 4 shows a comparison between N1- and D1-estimated size distributions (for each GMM-estimated subpopulation of the CDMS data). The CDMS-derived diameters for both N1 and D1 samples indicate broad size distributions ranging from ~15 to 93 nm. We note that the large differences in these diameter distributions originate from the same subpopulations discussed above for the mass spectral distributions. The N1 distribution has a greater median diameter (47.2 nm) compared to D1 (40.5 nm). While the median values of the EM- and CDMS-derived diameters differ slightly, diameters from both methods exhibit the same trend: exosomes from the diabetic samples have a smaller median diameter compared to those from the normal samples. Discrepancies in the absolute values may result from differences in the ways that factors such as dehydration affect the particles in each type of analysis. For example, particles may flatten to adhere to grids during EM, which leads to inflated diameters.
Figure 4.
Plot of CDMS-derived diameters of nondiabetic (N1, left) and diabetic (D1, right) samples of each subpopulation (shown in Figure 3) using a bin size of 0.5 nm. Particle diameters from CDMS were determined by assuming a spherical geometry and a density of 1.17 g/mL.
Proteomic Analyses.
LC-MS/MS-based proteomics can be used to characterize the proteins in each Exoκ sample (experimental details are included in the SI). Across four separate proteomic measurements of all six separately prepared Exoκ samples, we identified 505 proteins, of which two proteins are unique to the nondiabetic Exoκ cohort. Since both Exoκ cohorts are derived from the same cell type, it is not surprising that there is a significant overlap in the identified proteins. However, the abundances and, in turn, the enrichment across samples can give insight into the wound healing process. Recently, we published evidence that the nondiabetic Exoκ are major contributors that regulate macrophage trafficking and epithelial barrier properties post injury.12 The activated complement system is known to have a profound inflammatory response to a tissue injury.47 In the nondiabetic Exoκ cohort (which can effectively wound-heal), both complement protein 6 (C6) and C7 were upregulated by a factor of ~19 and ~16, respectively. Additionally, periostin (Postn), a protein that plays an important role in wound healing48 and is upregulated after a skin injury, was deficient in mice that exhibited delayed wound healing.48-50 Postn was upregulated by a factor of ~14 in nondiabetic Exoκ samples compared to that in diabetic samples, further emphasizing characteristically poor wound healing outcomes in diabetics. The diabetic Exoκ samples contained several upregulated proteins involved in neutrophil activation and innate immune response known to be important in inflammation.51 For example, the WD repeat-containing protein 1 (Wdr1), which mediates neutrophil immunity (a process involved in the inflammatory response), was upregulated by a factor of 6 in diabetic Exoκ. Additionally, CD177, a known marker for neutrophil activation found to be elevated in purified neutrophils of septic shock patients, was upregulated by a factor of 3 in diabetic Exoκ.52,53
Analysis of the proteome also revealed multiple characteristic exosome markers [e.g., tumor susceptibility gene 101 protein (TSG101), heat shock cognate 71 kDa protein (HSPA8), actin (ACTB), etc.]. The complete analysis identified over 50% of the top 100 reported exosomal proteins.54 The 505 proteins identified across both cohorts were submitted to DAVID (https://david.ncifcrf.gov/) for gene ontology enrichment analysis to obtain a broader view of exosome composition. Of the 505 proteins submitted, 475 were annotated in DAVID. Cellular compartment analysis revealed that ~75% (355/475) of the proteins identified were denoted as pertaining to exosomes. To further evaluate the exosomal composition in the context of wound healing, a biological process analysis is helpful. Over 50% of proteins searched in DAVID are involved in several biological processes associated with various stages of the wound healing process. For example, ~6% are involved in the complement activation pathway (both classical and alternative) and ~7% participate in an innate immune response.
Biological Hypothesis for the Observed Differences of the High m and z Families Found in Diabetic and Nondiabetic Animals.
Our previous study revealed that Exoκ are critical for the resolution of inflammation.12 Inhibiting hnRNP-dependent mechanisms, involved in packaging miRNA into exosomes,15 resulted in persistent inflammation in nondiabetic mice post wounding.12 Recent findings from chronic wound tissue and fluid indicate a continual competition between inflammatory and anti-inflammatory signals, leading to an unbalanced environment.17 Such persistent inflammatory symptoms fail to progress toward successful wound healing (a typical complication with diabetic wounds, as mentioned).17
The CDMS analyses presented above reveal increased abundances of some high m and z Exoκ subpopulations in nondiabetic mice (e.g., S12, S19) relative to Exoκ from the diabetic mice. Could these types of particles be associated with, or perhaps even necessary for, wound healing? One important ramification of the degree of charging associated with a specific particle is that a particle’s charge depends upon its structure. Because of this correlation, CDMS measurements of charge can be used to infer information about the structure.55 For example, recent CDMS studies of adeno-associated virus (AAV) found that populations for empty versus full capsids did not show an increase in charge, which indicated that the DNA cargo was fully encapsulated.56 This result is interpreted as evidence that empty and full capsids have similar structures. Analogous CDMS measurements of the Rotateq vaccine revealed that partially exposed genomes, as well as particles where double-stranded RNA is believed to be on the surface, lead to a substantial increase in charge.57
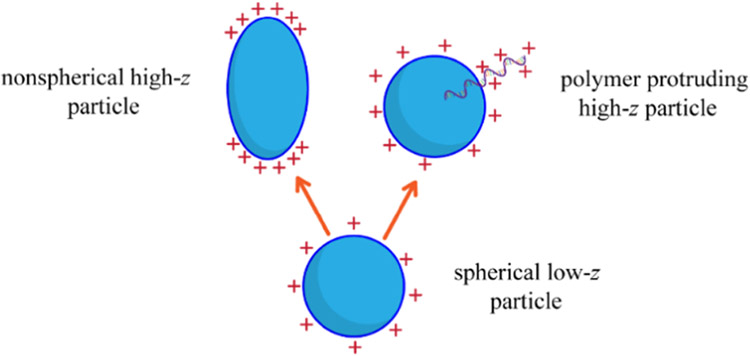
In the case of Exoκ derived from the wound edges of nondiabetic and diabetic animals, enhanced abundances of the S5, S12, and S19 subpopulations in the nondiabetic animals are resolved because they accommodate more charge than other Exoκ of similar mass. We speculate that this difference might arise because of disparities in cargo packaging; specifically, the failure of diabetic mice to efficiently package cargo could explain the low abundances of these higher z subpopulations (S5, S12, and S19) in the diabetic animals. As noted, the ability of a particle to carry excess charge depends upon the electrostatic nature of its surface and thus its morphology. For a particle of a given mass, nonspherical structures such as oblate or prolate geometries, or species with packaged material that extends from the surface of the particle, can carry additional charge because such geometries reduce repulsive Coulombic interactions, as shown in Scheme 1. The enhanced abundances of the high z S5, S12, and S19 subpopulations observed in nondiabetic exosomes suggest that these particles are structurally different from exosomes from diabetic animals. For example, as shown in Scheme 1, Exoκ having cargo that extends from defects on the surfaces30 or other nonspherical geometries may explain the presence of these populations in nondiabetic animals and their involvement in resolving inflammation at the wound site.
Scheme 1.
Possible Additional Exosome Geometries
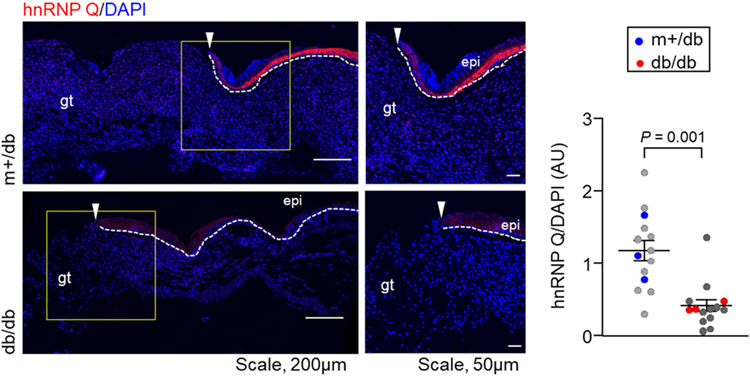
One approach to investigating the possible origins of the differences observed in Figure 3 is an immunofluorescence microscopy experiment to evaluate the expression levels of hnRNP Q.16 Figure 5 shows representative coimmunofluorescence images of hnRNP Q counterstained with DAPI in the wound-edge tissue of diabetic and nondiabetic Exoκ. These data show that diabetic mice have a low abundance of hnRNP Qin wound-edge keratinocytes. This finding is consistent with the idea that the absence of high z Exoκ S5, S12, and S19 subpopulations may be associated with the compromised packaging of miRNA in diabetic mice. We know that many factors may contribute to the increased mass and surface-charging characteristics observed in nondiabetic mice. We note that the mechanisms of hnRNP sorting into exosomes are unknown. However, it seems plausible that impaired hnRNP Q-induced sorting of RNA may influence the overall charge and size distributions of diabetic wound-induced Exoκ. Of course, many other factors may also influence inflammation and wound healing.58
Figure 5.
(Left) Representative coimmunofluorescence of heterogeneous nuclear ribonucleoproteins (hnRNP) Q (red) counterstained with 4′,6-diamidino-2-phenylindole (DAPI) (blue) in the wound-edge tissue of nondiabetic (m+/db) and diabetic (db/db) mice. The hnRNP Q expression in db/db wound-edge keratinocytes was significantly lower than that in m+/db. The white dashed line indicates the dermal–epidermal junction with the epidermal edge labeled epi. The white arrowhead indicates the leading edge of the epidermis. Granulation tissue is labeled gt. (Right) Quantification of the hnRNP Q intensity, normalized with DAPI intensity in wound-edge tissue, was plotted graphically. Each dot corresponds to one quantified region of interest (ROI), except for the blue and red dots that correspond to the mean value for one of three mice. At least three ROIs are plotted per mouse. Solid black lines indicate the mean ± standard error of the mean for all three mice in each group and were analyzed by a two-tailed unpaired Student’s t-test to determine a P value of 0.001.
SUMMARY AND CONCLUSIONS
Distributions of masses and charges of nondiabetic and diabetic Exoκ particles were analyzed using CDMS. In total, 54 974 single particles were detected by CDMS across six separate Exoκ samples (three diabetic and three nondiabetic). Complementary EM- and MS-based proteomic studies were also performed on each of the samples. In all samples from both sample types, the distribution of particles detected by CDMS has masses spanning a broad distribution (from m ~1 to ~75 MDa). A comparison of the mass distributions indicates that Exoκ extracted from nondiabetic animals show an enrichment in high mass species compared with particles derived from diabetic mice. These species shift the overall mass distribution such that Exoκ derived from nondiabetic animals have an average mass that is ~10% greater than particles from diabetic animals. EM measurements of Exoκ particle diameters (combined with information regarding exosome densities) show a similar shift, corroborating the CDMS finding. A visual inspection of m vs z distributions from CDMS measurements shows that particles appear to fall into families. While these subpopulations are broad, some partially resolved features are apparent. A statistical analysis using a two-dimensional Gaussian model of the data suggests that ~10–20 unique subpopulations (across all six samples) may be resolvable based on mass and charge. The most dramatic differences observed between nondiabetic and diabetic Exoκ are found for high m (≥44 MDa) and z (≥650 e) subpopulations. Based on our previous findings regarding the hnRNP-dependent mechanism’s crucial role in sorting miRNAs into nondiabetic Exoκ,12 we suggest a possible biological origin for the dearth of high m and z subpopulations observed in diabetic Exoκ. The dearth of these particles may be associated with compromised packaging in exosomes. An immunofluorescence study reveals that the hnRNP Q expression in diabetic mice is significantly lower compared to that in nondiabetic mice, consistent with this hypothesis. Overall, the ability to characterize physiological differences based on analyzing particles by CDMS indicates that the physical properties of m and z may evolve as an important new physical basis for isolating and characterizing exosomes.
Supplementary Material
ACKNOWLEDGMENTS
This work was supported, in part, by funds from the National Institutes of Health (R01 GM117207, 5R01GM121751, and R56DK129592) and the National Science Foundation, NSF (IIP-1916645).
Footnotes
The authors declare the following competing financial interest(s): M.F.J. and D.E.C. are founders of Megadalton Solutions (LLC), a company that is engaged in the commercialization of CDMS.
Supporting Information
The Supporting Information is available free of charge at https://pubs.acs.org/doi/10.1021/acs.analchem.2c00453.
Additional exosome analysis details, including CDMS, proteomics, imaging, and other measurements for replicate samples (PDF)
Contributor Information
Brooke A. Brown, Department of Chemistry, Indiana University, Bloomington, Indiana 47505, United States
Poornachander R. Guda, Indiana Center for Regenerative Medicine & Engineering, Department of Surgery, Indiana University School of Medicine, Indianapolis, Indiana 46202, United States
Xuyao Zeng, Department of Chemistry, Indiana University, Bloomington, Indiana 47505, United States.
Adam Anthony, Department of Chemistry, Indiana University, Bloomington, Indiana 47505, United States.
Andrew Couse, Department of Chemistry, Indiana University, Bloomington, Indiana 47505, United States.
Lauren F. Barnes, Department of Chemistry, Indiana University, Bloomington, Indiana 47505, United States
Edie M. Sharon, Department of Chemistry, Indiana University, Bloomington, Indiana 47505, United States
Jonathan C. Trinidad, Department of Chemistry, Indiana University, Bloomington, Indiana 47505, United States
Chandan K. Sen, Indiana Center for Regenerative Medicine & Engineering, Department of Surgery, Indiana University School of Medicine, Indianapolis, Indiana 46202, United States
Martin F. Jarrold, Department of Chemistry, Indiana University, Bloomington, Indiana 47505, United States.
Subhadip Ghatak, Indiana Center for Regenerative Medicine & Engineering, Department of Surgery, Indiana University School of Medicine, Indianapolis, Indiana 46202, United States.
David E. Clemmer, Department of Chemistry, Indiana University, Bloomington, Indiana 47505, United States.
REFERENCES
- (1).Théry C; Witwer KW; Aikawa E; et al. J. Extracell. Vesicles 2018, 7, No. 1535750. [DOI] [PMC free article] [PubMed] [Google Scholar]
- (2).Pegtel DM; Gould SJ Annu. Rev. Biochem 2019, 88, 487–514. [DOI] [PubMed] [Google Scholar]
- (3).Colombo M; Raposo G; Théry C Annu. Rev. Cell Dev. Biol 2014, 30, 255–289. [DOI] [PubMed] [Google Scholar]
- (4).Raposo G; Stoorvogel W J. Cell Biol 2013, 200, 373–383. [DOI] [PMC free article] [PubMed] [Google Scholar]
- (5).Słomka A; Urban SK; Lukacs-Kornek V; Żekanowska E; Kornek M Front. Immunol 2018, 9, No. 2723. [DOI] [PMC free article] [PubMed] [Google Scholar]
- (6).Bhatnagar S; Shinagawa K; Castellino FJ; Schorey JS Blood 2007, 110, 3234–3244. [DOI] [PMC free article] [PubMed] [Google Scholar]
- (7).Giri PK; Kruh NA; Dobos KM; Schorey JS Proteomics 2010, 10, 3190–3202. [DOI] [PMC free article] [PubMed] [Google Scholar]
- (8).Fang T; Lv H; Lv G; Li T; Wang C; Han Q; Yu L; Su B; Guo L; Huang S; Cao D; Tang L; Tang S; Wu M; Yang W; Wang H Nat. Commun 2018, 9, No. 191. [DOI] [PMC free article] [PubMed] [Google Scholar]
- (9).Zhang X; Shi H; Yuan X; Jiang P; Qian H; Xu W Mol. Cancer 2018, 17, 146. [DOI] [PMC free article] [PubMed] [Google Scholar]
- (10).Madeo M; Colbert PL; Vermeer DW; Lucido CT; Cain JT; Vichaya EG; Grossberg AJ; Muirhead D; Rickel AP; Hong Z; Zhao J; Weimer JM; Spanos WC; Lee JH; Dantzer R; Vermeer PD Nat. Commun 2018, 9, No. 4284. [DOI] [PMC free article] [PubMed] [Google Scholar]
- (11).Sung BH; Weaver AM J. Cell Biol 2018, 217, 2613–2614. [DOI] [PMC free article] [PubMed] [Google Scholar]
- (12).Zhou X; Brown BA; Siegel AP; et al. ACS Nano 2020, 14, 12732–12748. [DOI] [PMC free article] [PubMed] [Google Scholar]
- (13).Wu SC; Kuo PJ; Rau CS; Wu YC; Wu CJ; Lu TH; Lin CW; Tsai CW; Hsieh CH Int. J. Med. Sci 2021, 18, 1058–1066. [DOI] [PMC free article] [PubMed] [Google Scholar]
- (14).Zabeo D; Cvjetkovic A; Lässer C; Schorb M; Lötvall J; Höög JL J. Extracell. Vesicles 2017, 6, No. 1329476. [DOI] [PMC free article] [PubMed] [Google Scholar]
- (15).Villarroya-Beltri C; Gutiérrez-Vázquez C; Sánchez-Cabo F; Perez-Hernandez D; Vázquez J; Martín-Cófreces NB; Martínez-Herrera DJ; Pascual-Montano AD; Mittelbrunn M; Sáncheš Madrid F Nat. Commun 2013, 4, No. 2980. [DOI] [PMC free article] [PubMed] [Google Scholar]
- (16).Santangelo L; Giurato G; Cicchini C; Montaldo C; Mancone C; Tarallo R; Battistelli C; Alonzi T; Weisz A; Tripodi M Cell Rep. 2016, 17, 799–808. [DOI] [PubMed] [Google Scholar]
- (17).Eming SA; Martin P; Tomic-Canic M Sci. Transl. Med 2014, 6, No. 265sr6. [DOI] [PMC free article] [PubMed] [Google Scholar]
- (18).Tang Y; Zhang MJ; Hellmann J; Kosuri M; Bhatnagar A; Spite M Diabetes 2013, 62, 618–627. [DOI] [PMC free article] [PubMed] [Google Scholar]
- (19).Das A; Ghatak S; Sinha M; Chaffee S; Ahmed NS; Parinandi NL; Wohleb ES; Sheridan JF; Sen CK; Roy S J. Immunol 2016, 196, 5089–5100. [DOI] [PMC free article] [PubMed] [Google Scholar]
- (20).Cunnion KM; Krishna NK; Pallera HK; Pineros-Fernandez A; Rivera MG; Hair PS; Lassiter BP; Huyck R; Clements MA; Hood AF; Rodeheaver GT; Cottler PS; Nadler JL; Dobrian AD PLoS One 2017, 12, No. e0170500. [DOI] [PMC free article] [PubMed] [Google Scholar]
- (21).Khanna S; Biswas S; Shang Y; Collard E; Azad A; Kauh C; Bhasker V; Gordillo GM; Sen CK; Roy S PLoS One 2010, 5, No. e9539. [DOI] [PMC free article] [PubMed] [Google Scholar]
- (22).Wörner TP; Snijder J; Bennett A; Agbandje-Mckenna M; Makarov AA; Heck AJR Nat. Methods 2020, 17, 395–398. [DOI] [PubMed] [Google Scholar]
- (23).Doussineau T; Désert A; Lambert O; Taveau J-C; Lansalot M; Dugourd P; Bourgeat-Lami E; Ravaine S; Duguet E; Antoine R J. Phys. Chem. C 2015, 119, 10844–10849. [Google Scholar]
- (24).Elliott AG; Harper CC; Lin HW; Susa AC; Xia Z; Williams ER Anal. Chem 2017, 89, 7701–7708. [DOI] [PubMed] [Google Scholar]
- (25).Elliott AG; Harper CC; Lin HW; Williams ER Analyst 2017, 142, 2760–2769. [DOI] [PubMed] [Google Scholar]
- (26).Mabbett SR; Zilch LW; Maze JT; Smith JW; Jarrold MF Anal. Chem 2007, 79, 8431–8439. [DOI] [PubMed] [Google Scholar]
- (27).Doussineau T; Kerleroux M; Dagany X; Clavier C; Barbaire M; Maurelli J; Antoine R; Dugourd P Rapid Commun. Mass Spectrom 2011, 25, 617–623. [DOI] [PubMed] [Google Scholar]
- (28).Pierson EE; Keifer DZ; Selzer L; Lee LS; Contino NC; Wang JC; Zlotnick A; Jarrold MF J. Am. Chem. Soc 2014, 136, 3536–3541. [DOI] [PMC free article] [PubMed] [Google Scholar]
- (29).Brown BA; Zeng X; Todd AR; Barnes LF; Winstone JMA; Trinidad JC; Novotny MV; Jarrold MF; Clemmer DE Anal. Chem 2020, 92, 3285–3292. [DOI] [PMC free article] [PubMed] [Google Scholar]
- (30).Zabeo D; Cvjetkovic A; Lässer C; Schorb M; Lötvall J; Höög JL J. Extracell. Vesicles 2017, 6, No. 1329476. [DOI] [PMC free article] [PubMed] [Google Scholar]
- (31).Ahmed NS; Ghatak S; El Masry MS; Gnyawali SC; Roy S; Amer M; Everts H; Sen CK; Khanna S Mol. Ther 2017, 25, 2502–2512. [DOI] [PMC free article] [PubMed] [Google Scholar]
- (32).Ghatak S; Li J; Chan YC; Gnyawali SC; Steen E; Yung BC; Khanna S; Roy S; Lee RJ; Sen CK Nanomedicine 2016, 12, 1827–1831. [DOI] [PMC free article] [PubMed] [Google Scholar]
- (33).Li J; Ghatak S; El Masry MS; Das A; Liu Y; Roy S; Lee RJ; Sen CK Mol. Ther 2018, 26, 2178–2188. [DOI] [PMC free article] [PubMed] [Google Scholar]
- (34).Brown BA; Zeng X; Todd AR; Barnes LF; Winstone JMA; Trinidad JC; Novotny MV; Jarrold MF; Clemmer DE Anal. Chem 2020, 92, 3285–3292. [DOI] [PMC free article] [PubMed] [Google Scholar]
- (35).Contino NC; Pierson EE; Keifer DZ; Jarrold MF J. Am. Soc. Mass Spectrom 2013, 24, 101–108. [DOI] [PubMed] [Google Scholar]
- (36).Pierson EE; Contino NC; Keifer DZ; Jarrold MF J. Am. Soc. Mass Spectrom 2015, 26, 1213–1220. [DOI] [PubMed] [Google Scholar]
- (37).Pierson EE; Keifer DZ; Contino NC; Jarrold MF Int. J. Mass Spectrom 2013, 337, 50–56. [DOI] [PubMed] [Google Scholar]
- (38).Draper BE; Anthony SN; Jarrold MF J. Am. Soc. Mass Spectrom 2018, 29, 2160–2172. [DOI] [PubMed] [Google Scholar]
- (39).Contino NC; Jarrold MF Int. J. Mass Spectrom 2013, 345–347, 153–159. [Google Scholar]
- (40).Benner WH Anal. Chem 1997, 69, 4162–4168. [Google Scholar]
- (41).Doussineau T; Mathevon C; Altamura L; Vendrely C; Dugourd P; Forge V; Antoine R Frontispiece: Mass Determination of Entire Amyloid Fibrils by Using Mass Spectrometry Angew. Chem., Int. Ed 2016, 557 DOI: 10.1002/anie.201680761. [DOI] [PubMed] [Google Scholar]
- (42).Fuerstenau SD; Benner WH Rapid Commun. Mass Spectrom 1995, 9, 1528–1538. [DOI] [PubMed] [Google Scholar]
- (43).Hogan JA; Jarrold MF J. Am. Soc. Mass Spectrom 2018, 29, 2086–2095. [DOI] [PubMed] [Google Scholar]
- (44).Keifer DZ; Pierson EE; Jarrold MF Analyst 2017, 142, 1654–1671. [DOI] [PubMed] [Google Scholar]
- (45).Chopra N; Dutt Arya B; Jain N; Yadav P; Wajid S; Singh SP; Choudhury S ACS Omega 2019, 4, 13143–13152. [DOI] [PMC free article] [PubMed] [Google Scholar]
- (46).Kreimer S; Belov AM; Ghiran I; Murthy SK; Frank DA; Ivanov AR J. Proteome Res 2015, 14, 2367–2384. [DOI] [PubMed] [Google Scholar]
- (47).Sinno H; Prakash S Plast. Surg. Int 2013, 2013, No. 146764. [DOI] [PMC free article] [PubMed] [Google Scholar]
- (48).Walker JT; McLeod K; Kim S; Conway SJ; Hamilton DW Cell Tissue Res. 2016, 365, 453–465. [DOI] [PMC free article] [PubMed] [Google Scholar]
- (49).Elliott CG; Wang J; Walker JT; et al. Tissue Eng., Part A 2019, 25, 1326–1339. [DOI] [PubMed] [Google Scholar]
- (50).Nishiyama T; Kii I; Kashima TG; Kikuchi Y; Ohazama A; Shimazaki M; Fukayama M; Kudo A PLoS One 2011, 6, No. e18410. [DOI] [PMC free article] [PubMed] [Google Scholar]
- (51).Kolaczkowska E; Kubes P Nat. Rev. Immunol 2013, 13, 159–175. [DOI] [PubMed] [Google Scholar]
- (52).Bai M; Grieshaber-Bouyer R; Wang J; Schmider AB; Wilson ZS; Zeng L; Halyabar O; Godin MD; Nguyen HN; Levescot A; Cunin P; Lefort CT; Soberman RJ; Nigrovic PA Blood 2017, 130, 2092–2100. [DOI] [PMC free article] [PubMed] [Google Scholar]
- (53).Lévy Y; Wiedemann A; Hejblum BP; et al. iScience 2021, 24, No. 102711. [DOI] [PMC free article] [PubMed] [Google Scholar]
- (54).Keerthikumar S; Chisanga D; Ariyaratne D; Al Saffar H; Anand S; Zhao K; Samuel M; Pathan M; Jois M; Chilamkurti N; Gangoda L; Mathivanan S J. Mol. Biol 2016, 428, 688–692. [DOI] [PMC free article] [PubMed] [Google Scholar]
- (55).Keifer DZ; Motwani T; Teschke CM; Jarrold MF J. Am. Soc. Mass Spectrom 2016, 27, 1028–1036. [DOI] [PMC free article] [PubMed] [Google Scholar]
- (56).Barnes LF; Draper BE; Chen Y-T; Powers TW; Jarrold MF Mol. Ther. - Methods Clin. Dev 2021, 23, 87–97. [DOI] [PMC free article] [PubMed] [Google Scholar]
- (57).Miller LM; Bond KM; Draper BE; Jarrold MF Anal. Chem 2021, 93, 11965–11972. [DOI] [PubMed] [Google Scholar]
- (58).Ferguson SW; Nguyen J J. Controlled Release 2016, 228, 179–190. [DOI] [PubMed] [Google Scholar]
Associated Data
This section collects any data citations, data availability statements, or supplementary materials included in this article.


