Abstract
BACKGROUND AND PURPOSE:
CTP allows estimating ischemic core in patients with acute stroke. However, these estimations have limited accuracy compared with MR imaging. We studied the effect of applying WM- and GM-specific thresholds and analyzed the infarct growth from baseline imaging to reperfusion.
MATERIALS AND METHODS:
This was a single-center cohort of consecutive patients (n = 113) with witnessed strokes due to proximal carotid territory occlusions with baseline CT perfusion, complete reperfusion, and follow-up DWI. We segmented GM and WM, coregistered CTP with DWI, and compared the accuracy of the different predictions for each voxel on DWI through receiver operating characteristic analysis. We assessed the yield of different relative CBF thresholds to predict the final infarct volume and an estimated infarct growth–corrected volume (subtracting the infarct growth from baseline imaging to complete reperfusion) for a single relative CBF threshold and GM- and WM-specific thresholds.
RESULTS:
The fixed threshold underestimated lesions in GM and overestimated them in WM. Double GM- and WM-specific thresholds of relative CBF were superior to fixed thresholds in predicting infarcted voxels. The closest estimations of the infarct on DWI were based on a relative CBF of 25% for a single threshold, 35% for GM, and 20% for WM, and they decreased when correcting for infarct growth: 20% for a single threshold, 25% for GM, and 15% for WM. The combination of 25% for GM and 15% for WM yielded the best prediction.
CONCLUSIONS:
GM- and WM-specific thresholds result in different estimations of ischemic core in CTP and increase the global accuracy. More restrictive thresholds better estimate the actual extent of the infarcted tissue.
CTP is a widely available technique that allows measuring hypoperfused brain tissue and estimating ischemic core in patients with acute stroke.1-3 The ischemic core is often defined by CBF thresholds.4 However, despite their clinical usefulness, the most often used CBF-based definitions of ischemic core may not be accurate for research purposes.5 They often overestimate the true infarct6 (example in the Online Supplemental Data) and have limited accuracy compared with MR imaging.7 In addition, differences in the neurochemical response to ischemia in GM and WM lead to a varied vulnerability to ischemia.8 Applying homogeneous CBF thresholds in the whole brain may result in under- or overestimating the lesion in brain areas with different susceptibility to ischemia.9 Also, ischemic core volumes estimated by CTP, especially those affecting WM, are often smaller than in follow-up MR imaging.10 This overestimation, applied to routine clinical practice, could lead to not offering reperfusion treatment to patients who could benefit from it. These findings can be explained by the delay between baseline imaging and the follow-up imaging used to measure final infarct volume. The baseline-to-follow-up imaging delay may be a source of error because stroke is a dynamic process that results in progressive brain damage, mainly if successful reperfusion is not achieved. In addition, cerebral ischemia is a dynamic process, and it is difficult to accurately establish the evolution of the infarction. Some studies have assumed both linear11 and logarithmic12 infarct growth (IG), but it is currently under discussion.13
All these factors highlight the need for further research to improve tissue-outcome predictions in patients with stroke.14 Here, we studied the best thresholds for defining ischemic core using global- versus GM- and WM-specific CBF thresholds and accounting for IG in a cohort of patients with baseline CTP, complete reperfusion, and follow-up MR imaging.
MATERIALS AND METHODS
Study Population
The study population (n = 101, Online Supplemental Data) was part of a prospectively collected clinical registry of patients with acute ischemic stroke admitted in to a Comprehensive Stroke Center between March 2010 and December 2017. We included all consecutive patients with proximal occlusions in the carotid territory with a pretreatment whole-brain CTP <6 hours from symptom onset to neuroimaging, complete endovascular reperfusion defined as modified TICI 3, and a follow-up MR imaging. Proximal arterial occlusions included those located at the terminal intracranial carotid artery, the M1–M2 segments of the MCA, and the A1 segment of the anterior cerebral artery. There were no vascular re-occlusions in our cohort. We prospectively collected baseline characteristics, demographics, clinical course, and reperfusion therapy–related variables.
Standard Protocol Approvals, Registrations, and Patient Consent
The local Ethics Committee at Hospital Clinic approved the study (registration code, HCB/2018/0680).
Neuroimaging
The imaging protocol included a baseline multimodal whole-brain CT scan (total acquisition time, 83 seconds), which included NCCT (140 kV, 127 mAs, FOV = 225 mm, matrix = 512 × 512, section thickness = 5 mm); CTA (120 kV, 663 mAs, FOV = 261 mm, matrix = 512 × 512, section thickness = 0.6 mm); and CTP (80 kV[peak], 250 mAs, 1.5-second rotation, FOV = 18 mm, matrix = 512 × 512, and forty-nine 2-mm-thickness slices). Patients were scanned within a median (interquartile range [IQR]) of 129 minutes (72–211 minutes) from stroke onset using a Somatom Definition Flash 128-section dual-source multidetector scanner (Siemens), with a 98-mm z-coverage and 26 time points acquired each 1.5 seconds and 4 last time points each 5 seconds (total acquisition time, 59 seconds). Fifty milliliters of nonionic iodinated contrast were administered intravenously at 5 mL/s using a power injector, followed by a saline flush of 20 mL at an injection rate of 2 mL/s. To ensure complete filling of the collateral circulation, we acquired CTA after the CTP.
The ASPECTS was assessed on the baseline NCCT. CTP maps were calculated by the commercial software MIStar (Apollo Medical Imaging Technology) using a model-free singular-value decomposition algorithm with a delay and dispersion correction. The software automatically performs motion correction and selects an arterial input function from an unaffected artery (usually the anterior cerebral artery) and a venous output function from a large draining vein (the sagittal sinus). The software generates CBF, CBV, MTT, and delay time maps. Of note, the delay-corrected deconvolution method produces delay time maps rather than the more extensively used time-to-maximum maps.15 A threshold of 3 seconds on the delay time maps was used to define the hypoperfusion,3 and “ischemic core” was defined within the hypoperfused area with a series of relative CBF thresholds as a percentage of the mean perfusion values from the entire unaffected, contralateral hemisphere.16 The final vessel patency was graded on DSA at the end of mechanical thrombectomy according to the modified TICI classification.17 The follow-up MR imaging (total acquisition time, 24 minutes and 18 seconds) was performed on a 1.5T Magneton Aera unit (Siemens) at a median of 43 hours (IQR, 22–69 hours) after the CTP.
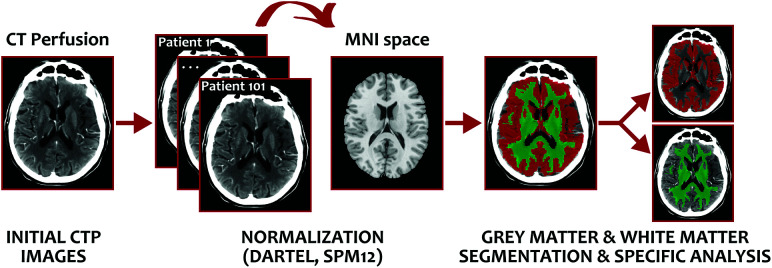
DWI lesion volumes were calculated using Amira software (Visage Imaging) through a semiautomated thresholding method to identify ROIs with a signal intensity exceeding the values in the contralateral hemisphere by >3 SDs.18 T1W1s were transferred into stereotaxic space using the diffeomorfic anatomical registration through exponentiated lie algebra (DARTEL) normalization algorithm in Statistical Parametric Mapping (SPM12; http://www.fil.ion.ucl.ac.uk/spm/), and the resulting GM and WM probabilistic maps obtained in the native space were used to obtain GM and WM segmentations (Fig 1). T1WI, DWI, GM, WM, and lesion masks were coregistered to the baseline CTP for posterior analysis. Moreover, due to the clinical practice nature of our MR imaging protocol, DWI could not be corrected for distortions before applying the normalization.
FIG 1.
Segmentation methodology for calculating WM- and WM-specific rCBF thresholds. MNI indicates Montreal Neurological Institute.
The increase in infarct volume was calculated by subtracting the baseline CTP ischemic core from the final infarct volume measured on DWI. We calculated a theoretic IG-corrected volume for CTP-based estimations by subtracting the IG from baseline imaging to complete reperfusion. Assuming a linear IG, we estimated the infarct progression rate by dividing the nonviable tissue volume by the time delay to imaging.19 Finally, the estimated IG was calculated by multiplying the estimated infarct progression rate by the time from baseline imaging to complete reperfusion (Online Supplemental Data).
Statistical Analysis and Outcome Measures
We assessed the yield of different relative CBF (rCBF) thresholds to predict the following: 1) infarcted voxels in coregistered DWI through receiver operating characteristic analysis, and 2) final DWI lesion volume (net difference of the estimation and intraclass correlation coefficient [ICC]). We used the ICC (2-way mixed model, absolute agreement for single measures) to study the association between the 2 repeat measurements of ischemic core (acute CTP and follow-up DWI) because the ICC measure reflects both the degree of correlation and agreement between measurements of continuous data. Reliability was considered good when the ICC was ≥0.80. When 2 different thresholds had similar performances according to the ICC and volume prediction, we chose the threshold that caused the least overestimation of the lesion compared with DWI. All these analyses were performed for the entire brain parenchyma and GM and WM separately. The theoretic IG correction was applied only in volume difference and ICC analyses. Continuous variables were reported as mean (SD) or median (IQR) as appropriate, and categoric variables, as proportions. Differences in proportions were studied with the χ2 or Fisher exact test. All analyses were performed using SPSS, Version 26.0 (IBM), and the level of significance was set at P < .05, 2-sided.
Data Availability
The data sets generated and analyzed during the current study are available from the corresponding author on reasonable request.
RESULTS
From 113 patients with full data available, we excluded 12 patients due to inaccurate WM and GM segmentation or poor CTP/MR imaging coregistration (see the flow diagram in the Online Supplemental Data). The main characteristics of the final cohort of 101 patients are summarized in the Online Supplemental Data.
Whole-Brain versus GM- and WM-Specific Thresholds
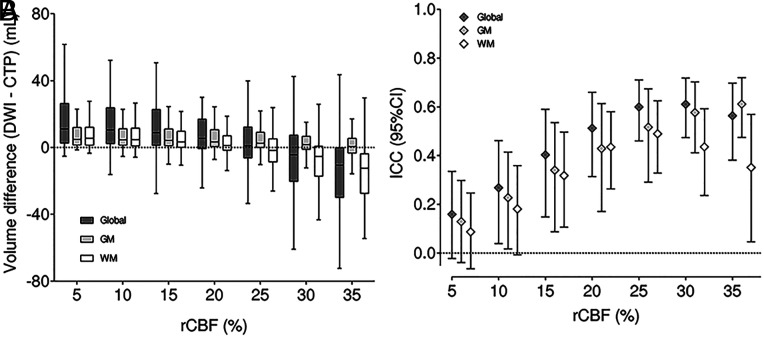
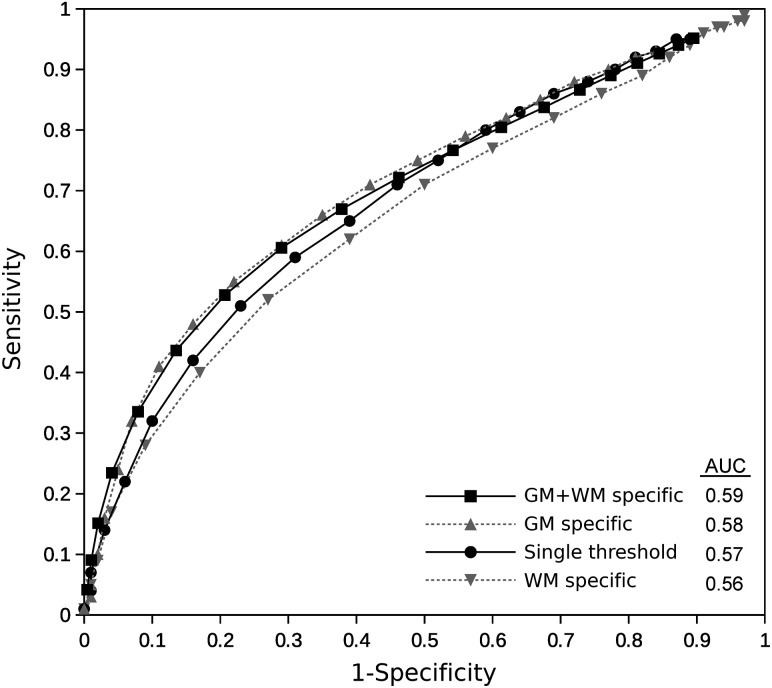
In the analysis of the final volume, the best single threshold was rCBF 25%. The best thresholds were different for GM (rCBF 35%) and WM (rCBF 20%). Furthermore, estimates in GM were more constant with less variations when changing the thresholds (Fig 2). A double GM- and WM-specific threshold of rCBF 45% and 30% was superior to a fixed threshold (rCBF 35%) in predicting infarcted voxels (Youden index, 0.32 versus 0.30). The fixed threshold underestimated lesions in GM and overestimated them in WM. The different thresholds between the volume prediction and the individual voxel prediction could be partially explained by the IG from CTP to MR imaging, which cannot be controlled in the voxel-based study (Fig 3). Subgroup analysis of patients with rapid (<60 minutes after CTP acquisition) complete endovascular reperfusion showed no differences in the results compared with the whole cohort.
FIG 2.
Distribution of rCBF thresholds for the infarct core prediction in the whole brain (dark gray), GM (light gray), and WM (white). The left image (A) represents the net infarct volume difference, and the right image (B) shows the ICC. Boxplots represent median (horizontal line in the inner box) 25% and 75% IQRs.
FIG 3.
Receiver operating characteristic curves showing the performance of the application of different global GM- and WM-specific and combined rCBF thresholds in the voxel-based analysis to predict tissue fate. The area under the curve (AUC) is for the single best threshold, best GM-specific, best WM-specific, and best GM- and WM-specific thresholds combined. No significant differences in the AUC values were found among the different thresholds applied.
Accounting for IG
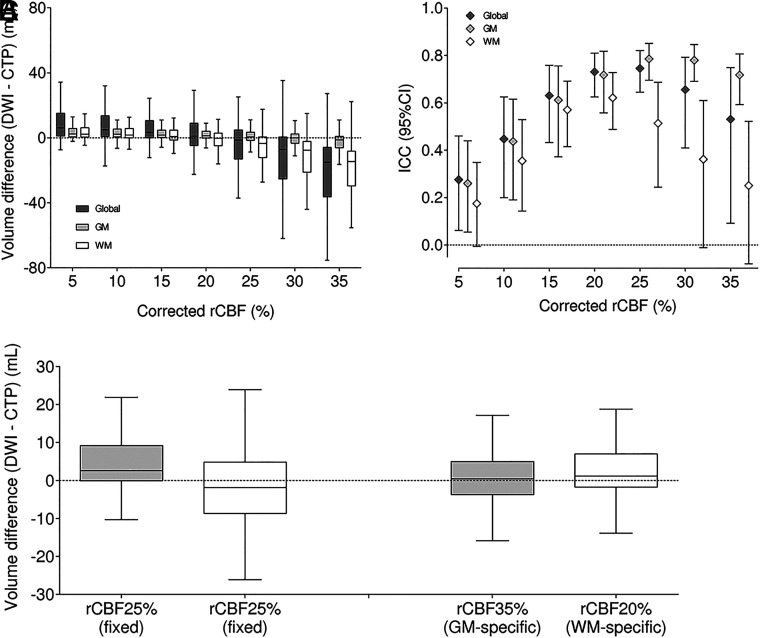
By means of standard rCBF 30% thresholds, the median time from CTP to complete reperfusion was 95 minutes (IQR, 80–122 minutes), and the median IG was 5.2 mL (IQR, 1.5–10.8 mL). Considering the estimated IG velocity and the time to complete reperfusion, we calculated the theoretic ischemic core in CTP for each case. The closest estimations of this IG-corrected core were based on the rCBF 20% threshold (Figs 4A, -B). The effect of accounting for IG occurred both on WM- and GM-specific thresholds. For GM, the best IG-corrected core was based on the rCBF 25% threshold, while for WM, it was the rCBF 15% threshold (Fig 4C). The combination of 25% for GM and 15% for WM yielded the most accurate representation of IG-corrected ischemic core.
FIG 4.
IG-corrected rCBF thresholds for defining infarct core in the whole brain (dark gray), GM (light gray), and WM (white). The left image represents the net infarct volume difference, and the right image shows the ICC (A and B). Accounting for the estimated IG from baseline imaging to complete reperfusion changes the optimal rCBF threshold for defining infarct core (C).
Spatial Distribution Analysis
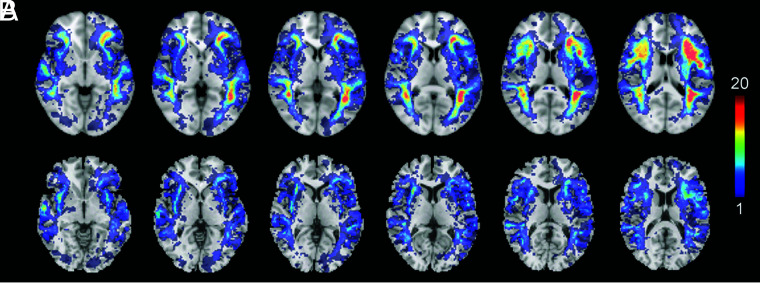
According to the results obtained by applying the standard rCBF 30% threshold, most false-positives (predicted infarcted tissue in CTP without an ischemic lesion in DWI) were limited to the subcortical WM, while true-positives (predicted infarcted tissue in CTP with an ischemic lesion in DWI) were more common in the GM of the basal ganglia (Fig 5A). However, by means of a dual GM-WM threshold based on the best performing values in the previous analysis (rCBF 20% for WM and 35% for GM; Fig 5B), the number of false-positives in the subcortical WM was notably lower.
FIG 5.
Heat map of the distribution of false-positives according to the following: the single rCBF 30% threshold most used in clinical practice (A) and a variable threshold in WM (rCBF 20%) and GM (rCBF 35%) (B). Warmer colors indicate a greater absolute accumulation of cases, while colder colors mean a lower absolute number of cases.
DISCUSSION
Establishing the extent of the ischemic core in the onset of an acute stroke is critical when considering reperfusion therapy. Although in routine clinical practice, an NCCT is sufficient to decide on treatment in patients with <6 hours from symptom onset, CTP-based definitions have often been used due to the availability of the technique and the fair correlations between the initial ischemic area predicted on CBF or CBV maps and the final lesion on DWI.20,21 However, some reports have challenged the value of CTP-based definitions.22 Core overestimation in WM has been highlighted as a focus of future effort to improve CTP accuracy.10 Here, we addressed 2 physiologically relevant simple issues that can be easily implemented in clinical practice. Advanced computing methods may further help in defining critically hypoperfused areas that predict the irreversible injury of the tissue,23 but the methodology described here may be enough to avoid overestimations of infarct volumes and undertreating patients who may benefit from reperfusion.
In agreement with previous studies,24 we found that GM showed more vulnerability to ischemia than WM, so applying a common, more traditional threshold for both tissues resulted in overestimating the infarcted area in WM while underestimating the ischemia effects on GM. In that same way, a specific threshold of rCBF 35% in GM and 25% in WM was better correlated with the final infarct on DWI. The greater stability of the GM estimations may be because perfusion is more constant in this tissue or because the final infarct volumes are smaller. The higher estimations of optimal thresholds in the prediction of the fate of individual voxels (a double GM-WM threshold of CBF 45% and 30%) could be due to the limitations of the latter analysis, favoring less specific thresholds. In accordance with this issue, establishing stricter thresholds in the voxel-based study is related to a greater error when coregistering. However, using a postprocessing program based on density differences between GM and WM entails less inherent error than in previous studies, which were based on probabilistic maps.25 Nevertheless, these results reflect the physiologic aspects of greater ischemia susceptibility on GM compared with WM,25,26 which is especially remarkable when optimal reperfusion is achieved and can be neutralized using tissue-specific CTP thresholds.
The reperfusion grade could be a crucial factor confounding the correct estimation of the final ischemic area due to variable IG from baseline to follow-up imaging. Although the rCBF 30% threshold was originally derived using a contemporaneous CTP-DWI model, in which the potential effect of reperfusion is less relevant,4 CTP is especially useful to predict the final infarct with a good correlation between ischemic cores estimated by rCBF 30% and DWI findings when no reperfusion therapies are administered.27 On the other hand, fixed rCBF thresholds may overestimate final infarct volume in the case of recanalization,28 and the overestimation is more relevant when the time from symptom onset to neuroimaging is shorter. It is unclear whether these findings are secondary to the actual reversibility of CBF and CBV lesions after reperfusion or only due to technical limitations. When complete reperfusion occurs, mainly when the time to reperfusion is short as it is in our cohort, it is common for the ischemic lesion to be mostly limited to GM. Collaterality, although not specifically analyzed in this study, also plays an important role in brain tissue viability and IG rate.18,29 For example, the hypoperfusion intensity ratio in a biomarker based on CTP reflects the presence of collateral flow and the eligibility of patients for reperfusion treatment in the acute phase.30,31 Using more specific CTP thresholds could be especially beneficial for avoiding overestimating infarct size in patients with good collaterals. Our study based on patients with a complete and short time to reperfusion showed a substantial overestimation of the final infarct on WM using a fixed threshold. Applying variable GM-WM thresholds offered a more precise estimation of the final ischemic core, with rCBF thresholds of 25% for GM and rCBF 15% for WM yielding the closest estimate of the IG-corrected core.
IG is also directly related to the time taken to complete the treatment. Theoretically, the penumbra region would become entirely ischemic core if there is no reperfusion, which is not expected to vary its volume time-wise. Ischemic core, however, is likely to expand with time each second the CBF is impaired. It is unclear whether the IG rate threshold varies according to the symptom-onset time to reperfusion,32 but it could change on the basis of the time from imaging to recanalization.33 Considering that the GM is less resistant to ischemia, a greater IG is expected at lower thresholds than in WM, as shown in our analysis. However, the IG correction is an approximation to a complex phenomenon, and results derived from it should be interpreted with caution.
The quality of the metrics used in the study (IG, volume differences, and so forth) rely on a good coregistration of the CTP and MR imaging techniques. Due to the inherent changes in tissue viability and, therefore, imaging quality and contrast, the coregistration (and segmentation) methodologies used in acute ischemic stroke studies are subject to technical errors. On the other hand, there is no established model of rapid tissue segmentation in routine clinical practice. In this work, as a proof of concept, we have used a more time-consuming postprocessing methodology (the DARTEL toolbox) to normalize coregistered T1WIs to obtain improved GW-WM segmentation compared with those obtained with NCCT. This segmentation, although better than that of NCCT, is not free of potential inaccuracies because the Montreal Neurological Institute templates are derived from much younger, healthier brains. Moreover, due to the clinical practice nature of our MR imaging protocol, DWIs could not be corrected for distortions before applying the normalization. Nevertheless, following the proof-of-concept nature of this work, we included only patients with final optimal CTP-MR imaging coregistration and WM-GM segmentation. If our approach is replicated in other cohorts and proved useful, future effort should focus on developing a system to improve CTP tissue segmentation fast enough to be used in clinical practice, for example, an atlas-based approach to obtain a rapid WM-GM segmentation in the CTP native space. CTP methods for the definition of ischemic core are an approximation to a dynamic and complex process. CTP acquisition parameters and postprocessing are a source of variability in the values obtained from perfusion maps. The CTP analysis was performed with the commercial software MIStar; therefore, our results may not be generalizable to other methodologies, and further studies with other available commercial software are warranted to confirm these results.
This study has some limitations, mainly related to its retrospective, observational design and the modest population size due to the strict inclusion criteria. However, it accurately represents the actual population and the decision-making issues tested in real-life clinical situations. In addition, its results tally with those obtained in previous studies and current knowledge about the effects of ischemia on the human brain. Also, only patients with complete recanalization were studied, so the generalizability of these results to other clinical contexts has to be analyzed in follow-up studies. An external validation would also reinforce these results. Establishing different thresholds in GM and WM based on their susceptibility to ischemia could enhance the precision of CTP to determine whether it is salvageable tissue, thus helping make therapeutic decisions. However, there is no established model of rapid segmentation in routine clinical practice, so future effort should focus on developing a system to improve CTP accuracy using these pathophysiologic principles adapted to daily practice.
CONCLUSIONS
GM- and WM-specific thresholds result in different thresholds for predicting infarcted tissue in CTP and increase the accuracy of the estimations regarding the tissue fate and total infarct volume of each voxel. IG from baseline to follow-up imaging can substantially alter the predictive value of different CTP-based definitions of ischemic core. Compared with the often-used threshold of rCBF 30%, more restrictive thresholds such as rCBF 20%, mainly referring to WM, may better estimate the actual extent of the infarcted tissue.
Acknowledgments
The authors thank the staff and participants of Hospital Clínic for their relevant contributions. This work was partially developed at the Centro Esther Koplowitz, Barcelona, Centres de Recerca de Catalunya Programme/Generalitat de Catalunya.
ABBREVIATIONS:
- ICC
intraclass correlation coefficient
- IG
infarct growth
- IQR
interquartile range
- rCBF
relative CBF
Footnotes
Alejandro Rodríguez-Vázquez and Carlos Laredo contributed equally to this work.
This study was supported by grants of the ISCIII-Subdirección General de Evaluación (FIS PI18/00444 and PI21/00966 to A. Chamorro and X. Urra) cofinanced by the Fondo Europeo de Desarrollo Regional. X.U. was sponsored by ISCIII (INT19/00020) and the European Social Fund “The ESF–Investing in your future,” A.R.-V. is funded by the “Emili Letang–Josep Font” research grant from the Hospital Clínic de Barcelona.
Disclosure forms provided by the authors are available with the full text and PDF of this article at www.ajnr.org.
References
- 1.Vagal A, Wintermark M, Nael K, et al. Automated CT perfusion imaging for acute ischemic stroke: Pearls and pitfalls for real-world use. Neurology 2019;93:888–98 10.1212/WNL.0000000000008481 [DOI] [PubMed] [Google Scholar]
- 2.Bivard A, Spratt N, Levi C, et al. Perfusion computed tomography: imaging and clinical validation in acute ischaemic stroke. Brain 2011;134:3408–16 10.1093/brain/awr257 [DOI] [PubMed] [Google Scholar]
- 3.Lin L, Bivard A, Krishnamurthy V, et al. Whole-brain CT perfusion to quantify acute ischemic penumbra and core. Radiology 2016;279:876–87 10.1148/radiol.2015150319 [DOI] [PubMed] [Google Scholar]
- 4.Campbell BC, Christensen S, Levi CR, et al. Cerebral blood flow is the optimal CT perfusion parameter for assessing infarct core. Stroke 2011;42:3435–40 10.1161/STROKEAHA.111.618355 [DOI] [PubMed] [Google Scholar]
- 5.Copen WA, Yoo AJ, Rost NS, et al. In patients with suspected acute stroke, CT perfusion-based cerebral blood flow maps cannot substitute for DWI in measuring the ischemic core. PLoS One 2017;12:e0188891 10.1371/journal.pone.0188891 [DOI] [PMC free article] [PubMed] [Google Scholar]
- 6.Boned S, Padroni M, Rubiera M, et al. Admission CT perfusion may overestimate initial infarct core: the ghost infarct core concept. J Neurointerv Surg 2017;9:66–69 10.1136/neurintsurg-2016-012494 [DOI] [PubMed] [Google Scholar]
- 7.Cereda CW, Christensen S, Campbell BC, et al. A benchmarking tool to evaluate computer tomography perfusion infarct core predictions against a DWI standard. J Cereb Blood Flow Metab 2016;36:1780–89 10.1177/0271678X15610586 [DOI] [PMC free article] [PubMed] [Google Scholar]
- 8.Dohmen C, Kumura E, Rosner G, et al. Adenosine in relation to calcium homeostasis: comparison between gray and white matter ischemia. J Cereb Blood Flow Metab 2001;21:503–10 10.1097/00004647-200105000-00004 [DOI] [PubMed] [Google Scholar]
- 9.Payabvash S, Souza LC, Wang Y, et al. Regional ischemic vulnerability of the brain to hypoperfusion: the need for location specific computed tomography perfusion thresholds in acute stroke patients. Stroke 2011;42:1255–60 10.1161/STROKEAHA.110.600940 [DOI] [PMC free article] [PubMed] [Google Scholar]
- 10.Hoving JW, Marquering HA, Majoie CB, et al. Volumetric and spatial accuracy of computed tomography perfusion estimated ischemic core volume in patients with acute ischemic stroke. Stroke 2018;49:2368–75 10.1161/STROKEAHA.118.020846 [DOI] [PubMed] [Google Scholar]
- 11.Saver JL. Time is brain–quantified. Stroke 2006;37:263–66 10.1161/01.STR.0000196957.55928.ab [DOI] [PubMed] [Google Scholar]
- 12.González RG, Hakimelahi R, Schaefer PW, et al. Stability of large diffusion/perfusion mismatch in anterior circulation strokes for 4 or more hours. BMC Neurol 2010;10;10:13 10.1186/1471-2377-10-13 [DOI] [PMC free article] [PubMed] [Google Scholar]
- 13.Suomalainen OP, Elseoud Abou A, Martinez-Majander N, et al. Is infarct core growth linear? Infarct volume estimation by computed tomography perfusion imaging. Acta Neurol Scand 2022;145:684–91 10.1111/ane.13601 [DOI] [PubMed] [Google Scholar]
- 14.Psychogios MN, Schregel K. Relativity of ischemic core volume estimation. Stroke 2018;49:2283–84 10.1161/STROKEAHA.118.022148 [DOI] [PubMed] [Google Scholar]
- 15.Bivard A, Levi C, Spratt N, et al. Perfusion CT in acute stroke: a comprehensive analysis of infarct and penumbra. Radiology 2013;267:543–50 10.1148/radiol.12120971 [DOI] [PubMed] [Google Scholar]
- 16.Laredo C, Renú A, Tudela R, et al. The accuracy of ischemic core perfusion thresholds varies according to time to recanalization in stroke patients treated with mechanical thrombectomy: a comprehensive whole-brain computed tomography perfusion study. J Cereb Blood Flow Metab 2020;40:966–77 10.1177/0271678X19855885 [DOI] [PMC free article] [PubMed] [Google Scholar]
- 17.Noser EA, Shaltoni HM, Hall CE, et al. Aggressive mechanical clot disruption: a safe adjunct to thrombolytic therapy in acute stroke? Stroke 2005;36:292–96 10.1161/01.STR.0000152331.93770.18 [DOI] [PubMed] [Google Scholar]
- 18.Renú A, Laredo C, Montejo C, et al. Greater infarct growth limiting effect of mechanical thrombectomy in stroke patients with poor collaterals. J Neurointerv Surg 2019;11:989–93 10.1136/neurintsurg-2018-014668 [DOI] [PubMed] [Google Scholar]
- 19.Renú A, Urra X, Laredo C, et al. Benefit from mechanical thrombectomy in acute ischemic stroke with fast and slow progression. J Neurointerv Surg 2020;12:132–35 10.1136/neurintsurg-2019-015064 [DOI] [PubMed] [Google Scholar]
- 20.Campbell BC, Yassi N, Ma H, et al. Imaging selection in ischemic stroke: feasibility of automated CT-perfusion analysis. Int J Stroke 2015;10:51–54 10.1111/ijs.12381 [DOI] [PubMed] [Google Scholar]
- 21.Benson J, Payabvash S, Salazar P, et al. Comparison of CT perfusion summary maps to early diffusion-weighted images in suspected acute middle cerebral artery stroke. Eur J Radiol 2015;84:682–89 10.1016/j.ejrad.2014.12.026 [DOI] [PubMed] [Google Scholar]
- 22.Bouslama M, Ravindran K, Harston G, et al. Noncontrast computed tomography e-stroke infarct volume is similar to RAPID computed tomography perfusion in estimating postreperfusion infarct volumes. Stroke 2021;52:634–41 10.1161/STROKEAHA.120.031651 [DOI] [PubMed] [Google Scholar]
- 23.Kasasbeh AS, Christensen S, Parsons MW, et al. Artificial neural network computer tomography perfusion prediction of ischemic core. Stroke 2019;50:1578–81 10.1161/STROKEAHA.118.022649 [DOI] [PMC free article] [PubMed] [Google Scholar]
- 24.Chen C, Bivard A, Lin L, et al. Thresholds for infarction vary between gray matter and white matter in acute ischemic stroke: a CT perfusion study. J Cereb Blood Flow Metab 2019;39:536–46 10.1177/0271678X17744453 [DOI] [PMC free article] [PubMed] [Google Scholar]
- 25.Arakawa S, Wright PM, Koga M, et al. Ischemic thresholds for gray and white matter: a diffusion and perfusion magnetic resonance study. Stroke 2006;37:1211–16 10.1161/01.STR.0000217258.63925.6b [DOI] [PubMed] [Google Scholar]
- 26.Bristow MS, Simon JE, Brown RA, et al. MR perfusion and diffusion in acute ischemic stroke: human gray and white matter have different thresholds for infarction. J Cereb Blood Flow Metab 2005;25:1280–87 10.1038/sj.jcbfm.9600135 [DOI] [PubMed] [Google Scholar]
- 27.Demeestere J, García-Esperón C, García-Bermejo P, et al. Evaluation of hyperacute infarct volume using ASPECTS and brain CT perfusion core volume. Neurology 2017;88:2248–53 10.1212/WNL.0000000000004028 [DOI] [PMC free article] [PubMed] [Google Scholar]
- 28.Angermaier A, Khaw AV, Kirsch M, et al. Influence of recanalization and time of cerebral ischemia on tissue outcome after endovascular stroke treatment on computed tomography perfusion. J Stroke Cerebrovasc Dis 2015;24:2306–12 10.1016/j.jstrokecerebrovasdis.2015.06.025 [DOI] [PubMed] [Google Scholar]
- 29.Rao VL, Mlynash M, Christensen S, et al. Collateral status contributes to differences between observed and predicted 24-h infarct volumes in DEFUSE 3. J Cereb Blood Flow Metab 2020;40:1966–74 10.1177/0271678X20918816 [DOI] [PMC free article] [PubMed] [Google Scholar]
- 30.Guenego A, Marcellus DG, Martin BW, et al. Hypoperfusion intensity ratio is correlated with patient eligibility for thrombectomy. Stroke 2019;50:917–22 10.1161/STROKEAHA.118.024134 [DOI] [PubMed] [Google Scholar]
- 31.Guenego A, Mlynash M, Christensen S, et al. Hypoperfusion ratio predicts infarct growth during transfer for thrombectomy. Ann Neurol 2018;84:616–20 10.1002/ana.25320 [DOI] [PubMed] [Google Scholar]
- 32.Qiao Y, Zhu G, Patrie J, et al. Optimal perfusion computed tomographic thresholds for ischemic core and penumbra are not time dependent in the clinically relevant time window. Stroke 2014;45:1355–62 10.1161/STROKEAHA.113.003362 [DOI] [PubMed] [Google Scholar]
- 33.d’Esterre CD, Boesen ME, Ahn SH, et al. Time-dependent computed tomographic perfusion thresholds for patients with acute ischemic stroke. Stroke 2015;46:3390–97 10.1161/STROKEAHA.115.009250 [DOI] [PubMed] [Google Scholar]
Associated Data
This section collects any data citations, data availability statements, or supplementary materials included in this article.
Data Availability Statement
The data sets generated and analyzed during the current study are available from the corresponding author on reasonable request.


