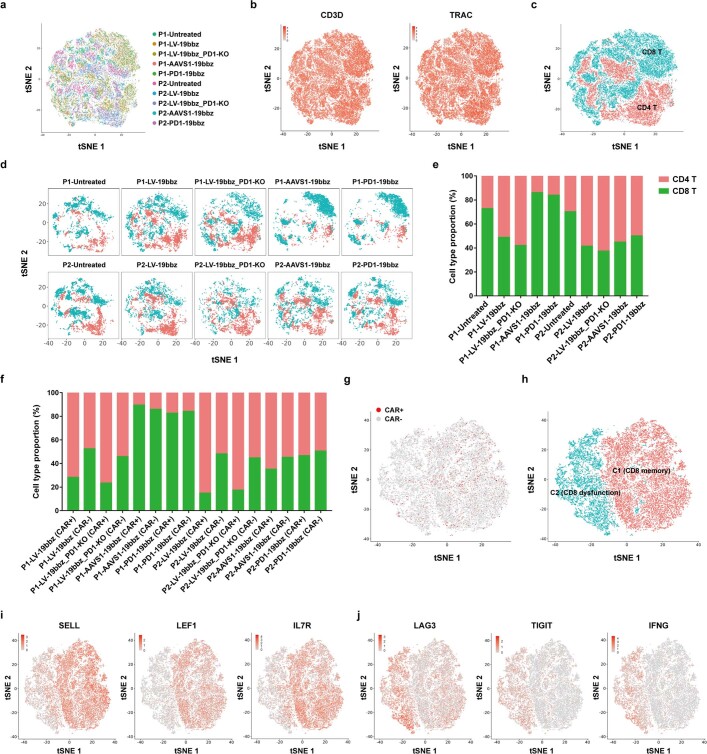
Extended Data Fig. 8. Single-cell RNA sequencing analysis of CAR-T cells prepared by different methods.
a, Overview of the 63,789 cells that passed quality control (QC) for single-cell analysis. Cells are color coded by sample, respectively, in the t-distributed stochastic neighbor embedding (tSNE) plot. b, Expression of T cell marker genes (CD3D, TRAC) in the tSNE plots. c, Cells are color coded by CD4+ and CD8+ cells in the tSNE plot. d, tSNE plots showing CD4+ and CD8+ cell clusters in each sample. e-f, CD4+ and CD8+ cell proportion in total (e), CAR+ and CAR− (f) samples. g-j, CD8+ T cells were analysed in the samples prepared by different methods. g, Distribution of CAR+ and CAR− cells in the tSNE plot. h, tSNE plot showing two clusters in the samples. Cluster 1 (C1) and cluster 2 (C2) were generated by clustering CD8 memory and dysfunction/cytotoxicity marker genes, respectively. i, Expression of representative CD8 memory genes (SELL, LEF1, IL7R) in the tSNE plots. j, Expression of representative CD8 dysfunction/cytotoxicity genes (LAG3, TIGIT, IFNG) in the tSNE plots.

