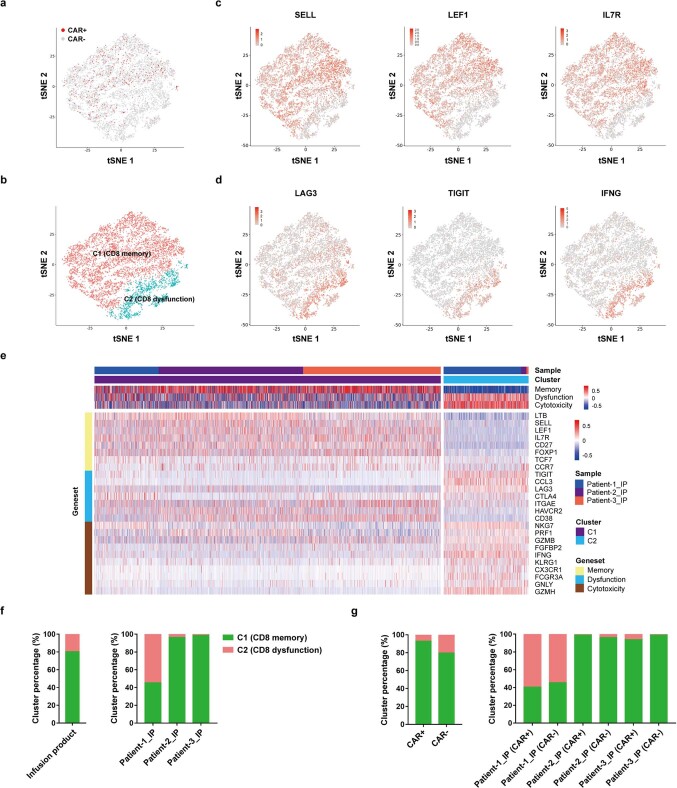
Extended Data Fig. 13. Proportion of CD8 memory and dysfunction clusters in infusion products.
CD8+ T cells were analysed in the infusion products of three patients. a, Distribution of CAR+ and CAR− cells in the tSNE plot. b, tSNE plot showing two clusters in the infusion products. C1 and C2 were generated by clustering CD8 memory and dysfunction/cytotoxicity marker genes, respectively. c, Expression of representative CD8 memory genes (SELL, LEF1, IL7R) in the tSNE plots. d, Expression of representative CD8 dysfunction/cytotoxicity genes (LAG3, TIGIT, IFNG) in the tSNE plots. e, Heat map showing scaled expression of memory, dysfunction and cytotoxicity genes in two CD8+ T cell clusters. The GSVA scores of CD8 memory, dysfunction and cytotoxicity signatures are shown at the top. f, Percentages of C1 and C2 in mixed and individual samples of infusion products. g, Comparison of C1 and C2 proportion between CAR+ and CAR− cells in mixed and individual samples of infusion products.

