

Abstract

A 2-PAM@bio-MOF-1 composite was prepared by cationic exchange of counter N,N-dimethylammonium cations in the pores of the anionic, biocompatible metal–organic framework (bio-MOF-1) with pralidoxime chloride (2-PAM-Cl) by impregnation. In vitro drug release measurements revealed that the release rate of 2-PAM from 2-PAM@bio-MOF-1 in simulated body fluid (SBF) was more than four-fold higher than that in deionized water, indicating that the presence of endogenous cations in SBF triggered the release of 2-PAM through cation exchange. The release of 2-PAM was rapid within the first 10 h but was much slower over the period of 10–50 h. At room temperature, the maximum release rate of 2-PAM was 88.5% (15 mg of 2-PAM@bio-MOF-1 in 1 mL of SBF), indicating that the drug was efficiently released from the composite MOF in SBF. In simulated gastric fluid, 64.3% of 2-PAM was released from bio-MOF-1 into the simulated gastric fluid after 50h. This suggested that 2-PAM@bio-MOF-1 might be effective for enabling the slow release of 2-PAM in the human body. Indeed, the maximum reactivation rate of acetylcholinesterase in sarin-poisoned mice reached 82.5%. In addition, 2-PAM@bio-MOF-1 demonstrated the ability to adsorb and remove sulfur mustard (HD) in solution and from the skin of guinea pigs.
Introduction
Organophosphorus-based cholinergic nerve agents, such as sarin and soman, are highly toxic substances that have been used historically as chemical warfare agents.1,2 They interfere with the human nervous system by inhibiting acetylcholinesterase (AChE) activity, resulting in the accumulation of acetylcholine (Ach) in the human body, thereby making the central nervous system continuously excited.3,4 Exposure of the body to high concentrations of these substances can be quickly lethal.5,6 Pralidoxime chloride (2-PAM-Cl), an oxime-containing organic cationic compound, has been commonly used in the treatment of neurotoxic poisoning because it can reactivate phosphorylated AChE.7 To avoid acute toxicity from ingestion of cholinergic nerve agents, poisoned victims will undergo follow-up treatment depending on the severity and progression of the disease.8 Nerve agents that do not get metabolized in the body will distribute into tissues, where they will be stored and slowly released into systemic circulation, resulting in persistent toxicity; this persistent toxicity requires more sustained administration of reactivators9 or anticholinergic drugs10 after poisoning, which requires monitoring the AChE activity in the patients’ blood.11 To overcome any inconveniences associated with repeated administration and to maintain a constant and stable blood concentration of the reactivator, the continuous intravenous injection of 2-PAM-Cl is widely used in clinical practice. However, controlling the dosage and maintaining a stable concentration of the reactivator in blood plasma is difficult via this method. In addition, an insufficient dosage may not be sufficient to overcome the toxicity associated with the neurotoxic agent, while too high of a dosage will result in overdose because the agents inhibit the function of the respiratory system and cause respiratory arrest.12−14 Therefore, the development of a stable and continuous delivery system for 2-PAM that can overcome these issues has significant theoretical and practical advantages for the treatment of neurotoxic agent poisoning.
Metal–organic frameworks (MOFs) are compounds, in which metal ions/clusters, serving as vertices, are coordinated to each other through organic ligands (i.e., connecting the vertices to form a periodic structure). MOFs typically feature high porosities, excellent chemical stabilities, and tunable pores.15,16 Several biocompatible MOFs have been developed and have demonstrated to be suitable candidates for use as drug delivery systems.17,18 Among these MOFs, bio-MOF-1 of the formula Zn8(ad)4(BPDC)6O·2Me2NH2+·8DMF·11H2O (ad = adenine, H2BPDC = 4,4′-biphenyldicarboxylic acid) is a biocompatible MOF, in which adenine molecules are coordinated by central Zn2+ ions.19 In its structure, the secondary units consisting of adenine and Zn2+ are linked by the BPDC2- ligand to form an infinitely extending three-dimensional framework (pcu network topology).20 The negatively charged skeleton of bio-MOF-1 features cationic Me2NH2+ groups, and DMF and water are present in the pores of the MOF. The anionic properties of the bio-MOF-1 skeleton could facilitate its use as a potential material for the storage and release of cationic drug molecules. In addition, the physiological toxicity of bio-MOF-1 is low, and all components can be metabolized by the human body, which support this potential. Given that 2-PAM is a cationic drug, it was speculated that 2-PAM could be loaded into the pores of the bio-MOF-1 skeleton by cation exchange of the Me2NH2+ ions with the drug molecules. Once in the body, the controlled release of 2-PAM from the MOF could be achieved, in theory, by cationic exchange with endogenous cations (e.g., sodium ions) (Scheme 1).
Scheme 1. Schematic Diagram of the Synthesis of 2-PAM@bio-MOF-1 by Exchanging Me2NH2+ and 2-PAM in Bio-MOF-1, as well as Sustained Release of 2-PAM Facilitated by Exchange of 2-PAM with Metal Cations in Bodily Fluids.

After exposure to the skin, erosive poisons, such as mustard gas (HD), can cause erythema, blistering, and ulceration. However, because the toxicological mechanism of HD in the human body remains unclear, no specific drugs have been successfully developed for treating HD poisoning.21 Currently, the use of materials like activated clay to decontaminate and/or eliminate HD as quickly as possible after skin exposure remains the most effective measure to reduce further casualties after exposure to HD.
Considering these deficiencies, we report herein the synthesis and characterization of 2-PAM@bio-MOF-1, in which the bio-MOF-1 carrier was loaded with 2-PAM via cation exchange of the N,N-dimethylammonium cations in the bio-MOF-1. The therapeutic performance of 2-PAM@bio-MOF-1 in sarin-poisoned mice and its decontamination effectiveness against HD on the skin of guinea pigs were investigated. The results indicated that 2-PAM@bio-MOF-1 is a promising treatment for late-stage neurogenic organophosphate poisoning and has the potential to adsorb and remove erosive poisons, such as HD, on the skin surface.
Experimental Section
Chemicals and Reagents
All reagents used in this study were of analytical grade and used as obtained without further purification. Mustard gas (HD, 95%), sarin (GB, 95%), activated white clay, and active skin detergent were provided by the Chinese Academy of Military Medical Sciences (Beijing, China). Bio-MOF-1 was prepared by a previously reported method19 and characterized by elemental analysis, infrared spectroscopy (IR), scanning electron microscopy (SEM), and powder X-ray diffraction (P-XRD).
A simulated body fluid (SBF) was prepared according to the reported procedure.22 (Supporting Information).
Caution! GB can only be handled in very small quantities by well-trained person in a special-designed fume cupboard due to its high toxicity.
Animals
Two to three week old male Kunming mice (20–24 g) and male guinea pigs (300–350 g) were obtained from Beijing Weitonglihua Experimental Animal Technology Co., Ltd. and kept in stainless steel cages with hardwood chips. The cages were stored in a room at a temperature of 25 ± 1 °C and a relative humidity of 55 ± 5% and under 12-h cycles of dim light (150–300 Lux) and darkness. The animals were provided free access to food and water for 1 day before the experiments. All experiments were performed in compliance with the Institutional Animal Care and Use Committee (IACUC) of Beijing Institute of Pharmacology and Toxicology and other relevant guidance and laws. The doses of the drugs or poisons were calculated based on the average weight of mice (22 g).
Instruments
IR spectra were recorded on an ICAN9 Fourier transform infrared spectrometer (Tianjin Energy Spectrum Technology Co., Ltd.) using the KBr pellet method over the range of 4000–400 cm–1. UV–vis spectra were obtained on a UV-2550 ultraviolet–visible spectrophotometer (Shimadzu Corp., Japan) over the spectral window of 200–500 nm. A multifunctional microplate reader (Spectra Max (M5), UK) was used to measure the absorption of 5,5-dithiobis-(2-nitrobenzoic acid) at a wavelength of 412 nm to determine the reactivation rate of AChE. Powder X-ray diffraction (XRD) spectra were recorded using a Rigaku D/max 2500 X-ray diffractometer (Rigaku, Japan) using Cu Kα radiation as the X-ray source (λ = 0.15405 nm). The samples were scanned over the 2θ range of 5–50° at a scanning rate of 10 °/min. N2 adsorption/desorption isotherms were obtained using a BET [(Quantachrome)-AUTOSORB-1 surface area analyzer. The samples were degassed at room temperature (25 °C) for 8 h and measured at 77 K. The thermal stability of the samples was characterized by thermogravimetric analysis-differential scanning calorimetry (TGA-DSC) using an STA449 simultaneous thermal analyzer (NETZSCH, Germany)]. The samples were heated from 25 to 800 °C at a rate of 10 °C/min under a stream of air. Scanning electron microscopy (SEM, Supra55, Zeiss) was employed to study the morphology of the MOF samples. Elemental analysis for C, H, and N was conducted on a Vairo EL CUBE analyzer (Elementar Analysensysteme GmbH, Germany), and analysis for Cl was performed by inductively coupled plasma–mass spectrometry (ICP–MS) on a 7500 series ICP–MS (Shimadzu Corp., Japan). Gas chromatography–mass spectrometry (Agilent GC (7890B)-MS (5977A)) with a HP-5 GC column (30 m × 250 μm × 0.25 μm) was used to analyze the degradation products of HD. The electron ionization (EI) source energy was 70 eV, the EI source temperature was 230 °C, the quadrupole temperature was 150 °C, and the initial column temperature was 50 °C; the column was maintained at 50 °C for 1 min, heated to 280 °C at a rate of 10 °C/min, and then maintained at 280 °C for 5 min.
Preparation of 2-PAM@bio-MOF-1
10 mL of a 0.1 M solution of 2-PAM-Cl was added to soak bio-MOF-1 (50 mg) in a tube for 10 min, then the solution was dumped after centrifugation. Another fresh 10 mL of 0.1 M 2-PAM-Cl solution was added. The resulting suspension was then stirred at room temperature for 24 h, after which the solid sample was isolated by filtration. This step was repeated three times. Following, the sample was rinsed with deionized water and dried at 120 °C to obtain the 2-PAM@bio-MOF-1 composite [Zn8(ad)4(BPDC)6O·8(pyridinealdoxime)+·6Cl–·12H2O; C160H176O45N36Zn8Cl6]. Elemental analysis (calculated values) revealed that the composition of C, H, N, and Cl in the 2-PAM@bio-MOF-1 was 47.50% (47.34%), 4.03% (4.37%), 11.85% (12.42%), and 5.01 (5.24), respectively.
In Vitro Release of 2-PAM from 2-PAM@bio-MOF-1
The 2-PAM@bio-MOF-1 composite (15 mg) was added to 1 mL of SBF in a 4 mL centrifuge tube. The tube was immersed in a water bath at 37 °C, during which 200 μL of the solution was removed from the centrifuge tube at various times (vide infra) within 50 h and diluted with SBF to 4 mL. After each extraction of the sample solution, 200 μL of fresh SBF was added to replace the volume removed. The release rate (η) of 2-PAM from 2-PAM@bio-MOF-1 in the sample solutions was determined by monitoring the change in the absorbance at 294 nm (Supporting Information, Figures S1 and S2), from which the amount of drug released was calculated based on eq 1 below
| 1 |
where C0 was the initial concentration of the drug, and CA was the concentration of the released drug. In the control group, the contents of 2-PAM in simulated gastric fluid (pH = 1.2) and deionized water were measured by the same method.
Determination of the Median Lethal Dose (LD50) of Sarin by Intragastric Administration
Sarin (5 μL, 95% purity) was diluted with physiological saline to 5 mL to prepare a stock solution of sarin. Working solutions with concentrations of 0.077, 0.062, 0.049, and 0.039 μg/μL were prepared by diluting the stock solution with physiological saline; these working solutions of sarin served as the poisons for the mice. Aliquots (0.2 mL) of the working sarin solutions were administered to the mice in each group (n = 8) at doses of 700.0, 559.1, 445.5, and 359.1 μg/kg (in total four groups) by oral gavage. The LD50 of sarin was calculated based on the number of deaths of the mice in each group using the Blue Cosmos Studio LD50 data processing 1.00 package program.
Determination of the dose of 2-PAM-Cl was needed to fully rescue the mice poisoned by intragastric administration of 1.5 × LD50 sarin. A stock of solution of sarin was prepared by diluting 5 μL of sarin (95%) with physiological saline to 5 mL. The stock solution was diluted to 0.081 μg/μL to prepare a working solution of sarin that was used as the poison for mice. Each mouse in each group (n = 8) was administered 0.2 mL of the 0.081 μg/μL sarin solution by oral gavage (corresponding poison dose was 1.5 × LD50 = 736.4 μg/kg, value determined in Section 3.8). After 0.5 min, each mouse was intragastrically administered 0.2 mL of 1.1 mg/mL atropine (corresponding dose = 10 mg/kg)23 and 0.2 mL of either 1.65 or 3.3 mg/mL 2-PAM-Cl (corresponding doses = 15 or 30 mg/kg).24 Finally, the full-rescue dose of 2-PAM-Cl was determined based on the minimum dosage of 2-PAM-Cl required to prevent the mice in each group from dying in 24 h after being poisoned.
Dosage of 2-PAM@bio-MOF-1 in the Treatment of Mice Poisoned by 1.5×LD50 Sarin
To calculate the initial dose of 2-PAM@bio-MOF-1 administered to each mouse after 1.5 × LD50 sarin poisoning, the full-rescue dose of 2-PAM-Cl obtained above was divided by the loading rate of 2-PAM@bio-MOF-1. Herein, 2-PAM-Cl was replaced with 0.2 mL of either 15.6 or 31.2 mg/mL 2-PAM@bio-MOF-1 (corresponding dose of 2-PAM@bio-MOF-1 for each mouse was 141.8 or 283.6 mg/kg). The dose of 2-PAM@bio-MOF-1 for the treatment of mice poisoned by 1.5×LD50 sarin in order to study the reactivation rate of AChE in mice was determined based on the minimum dose needed for more than four mice in each group to survive within a 24 h period.
Determination of the Reactivation Rate of AChE in Mice Treated with 2-PAM@bio-MOF-1 with Atropine after 1.5 × LD50 Sarin Poisoning
The AChE activity in the mice was determined based on the following method.25 First, AChE reacts with thioacetylcholine to produce thiocholine and acetate, after which thiocholine reacts with the sulfhydryl group in 5,5-dithiobis-2-nitrobenzoic acid (DTNB) to produce 2-nitro-5-thiobenzoate, which ionizes in solution to produce a yellow-colored species (TNB2–). Therefore, the change in the absorbance of the assay solution due to the production of TNB2– could be directly correlated to the AChE activity. First, the AChE activity in mice without sarin poisoning (normal group)26 was determined. The inner wall of a 1.5 mL centrifuge tube was first washed with a 5% heparin sodium solution in water, after which 1 mL of blood was removed from the eyes of six mice and added to the heparin-coated centrifuge tubes. The tubes were centrifuged at 3000 rpm and 4 °C for 8 min, the uppermost layer (plasma) was removed, while the pelleted erythrocytes in the tube were rinsed with normal saline several times, and after each wash by centrifugation, the plasma was removed to obtain the erythrocytes. The erythrocytes (10 μL) were extracted and added to a 1.5 mL centrifuge tube followed by 70 μL of saline and 30 μL of 3 mmol/L ATCh. The tubes were incubated in a water bath at 37 °C for 20 min and then centrifuged at 3500 rpm and 4 °C for 5 min. The supernatant (60 μL) was extracted from the centrifuge tube and added to a 2 mL centrifuge tube. The supernatant was diluted with 800 μL of normal saline followed by 200 μL of a 0.073 mol/L solution of DTNB to obtain a light-yellow-colored solution. The absorbances of the solutions were measured at 412 nm (absorbance maximum of DTNB) using a microplate reader after 2 min. The average of the measured absorbances was calculated and denoted as OD412nm (normal group).
Second, the reactivation rate of AChE in mice after poisoning with 1.1 × LD50 sarin (exposed group) was then determined. Each group consisted of six mice, and each mouse was intragastrically administered 2 mL of 0.059 μg/μL sarin solution (corresponding dose to each mouse was 1.1 × LD50 = 540.0 μg/kg, which was the maximum dose of sarin poisoning by intragastric administration when all mice were alive). First, the inside of a 1.5 mL centrifuge tube was washed with a 5% solution of heparin sodium in water. Blood was then extracted from the eyes of the sarin-poisoned mice in the different groups at regular time intervals over the course of 72 h and added to the heparin-coated centrifuge tubes (vide infra). The tubes were centrifuged at 3000 rpm and 4 °C for 8 min, and the plasma layer (upper part in the centrifuge tube) was removed. The erythrocyte layer (highest-density layer in the centrifuge tube) was rinsed with normal saline several times and centrifuged, after which the plasma layer was removed each time to obtain the red blood cells. Aliquots (10 μL) of the erythrocyte layer were extracted and added to a 1.5 mL centrifuge tube followed by 70 μL of saline and 30 μL of 3 mmol/L ATCh. The centrifuge tube was incubated in a water bath at 37 °C for 20 min and centrifuged at 3500 rpm and 4 °C for 5 min. Then, 60 μL of the resulting supernatant was removed, added to a 2 mL centrifuge tube, and diluted with 800 μL of normal saline followed by 200 μL of a 0.073 mol/L DTNB solution to obtain a light-yellow-colored solution. The absorbance of the solution was measured at 412 nm using a microplate reader within 2 min. The average absorbance was calculated and denoted as OD412nm (poisoned). The AChE reactivation rate [enzyme reactivation rateexposure (%)] of the mice after poisoning by 0.2 mL of 0.059 μg/μL sarin was calculated at regular intervals over a 28 h period from the measured absorbances using eq 2.27
| 2 |
Lastly, the reactivation rate of AChE in the 1.5 × LD50 sarin-poisoned mice treated with 2-PAM@bio-MOF-1 and atropine (treatment group) was determined. This procedure was similar to the previous protocol, except that the 0.2 mL of 0.059 μg/μL sarin (the corresponding dose to each mouse was 1.1 × LD50 = 540.0 μg/kg) in Part (B) was replaced with 0.2 mL of 0.081 μg/μL sarin (the corresponding dose to each mouse was 1.5 × LD50 = 540.0 μg/kg). After being poisoned by sarin, the mice were immediately treated with 0.2 mL of 1.1 mg/mL atropine (the corresponding dose to each mouse was 10 mg/kg) and 0.2 mL of 31.2 mg/mL 2-PAM@bio-MOF-1 (the corresponding dose to each mouse was 283.6 mg/kg). The average absorbance for each group was calculated and denoted as OD412nm (treatment). Using the measured absorbance, eq 3 was used to calculate the AChE reactivation rate (enzyme reactivation ratetreatment, %) of the mice poisoned by 0.2 mL of 0.081 μg/μL sarin at regular intervals over a 28 h period.27
| 3 |
Elimination of HD by 2-PAM@bio-MOF-1
Elimination of HD by 2-PAM@bio-MOF-1 was evaluated according to a previously reported method.28 First, 100 mg of 2-PAM@bio-MOF-1 was divided into five 1.5 mL centrifuge tubes (corresponding to 20 mg for each tube). HD (2 μL) was added to each centrifuge tube, which was then shaken to allow even mixing, and the samples were left to stand for varying periods of time (1, 2, 3, 4, and 5 h, respectively) to allow the HD and 2-PAM@bio-MOF-1 to react. Following, 1 mL of n-hexane was added to the tube to extract the free HD for 5 min. After centrifuging the tubes, 25 μL of the n-hexane extract was removed and added to a 5 mL centrifuge tube, to which another 75 μL of n-hexane was added. Then, 100 μL of absolute ethanol and 200 μL of the blue reagent [prepared by dissolving NaOH (0.2 g) and thymolphthalein (1.2 g) in a solution consisting of 12.5 mL of water and 87.5 mL of absolute ethanol] were added into each of the tubes, respectively. The tubes were sealed, incubated in a water bath at 80 °C for 15 min, and then allowed to cool to room temperature. Then, 5 μL of 6 mol/L glacial acetic acid was added to each tube. After mixing, the color of the solutions changed from blue to orange-yellow. Finally, 3 mL of 95% ethanol solution was added. The absorbances of the solutions were measured at 445 nm using a UV–vis spectrophotometer (Supporting Information, Figure S3), and the elimination rate of HD was calculated using eq 4 below
| 4 |
where C0 and CA were the concentrations of HD before and after elimination by 2-PAM@bio-MOF-1, respectively.
Due to the extreme toxicity of HD, CEES (mustard gas simulant) was used to replace HD to help determine the elimination products of HD, 2-PAM@bio-MOF-1 (20 mg) and 2 μL of CEES were added to a 1.5 mL centrifuge tube, and the tube was shaken for 5 min to allow full contact with the composite and left to stand in a fume hood for 5 h. Following, 1 mL of dichloromethane was added to the tube, and the tube was kept for 5 min and then centrifuged. A 1 mL aliquot of the supernatant was collected and analyzed by GC–MS for identification of the elimination products.
Skin Decontamination of Guinea Pigs Exposed to HD by 2-PAM@bio-MOF-1 and Bio-MOF-1
To evaluate the ability of 2-PAM@bio-MOF-1 and bio-MOF-1 to decontaminate the skin of animals exposed to HD, guinea pigs were selected as the animal model. One day before the experiment, Na2S solution(8 g of Na2S dissolved in 100 mL of deionized water) was used as a depilatory and applied to the hair on both sides of the spine of the guinea pigs. After the application of the depilatory for about 3 min, the applied area was rinsed repeatedly with warm water until no depilatory remained.29 A total of 30 guinea pigs were randomly divided into five groups: the blank control group (no treatment after depilation), the poisoned group (poisoned only), the activated clay-treated group, the 2-PAM@bio-MOF-1-treated group, and the bio-MOF-1-treated group. The next day, the guinea pigs were anesthetized with chloral hydrate (300 mg/kg) before the experiments commenced. Then, an area (3 cm diameter) of the undamaged skin of the back was labeled, and 2 μL of neat HD was dropped onto the center of this area. After 1 min, 20 mg of each treatment sample was applied to the skin in this area, and the irritation response was observed after 24, 48, and 72 h. The skin surface irritation responses were scored according to Table 1,30 and the average score (stimulus index) of each guinea pig during the observation period was calculated using eq 5 below
| 5 |
Table 1. Criteria for Scoring of Skin Irritationa.
| skin irritation response | score of skin irritation response | |
|---|---|---|
| formation of erythema | none | 0 |
| barely visible | 1 | |
| obvious | 2 | |
| severe | 3 | |
| purple-red erythema with eschar | 4 | |
| formation of edema | none | 0 |
| barely visible | 1 | |
| the skin is raised and the contour is clear | 2 | |
| edema uplift about 1 mm | 3 | |
| edema bulge more than 1 mm | 4 |
The criteria adopted in this work comply with that reported in ref (31)
Results and Discussion
Characterization of 2-PAM@bio-MOF-1
Figure 1 shows the FT-IR spectra of bio-MOF-1, 2-PAM-Cl, and 2-PAM@bio-MOF-1. In the FT-IR spectrum of bio-MOF-1, IR bands were observed at 3341 and 3188 cm–1, which corresponded to the characteristic N–H stretching vibrations of the free amines in the adenine molecules. The band at 1590 and 1401 cm–1 correspond to the stretching vibrations of the C=C bond on the benzene rings. The presence of these bands was consistent with IR data reported previously.32,33 In the infrared spectra of 2-PAM-Cl, the bands at 3085, 1502, and 1016 cm–1 correspond to the stretching vibrations of C–H bonds, the stretching vibrations of C=N bonds, and the bending vibrations of the C–H bonds on the pyridine ring.34 Additionally, in the FT-IR spectrum of 2-PAM@bio-MOF-1, bands appeared at 1687 and 1428 cm–1, which were attributed to bio-MOF-1. The bands appeared at 3085, 1502, and 1016 cm–1, which were attributed to 2-PAM-Cl. It indicated that 2-PAM was successfully incorporated into bio-MOF-1 without changing its structure. More detailed spectral data are listed in Table S1.
Figure 1.

FT-IR spectra of 2-PAM-Cl, bio-MOF-1, and 2-PAM@bio-MOF-1 over the spectral window of 4000–400 cm–1 after preparing a KBr pellet of each sample.
Figure 2 (left) displays the P-XRD spectra of 2-PAM@bio-MOF-1, bio-MOF-1, and 2-PAM@bio-MOF-1 after release of 2-PAM. The P-XRD spectrum of bio-MOF-1 was consistent with previously reported XRD data,35 corroborating the successful synthesis of bio-MOF-1. The loading of 2-PAM into bio-MOF-1 did not change the XRD pattern of the MOF significantly, indicating that 2-PAM did not alter the structure of bio-MOF-1 and that 2-PAM was highly dispersed throughout the pores of the bio-MOF-1. After drug release, the structure of bio-MOF-1 (curve c) remained unchanged, as evidenced by the almost intact P-XRD pattern. These results suggested that bio-MOF-1 was highly stable in the release solution and further demonstrated that the drug was released slowly and steadily in the later stage of the drug release experiment.
Figure 2.

Left: P-XRD spectra of (a) 2-PAM@bio-MOF-1, (b) bio-MOF, and (c) 2-PAM@bio-MOF-1 after drug release; (d) simulated P-XRD spectrum of bio-MOF-1. Right: SEM images of bio-MOF-1 (a) and 2-PAM@bio-MOF-1 after the 2-PAM release experiment (b).
Figure 2 (right) shows the SEM images of bio-MOF-1 and 2-PAM@bio-MOF-1 after 2-PAM release. As a result of the synthetic conditions used, the bio-MOF-1 crystallized into tetragonal prisms with quadrangular pyramids on both sides, the sizes of which were approximately 20 μm in length (Figure 2 (right, a). The formation of these large, single crystals was consistent with previous studies.32 As shown in Figure 2 (right, b), the crystal morphology of 2-PAM@bio-MOF-1 after release of 2-PAM remained almost the same as that of pristine bio-MOF-1, despite slight damages to the external surface of the crystals, which might have been attributed to mechanical stirring when the bio-MOF-1 was immersed into the solution of 2-PAM to prepare the 2-PAM@bio-MOF-1.36 The results showed that the structure of bio-MOF-1 remained stable during long time drug release.
Figure S4 shows the N2 adsorption/desorption isotherms of bio-MOF-1 and 2-PAM@bio-MOF-1 at 77 K. As observed, the N2 adsorption curves of bio-MOF-1 and 2-PAM@bio-MOF-1 were consistent with a Type I adsorption isotherm, indicating that both materials had microporous structures.36 When the P/P0 ratio was low (less than 0.1), the adsorption of N2 onto the two MOFs increased sharply as N2 molecules were adsorbed onto the inner surface of the micropores; when the P/P0 ratio increased further, the adsorption of N2 onto both MOFs plateaued at their saturation levels. The saturation could be attributed to the fact that N2 molecules filled a large volume of the micropores in the materials, heavily restricting further adsorption of N2 molecules. When the P/P0 ratio approached the saturation pressure, N2 molecules condensed within the porous materials resulting in increased adsorption. These phenomena are observed with typical microporous molecules during N2 isothermal adsorption experiments. The BET specific surface area and the pore volume of bio-MOF-1 were measured to be 981.25 m2/g and 0.682 cm3/g, respectively, which were slightly lower than the corresponding values of this material reported elsewhere.32 This discrepancy might have been attributed to the presence of residual molecules with high boiling points in the pores, which led to differences in the desorption temperatures. The specific surface area and the pore volume of 2-PAM@bio-MOF-1 calculated using the BET model were 51.205 m2/g and 0.098 cm3/g, respectively, both of which are significantly lower than those of bio-MOF-1. It was speculated that the lower values were attributed to the presence of 2-PAM within the pores of the material.
As observed in the TGA curve of 2-PAM@bio-MOF-1 in Figure S5, the thermal decomposition of 2-PAM@bio-MOF-1 occurred in four stages over the temperature range of 25–800 °C. In the first stage (100–200 °C), crystal water and dimethylammonium cations were evaporated from the material. In the second stage (200–220 °C), 2-PAM that was adsorbed onto the surface of bio-MOF-1 decomposed. In the third stage (250–400 °C), 21.7% of 2-PAM loaded into the carrier MOF decomposed. The temperature range of decomposition of 2-PAM is basically comparable with the data reported in the literature.37,38 In the fourth and final stage (>400 °C), the bio-MOF-1 framework decomposed, which is consistent with previous reports.19 From the TGA analysis result together with the elemental analysis result, it was determined that the loaded 2-PAM accounted for 21.7 wt % of the 2-PAM@bio-MOF-1.
In Vitro 2-PAM Release from 2-PAM@bio-MOF-1
The release rates of 2-PAM from 15 mg of 2-PAM@bio-MOF-1 were investigated in 1 mL of SBF, simulated gastric fluid, and deionized water, respectively, over a period of 50 h (Figure S2). In SBF, 2-PAM was released rapidly within the first 10 h, with half of 2-PAM being released from bio-MOF-1 within the first 6 h (Figure 3, line a). After 18 h in the SBF, approximately 80% of 2-PAM was released from the MOF. However, after 40 h, the release of the loaded 2-PAM increased negligibly in the SBF, eventually reaching 88.5% after 50 h. In simulated gastric fluid, the release trend is consistent with the SBF. As shown in Figure 3 (line b), 64.3% of 2-PAM was released from bio-MOF-1 into the simulated gastric fluid after 50h. The decrease between the release amount of 2-PAM in SBF and SGF is due to the fact that the amount of cations in SBF is more than that in SGF. These results demonstrated that bio-MOF-1 was capable of a slow and sustained release of 2-PAM over an extended period of time until plateauing at a high release percentage, and the release amount of 2-PAM is really governed by the amount of exogenous cations.
Figure 3.
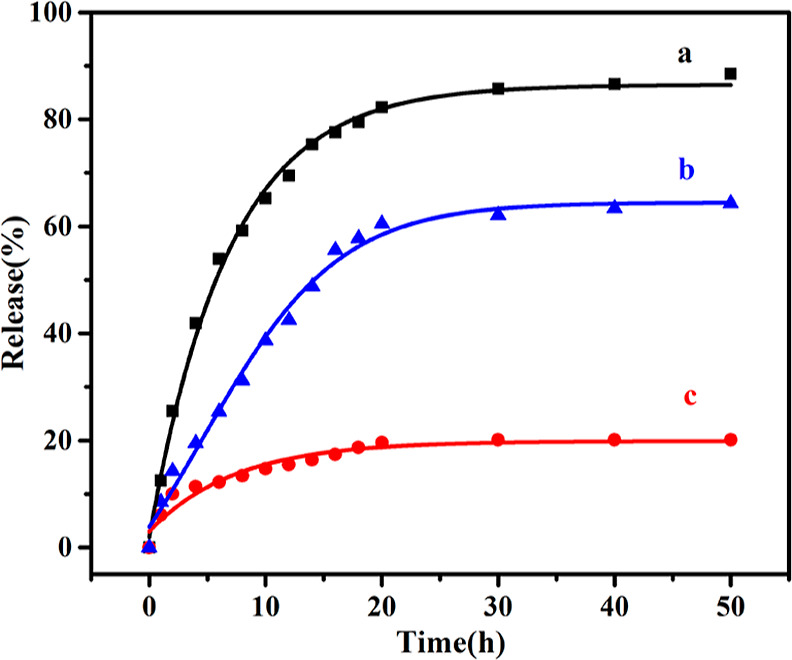
Drug release curves of 2-PAM@bio-MOF-1 (15 mg) in SBF solution [(1 mL of SBF solution, pH = 7.4)] (black curve) (a), simulated gastric fluid [1 mL of simulated gastric fluid (PBS), pH = 1.2] (blue curve) (b), and deionized water (1 mL of deionized water) (red curve) (c) over the period of 50 h at 37 °C.
To verify that cation exchange contributed to the release of the cationic drug, the results in SBF were compared to an analogous experiment conducted in deionized water. As shown in Figure 3 (line c), after 50 h, only 20.1% of 2-PAM was released from bio-MOF-1 into the deionized water, indicating that the release of 2-PAM from the bio-MOF-1 was significantly slower in water compared to in SBF; this result substantiated the effects of cations, like Na+, on the release of 2-PAM (and potentially other cationic molecules) in SBF. Therefore, the cation exchange process played a significant role in drug release in SBF.
Determination of the LD50 of Sarin in Mice by Intragastric Administration
The working sarin solution (0.2 mL of each concentration) was administered to the mice in each group (n = 8) at doses of 700.0, 559.1, 445.5, and 359.1 μg/kg by oral gavage. According to the data listed in Table 2, the LD50 of sarin in mice by intragastric administration was calculated to be 490.9 μg/kg. Therefore, the dose of sarin to be administered by intragastric administration for full rescue treatment with 2-PAM@bio-MOF-1 was calculated as the 1.5 × LD50 to be 736.4 μg/kg.
Table 2. Survival of Mice after Sarin Poisoning by Intragastric Administration.
| sarin dosage (μg/kg) | number of deaths | number of survivals | total number of mice |
|---|---|---|---|
| 700.0 | 6 | 2 | 8 |
| 559.1 | 6 | 2 | 8 |
| 445.5 | 4 | 4 | 8 |
| 359.1 | 1 | 7 | 8 |
Determination of the Dose of 2-PAM-Cl to Enable Full Rescue of Mice Poisoned with 1.5 × LD50 Sarin by Intragastric Administration and the Dosage of 2-PAM@bio-MOF-1 in the Treatment of Mice Poisoned by 1.5×LD50 Sarin
The dose of 2-PAM-Cl needed to fully rescue the mice poisoned with a 1.5 × LD50 sarin (the minimum dosage of 2-PAM-Cl required to not kill any mice in each group) was regarded as the minimum dose of the drug required to overcome the neurotoxic poisoning by sarin. Mice administered a dose of sarin equal to 1.5 × LD50 sarin (736.4 μg/kg) exhibited slow poisoning that became lethal after 20 min. 30 s after poisoning, therapeutic drugs were administered to the mice by oral gavage. As indicated by the data in Table 3, the full rescue dose of 2-PAM-Cl by intragastric treatment was calculated to be 30 mg/kg, while the full rescue dose of 2-PAM@bio-MOF-1 was calculated to be 283.6 mg/kg. Therefore, the dosage of 2-PAM@bio-MOF-1 in the treatment of mice poisoned by 1.5 × LD50 sarin was determined to be 283.6 mg/kg. Subsequently, the reactivation rate of AChE in the mice treated with 283.6 mg/kg 2-PAM@bio-MOF-1 and atropine was evaluated after being poisoned with 1.5 × LD50 sarin.
Table 3. Determination of the Dose of 2-PAM and 2-PAM@bio-MOF-1 to Enable Full Rescue of Mice Poisoned with 1.5 × LD50 Sarin by Intragastric Administration.
| sarin dose (μg/kg) | atropine (mg/kg) | amount of materials used for treatment (mg/kg) | number of deaths within 24 h | number of survivals within 24 h | total number of mice | |
|---|---|---|---|---|---|---|
| exposure group | 736.4 | 0 | 0 | 7 | 1 | 8 |
| 2-PAM-Cl treatment group I | 736.4 | 10 | 15 | 4 | 4 | 8 |
| 2-PAM-Cl treatment group II | 736.4 | 10 | 30 | 0 | 8 | 8 |
| 2-PAM@bio-MOF-1 treatment group I | 736.4 | 10 | 141.8a | 5 | 3 | 8 |
| 2-PAM@bio-MOF-1 treatment group II | 736.4 | 10 | 283.6a | 0 | 8 | 8 |
141.8 mg/kg is equivalent to 30 mg of 2-PAM-1 per kilogram of mice, and 283.6 mg/kg is equivalent to 60 mg of 2-PAM-1 per kilogram of mice.
Determination of the Reactivation Rate of AChE in Mice Treated with 2-PAM@bio-MOF-1 and Atropine after Being Poisoned with 1.5 × LD50 Sarin
The in vivo (mice) AChE activity was measured by UV–vis spectroscopy by monitoring the change in the absorbance of the AChE assay solution, resulting from the production of TNB2– over the course of 28 h. All mice poisoned with 1.5 × LD50 sarin and treated with 283.6 mg/kg 2-PAM@bio-MOF-1 survived. As shown in Figure 4, the reactivation rate of AChE increased rapidly during the first 8 h but decreased from 10 to 19 h, eventually reaching 80.6% after 20 h, when it only negligibly changed. The reactivation rate was the highest (82.5%) after 24 h. Compared to the control group, whose reactivation rate of AChE was only 15.5% after 24 h, the reactivation rate of AChE in the treatment group was significantly higher (82.5%), indicating that 2-PAM@bio-MOF-1 and atropine were capable of effectively treating the mice poisoned with sarin. These results also corroborated the effective release of 2-PAM from 2-PAM@bio-MOF-1 in biologically relevant environments triggered by cations such as Na+.
Figure 4.

Comparison of the AChE activity between the mice poisoned with sarin (exposure group, black line) and the sarin-poisoned mice treated with atropine and 2-PAM@bio-MOF-1 (treatment group, red curve) over the course of 2–28 h. In the exposure group, the sarin dose was 1.1 × LD50; in the treatment group, the sarin dose was 1.5 × LD50, the atropine dose was 10 mg/kg, and the 2-PAM@bio-MOF-1 dose was 283.6 mg/kg.
Elimination of HD by 2-PAM@bio-MOF-1 and the Epidermal Decontamination of HD-Poisoned Guinea Pigs by 2-PAM@bio-MOF-1 and Bio-MOF-1
The elimination of HD by 2-PAM@bio-MOF-1 at different time intervals (1, 2, 3, 4, and 5 h) was investigated by monitoring the change in absorbance of the assay solution at 445 nm. As shown in Figure S6, when 2 μL of HD was reacted with 20 mg of 2-PAM@bio-MOF-1 for 5 h, the elimination rate of HD was 43.7%. This amounted to an elimination of HD by 2-PAM@bio-MOF-1 of 0.27 mmol/g. Due to the extreme toxicity of HD, the simulant CEES was used to replace HD to help determine the elimination products of HD. Known from the fact (Supporting Information, Figure S7), only CEES (the retention time of CEES was 7.46 min) was present after the digestion reaction of CEES by 2-PAM@bio-MOF-1, we concluded that no chemical reaction between HD and 2-PAM@bio-MOF-1 occurred, which might have been attributed to the coordination of Zn2+ by the N1, N3, N7, and N9 atoms of adenine in the bio-MOF-1 framework (Supporting Information, Figure S8). Because N3 normally participates in the alkylation of HD, the involvement of N3 in coordination prevented it from alkylating HD. Since the adenine moieties in bio-MOF-1 were not capable of chemically coordinating HD, it was speculated that the porous structure of 2-PAM@bio-MOF-1 facilitated the adsorption of the HD in solution, but the relatively low adsorption capacity of HD by 2-PAM@bio-MOF-1 might be attributed to the occupation of pores in bio-MOF-1 by 2-PAM molecules.
Due to the ability of bio-MOF-1 and 2-PAM@bio-MOF-1 to adsorb HD, the decontamination performances of these materials on the epidermis of the HD-poisoned guinea pigs were preliminarily evaluated. As shown in Figure 5 (left), significant differences in the extent of erythema of the epidermal tissue between the poisoned and decontaminated groups were observed. One day after exposure, severe erythema and edema were observed on the skin surface of the poisoned group, while obvious erythema and barely visible edema were observed on the skin surface of the decontamination group, indicating that decontamination with the various materials could mitigate erythema and edema caused by HD poisoning. By the third day, erythema was barely visible on the epidermis of the guinea pigs in the decontamination group, suggesting that the three decontamination agents were capable of successfully decontaminating the HD-poisoned skin. The experimental results were based on the skin irritation response scores using the scoring standard [Figure 5 (right)], which indicated that all three decontamination agents demonstrated suitable epidermis decontamination performance without notable differences. In particular, the bio-MOF-1 exhibited the best decontamination effect among the three decontamination agents based on the erythema scores [Figure 5 (right)]. This might have been attributed to the large pore volumes and high specific surface area of bio-MOF-1 for adsorption of the HD droplets. Overall, these results indicated that 2-PAM@bio-MOF-1 could serve as a decontamination agent for HD poisoning and a replacement for materials like activated white clay.
Figure 5.

Left: Comparison of the decontamination efficacy of HD-poisoned guinea pigs using activated white clay, bio-MOF-1, and 2-PAM@bio-MOF-1. The severity of the erythemas within the pre-labeled areas of the epidermis of the guinea pigs were monitored 1, 2, and 3 days after decontamination. From left to right: blank control group (A), poisoned group (B), activated clay group (C), bio-MOF-1 (D), and 2-PAM@bio-MOF-1 (E) group. Right: Skin irritation response scores (based on the extent of erythema) of the HD-poisoned guinea pigs with and without decontamination with activated white clay, bio-MOF-1, or 2-PAM@bio-MOF-1. Experimental conditions: 2 μL of HD; 1 min exposure time; 20 mg dose of activated white clay, bio-MOF-1, or 2-PAM@bio-MOF-1.
Conclusions
In this study, a cation-exchangeable 2-PAM@bio-MOF-1 composite with a drug loading rate 21.2 wt % was prepared by a simple ion exchange reaction between the N,N-dimethylammonium cations present in the pores of the anionic bio-MOF-1 with pralidoxime. The in vitro drug release experiments conducted in SBF, SGF, and H2O proved that the endogenous cations in SBF facilitated the release of 2-PAM from the 2-PAM@bio-MOF-1 composite through cation exchange, which was rapid initially but then slowed as the incubation period progressed. Treatment of mice poisoned with a 1.5 × LD50 dose of sarin with the 2-PAM@bio-MOF-1 composite combined with atropine was very effective for remedying the sarin poisoning and AChE reactivation. The slow and sustained release of 2-PAM from the composite in the later stage of incubation would enable a sustained release of 2-PAM in the blood to avoid tedious and repeated administration of 2-PAM and avoid poisoning from excessive accumulation of the drug after direct, repeated administration. In addition, the composite was also capable of removing HD via adsorption and was effective for the epidermal decontamination of HD-poisoned guinea pigs, demonstrating the ability to detoxify biological tissue and fluid containing HD.
Acknowledgments
The financial support from the Natural Science Foundation of China and kind support from Prof. Xue Duan of Beijing University of Chemical Technology is greatly acknowledged.
Supporting Information Available
The Supporting Information is available free of charge at https://pubs.acs.org/doi/10.1021/acsomega.2c01240.
Standard curve of 2-PAM and HD, characterization of 2-PAM@bio-MOF-1 in UV–vis spectra, N2 adsorption/desorption and TGA, elimination rate of HD by 2-PAM@bio-MOF-1, and GC–MS spectra of the digestion of CEES by 2-PAM@bio-MOF-1 (PDF)
Author Contributions
The manuscript was written through contributions of all authors. All authors have given approval to the final version of the manuscript.
The authors declare no competing financial interest.
Supplementary Material
References
- Munro N. B.; Talmage S. S.; Griffin G. D.; Waters L. C.; Watson A. P.; King J. F.; Hauschild V. The Sources, Fate, and Toxicity of Chemical Warfare Agent Degradation Products. Environ. Health Perspect. 1999, 107, 933–974. 10.1289/ehp.99107933. [DOI] [PMC free article] [PubMed] [Google Scholar]
- Kim K.; Tsay O. G.; Atwood D. A.; Churchill D. G. Destruction and Detection of Chemical Warfare Agents. Chem. Rev. 2011, 111, 5345–5403. 10.1021/cr100193y. [DOI] [PubMed] [Google Scholar]
- Jang Y. J.; Kim K.; Tsay O. G.; Atwood D. A.; Churchill D. G. Update 1 of: Destruction and Detection of Chemical Warfare Agents. Chem. Rev. 2015, 115, PR1–PR76. 10.1021/acs.chemrev.5b00402. [DOI] [PubMed] [Google Scholar]
- Beck J. M.Organophosphorus Nerve Agent Chemistry; Interactions of Chemical Warfare Agents and Their Therapeutics with Acetylcholinesterase. Ph.D. Thesis, The Ohio State University, Columbus, U. S., 2011. [Google Scholar]
- Noshad H.; Ansarin K.; Ardalan M. R.; Ghaffari A. R.; Safa J.; Nezami N. Respiratory Failure in Organophosphate Insecticide Poisoning. Saudi. Med. J. 2007, 28, 405–407. [PubMed] [Google Scholar]
- Yang C.; Deng J. Intermediate Syndrome Following Organophosphate Insecticide Poisoning. J. Chin. Med. Assoc. 2007, 70, 467–472. 10.1016/s1726-4901(08)70043-1. [DOI] [PubMed] [Google Scholar]
- Marques G. L. M.; Siqueira A. A.; Minassa V. S.; Peres M. D.; Pelição F. S.; Sampaio K. N. Method Validation for Simultaneous Determination of Atropine, Pralidoxime and 12 Organophosphorus Compounds in Blood Samples by Means of High-Performance Liquid Chromatography Coupled with Tandem Mass Spectrometry (LC-MS/MS). J. Chromatogr. B: Anal. Technol. Biomed. Life Sci. 2018, 1097–1098, 44–53. 10.1016/j.jchromb.2018.09.006. [DOI] [PubMed] [Google Scholar]
- Grob D.; Harvey A. M. The Effects and Treatment of Nerve Gas Poisoning. Am. J. Med. 1953, 14, 52–63. 10.1016/0002-9343(53)90358-1. [DOI] [PubMed] [Google Scholar]
- Eddleston M.; Szinicz L.; Eyer P.; Buckley N. Oximes in Acute Organophosphate Pesticide Poisoning: a Systematic Review of Clinical Trials. QJM: Mly. J. Assoc. Phy. 2002, 95, 275–283. 10.1093/qjmed/95.5.275. [DOI] [PMC free article] [PubMed] [Google Scholar]
- Franz D. R.Chapter 30: Defense Against Toxin Weapons. In Medical Aspects of Chemical and Biological Warfare, Sidell F. R., Ed. 1996; pp 603-619. [Google Scholar]
- Lotti M.; Becker C. E. Treatment of Acute Organophosphate Poisoning: Evidence of a Direct Effect on Central Nervous System by 2-PAM (Pyridine-2-Aldoxime Methyl Chloride). J. Toxicol., Clin. Toxicol. 1982, 19, 121–127. 10.3109/15563658208990374. [DOI] [PubMed] [Google Scholar]
- Papich M. G.Pralidoxime Chloride. In Saunders Handbook of Veterinary Drugs, 4th ed.; 2016; pp 662-663. 10.1016/b978-0-323-24485-5.00474-5 [DOI] [Google Scholar]
- Pawar K. S.; Bhoite R. R.; Pillay C. P.; Chavan S. C.; Malshikare D. S.; Garad S. G. Continuous Pralidoxime Infusion Versus Repeated Bolus Injection to Treat Organophosphorus Pesticide Poisoning: a Randomised Controlled Trial. Lancet 2006, 368, 2136–2141. 10.1016/s0140-6736(06)69862-0. [DOI] [PubMed] [Google Scholar]
- Eyer P.; Buckley N. Pralidoxime for Organophosphate Poisoning. Lancet 2006, 368, 2110–2111. 10.1016/s0140-6736(06)69843-7. [DOI] [PMC free article] [PubMed] [Google Scholar]
- Nouar F.; Eubank J. F.; Bousquet T.; Wojtas L.; Zaworotko M. J.; Eddaoudi M. Supermolecular Building Blocks (SBBs) for the Design and Synthesis of Highly Porous Metal-Organic Frameworks. J. Am. Chem. Soc. 2008, 130, 1833–1835. 10.1021/ja710123s. [DOI] [PubMed] [Google Scholar]
- Férey G. Hybrid Porous Solids: Past, Present, Future. Chem. Soc. Rev. 2008, 37, 191–214. [DOI] [PubMed] [Google Scholar]
- Rowsell J. L. C.; Yaghi O. M. Strategies for Hydrogen Storage in Metal-Organic Frameworks. Angew. Chem., Int. Ed. 2005, 44, 4670–4679. 10.1002/anie.200462786. [DOI] [PubMed] [Google Scholar]
- Huxford R. C.; Della Rocca J. D.; Lin W. Metal-Organic Frameworks as Potential Drug Carriers. Curr. Opin. Chem. Biol. 2010, 14, 262–268. 10.1016/j.cbpa.2009.12.012. [DOI] [PMC free article] [PubMed] [Google Scholar]
- An J.; Geib S. J.; Rosi N. L. Cation-Triggered Drug Release from a Porous Zinc-Adeninate Metal-Organic Framework. J. Am. Chem. Soc. 2009, 131, 8376–8377. 10.1021/ja902972w. [DOI] [PubMed] [Google Scholar]
- Devic T.; Horcajada P.; Serre C.; Salles F.; Maurin G.; Moulin B.; Heurtaux D.; Clet G.; Vimont A.; Grenèche J.-M.; Ouay B. L.; Moreau F.; Magnier E.; Filinchuk Y.; Marrot J.; Lavalley J.-C.; Daturi M.; Férey G. Functionalization in Flexible Porous Solids: Effects on the Pore Opening and the Host-Guest Interactions. J. Am. Chem. Soc. 2010, 132, 1127–1136. 10.1021/ja9092715. [DOI] [PubMed] [Google Scholar]
- Arabipour I.; Amani J.; Mirhosseini S. A.; Salimian J. The Study of Genes and Signal Transduction Pathways Involved in Mustard Lung Injury: A Gene Therapy Approach. Gene 2019, 714, 143968–143983. 10.1016/j.gene.2019.143968. [DOI] [PubMed] [Google Scholar]
- Kokubo T.; Takadama H. How Useful Is SBF in Predicting in Vivo Bone Bioactivity?. Biomaterials 2006, 27, 2907–2915. 10.1016/j.biomaterials.2006.01.017. [DOI] [PubMed] [Google Scholar]
- Zorbaz T.; Mišetić P.; Probst N.; Žunec S.; Zandona A.; Mendaš G.; Micek V.; Maček Hrvat N. M.; Katalinić M.; Braïki A.; Jean L.; Renard P.-Y.; Gabelica Marković V. G.; Kovarik Z. Pharmacokinetic Evaluation of Brain Penetrating Morpholine-3-Hydroxy-2-Pyridine Oxime as an Antidote for Nerve Agent Poisoning. ACS Chem. Neurosci. 2020, 11, 1072–1084. 10.1021/acschemneuro.0c00032. [DOI] [PubMed] [Google Scholar]
- Kalisiak J.; Ralph E. C.; Cashman J. R. Nonquaternary Reactivators for Organophosphate-Inhibited Cholinesterases. J. Med. Chem. 2012, 55, 465–474. 10.1021/jm201364d. [DOI] [PubMed] [Google Scholar]
- Ellman G. L.; Courtney K. D.; Andres V.; Featherstone R. M. A New and Rapid Colorimetric Determination of Acetylcholinesterase Activity. Biochem. Pharmacol. 1961, 7, 88–95. 10.1016/0006-2952(61)90145-9. [DOI] [PubMed] [Google Scholar]
- Zhong Y.Studies on the Enhanced Reactivation of Soman Inhibited Acetylcholinesterase by Tertiary Ammonium Compounds and That of the Mechanism. Ph.D. Thesis, Chinese Academy of Military Medical Sciences, Beijing, 2000. [Google Scholar]
- Yang J.; Fan L.; Wang F.; Luo Y.; Sui X.; Li W.; Zhang X.; Wang Y. Rapid-Releasing of HI-6 Via Brain-Targeted Mesoporous Silica Nanoparticles for Nerve Agent Detoxification. Nanoscale 2016, 8, 9537–9547. 10.1039/c5nr06658a. [DOI] [PubMed] [Google Scholar]
- Zhou Y.; Gao Q.; Zhang L.; Zhou Y.; Zhong Y.; Yu J.; Liu J.; Huang C.; Wang Y. Combining Two into One: A Dual-Function H5PV2Mo10O40@MOF-808 Composite as a Versatile Decontaminant for Sulfur Mustard and Soman. Inorg. Chem. 2020, 59, 11595–11605. 10.1021/acs.inorgchem.0c01392. [DOI] [PubMed] [Google Scholar]
- Yu J.; Gao Q.; Zhang L.; Zhou Y.; Zhong Y.; Yin J.; Zhou Y.; Tao F.; Wang Y. A Dual-Function All-Inorganic Intercluster Salt Comprising the Polycation ε-[Al13O4(OH)24(H2O)12]7+ and Polyanion α-[PMo10V2O40]5- for Detoxifying Sulfur Mustard and Soman. Dalton Trans. 2020, 49, 8122–8135. 10.1039/d0dt01307b. [DOI] [PubMed] [Google Scholar]
- Yi X.; Wen H.; Wu J.; Sun J.; Fan W.; Zhu M. Preparation of rhEGF Film and Their Efficacy in Treating Piglet Skin Sulfur Mustard Intoxication Model. Bull. Acad. Mil. Med. Sci. 2004, 28, 456–460. [Google Scholar]
- National Medical Products Administration . Technical Guidelines for Irritation, Allergy and Hemolysis Studies of Chemical Drug (in Chinese); [H]GPT4-1; China, 2005.
- Jonckheere D.; Coutino-Gonzalez E.; Baekelant W.; Bueken B.; Reinsch H.; Stassen I.; Fenwick O.; Richard F.; Samorì P.; Ameloot R.; Hofkens J.; Roeffaers M. B. J.; De Vos D. E. D. Silver-Induced Reconstruction of an Adeninate-Based Metal-Organic Framework for Encapsulation of Luminescent Adenine-Stabilized Silver Clusters. J. Mater. Chem. C 2016, 4, 4259–4268. 10.1039/c6tc00260a. [DOI] [PMC free article] [PubMed] [Google Scholar]
- Armando R. A. M.; Abuçafy M. P.; Graminha A. E.; Silva R. S. D.; Frema R. C. G. Ru-90@bio-MOF-1: A Ruthenium(II) Metallodrug Occluded in Porous Zn-based MOF as a Strategy to Develop Anticancer Agents. J. Solid State Chem. 2021, 297, 122081–122088. 10.1016/j.jssc.2021.122081. [DOI] [Google Scholar]
- Grošev V. M.; Foretić B.; Gamulin O. Vibrational Analysis of 1-Methyl-Pyridinium-2-Aldoxime and 1-Methyl-Pyridinium-4-Aldoxime Cations. Spectrochim. Acta, Part A 2011, 78, 1376–1379. 10.1016/j.saa.2011.01.012. [DOI] [PubMed] [Google Scholar]
- Oh H.; Li T.; An J. Drug Release Properties of a Series of Adenine-Based Metal-Organic Frameworks. Chem. - Eur. J. 2015, 21, 17010–17015. 10.1002/chem.201501560. [DOI] [PubMed] [Google Scholar]
- An J.; Shade C. M.; Chengelis-Czegan D. A.; Petoud S.; Rosi N. L. Zinc-Adeninate Metal-Organic Framework for Aqueous Encapsulation and Sensitization of Near-infrared and Visible Emitting Lanthanide Cations. J. Am. Chem. Soc. 2011, 133, 1220–1223. 10.1021/ja109103t. [DOI] [PubMed] [Google Scholar]
- Vilela S. M. F.; Salcedo-Abraira P.; Colinet I.; Salles F.; de Koning M. C.; Joosen M. J. A.; Serre C.; Horcajada P. Nanometric MIL-125-NH2 Metal–Organic Framework as a Potential Nerve Agent Antidote Carrier. Nanomaterials 2017, 7, 321–335. 10.3390/nano7100321. [DOI] [PMC free article] [PubMed] [Google Scholar]
- Zhao D.; Liu J.; Zhang L.; Zhou Y.; Zhong Y.; Yang Y.; Huang C.; Wang Y. Loading and Sustained Release of Pralidoxime Chloride from Swellable MIL-88B(Fe) and Its Therapeutic Performance on Mice Poisoned by Neurotoxic Agents. Inorg. Chem. 2022, 61, 1512–1520. 10.1021/acs.inorgchem.1c03227. [DOI] [PubMed] [Google Scholar]
Associated Data
This section collects any data citations, data availability statements, or supplementary materials included in this article.