

Abstract

Ceramic architectures based on chemical vapor deposition (CVD) are used to create unique crystal structures, morphologies, and properties. This study proposed room-temperature THz gas sensing using terahertz time-domain spectroscopy (THz-TDS) with ceramic architectures. We synthesized ceramic films on porous glass. Zinc oxide films were created using atmospheric CVD and amorphous carbon nitride films using the dissociative excitation reaction of BrCN with metastable Ar atoms. The transmission method was used in THz-TDS. A stainless hand-made gas cell with a Si window was applied for THz gas sensing. We defined “phase delay” equals VOC sensing response amount of sensing materials at each duration. Ppm-order THz gas sensing was performed.
Introduction
The noninvasive detection of illnesses through human breath analysis is an emerging field of medical diagnostics, and it is a rapid, economical, and simple alternative to standard blood analysis and endoscopy. The detection of cancer at an early stage is important for its successful treatment. Tumor cells generate unique cancer volatile organic compound (VOC) profiles, which can reflect disease conditions. The detection and analysis of VOC biomarkers from exhaled breath has been recognized as a new frontier in cancer diagnostics.1 Various gas sensing techniques have been developed for VOCs, for example, semiconductor gas sensors, gas chromatography–mass spectrometry (GC–MS), infrared (IR) spectroscopy, and terahertz time-domain spectroscopy (THz-TDS).
The principle of semiconductor gas sensors is the chemiresistive property change in the conductivity associated with the adsorption and desorption of gas molecules on a metal oxide surface. In other words, the gas molecules that interact with metal oxides act as the donors or acceptors of charge carriers and alter the resistivity of metal oxides. The increase or decrease in the resistance of a metal oxide thin film depends on the type of majority carriers in the film and the nature of gas molecules (oxidizing or reducing) in an ambient atmosphere. The ambient atmosphere is typically classified as dry or wet on the basis of the humidity level. Water molecules strongly influence receptor functions in a wet atmosphere, whereas oxygen plays a key role in a dry atmosphere. The dense water molecules and high electronegativity of oxygen makes them easy to be adsorbed as electron acceptors on a metal oxide surface. Therefore, the response of a metal oxide surface strongly depends on the composition of the atmosphere, particularly water and oxygen, which define the baseline for sensor response and calibration.2 The GC–MS technique involves the sieve sorting of ingredients to separate, identify, and quantify constituents.3,4 This method is time-consuming and expensive, particularly when used for routine analysis. IR techniques combined with sensor test measurements are used to understand interaction mechanisms at the molecular level. These techniques can only be applied in the mid-IR wavelength region (2.5–25 μm) because numerous molecules exhibit unique vibrational transitions in this “fingerprint” region. Fourier transform IR (FT-IR) spectrometry is widely applied in this wavelength region to identify molecular gases.5 Mid-IR laser sources associated with the strong fundamental rovibrational molecular transitions observed in this region have been used for the highly sensitive detection of these molecules. However, FT-IR spectrometry cannot realize selectivity in gas sensing. Absorption spectroscopy in the terahertz (THz) or submillimeter frequency band, that is, 0.1–10 THz (3.33–333.3 cm–1), allows for the selective nonintrusive identification of polar gas molecules, including numerous VOCs, using molecular rotations and low-energy internal torsional modes with resonant external electromagnetic fields.
In THz-TDS, the properties of matter are examined using short pulses of THz radiation. Generation and detection schemes are sensitive to the effect of a sample on the amplitude and phase of THz radiation. THz-TDS uses the time domain to provide more information compared to conventional Fourier transform spectroscopy, which is only sensitive to the amplitude. An ultrashort pulse laser beam (10–15 s order) is used to convert impulse responses in THz-TDS profiles to the optical constants (the dielectric constant and refractive index) of matter. Therefore, THz-TDS can theoretically be an actual state of matter.6 However, the wavenumber decomposition energy of this method (resolution) is of the order of MHz because of the Doppler width and pressure width in THz regions. In the 1–3 THz frequency region, the vibration of intermolecular force prevents the precise measurement of spectra. The appropriate temperature and pressure must be determined because they change the nature of matter and the signals/noises of THz spectra. Hence, it is difficult to perform THz gas sensing. In this study, we introduce the “cage” effect7 and “surface modification” effect8 using ceramic materials in a THz-TDS system. The cage effect is based on the Knudsen effect that occurs in porous materials, and the surface modification effect is based on the linear solvation energy relationship theory (LSERs).9,10 The LSERs is applied to understand the types and relative strength of the chemical interactions that control retention and selectivity in the various modes of chromatography ranging from GC to reversed-phase and micellar electrokinetic capillary chromatography. In addition, the simulation of the Knudsen effect results shows that when the average pore size d < 1 μm, the effective diffusion coefficient is strongly dependent on the pore size. In addition, the simulations also show that the percolation threshold in random porous materials decreases with increased pore network connectivity. We prepare ceramic films on a commercial porous glass substrate with a pore diameter of 50 nm using chemical vapor deposition (CVD) techniques.
First, we deposited zinc oxide (ZnO) whiskers with THz wave transparency as sensor materials on commercial porous glass (AKAGAWA glass, pore diameter: 50 nm) through atmospheric CVD. We prepared five types of sensor materials. In Samples 1 and 2, ZnO whiskers were deposited on the porous glass with different durations. In Sample 3, amorphous carbon nitride (a-CN) was deposited on the porous glass. In sample 4, an a-CN layer was laminated on sample 1 to change the termination structure of the ZnO whiskers. Sample 5 was the porous glass without any layer. The thickness of ZnO films was 500 nm for Sample 1 and 2 μm for Sample 2. In this study, the thickness of the film a-CN film was approximately 100 nm. The sensor material was introduced in the THz-TDS system. THz-TDS spectra were obtained for the VOC gas flow duration and converted to phase delays using the fast Fourier transform. We defined “phase delay” equals VOC sensing response amount of sensing materials at each duration. Atmospheric CVD is a thermal CVD technique used in the design of microarchitectures (metal oxide crystallites) and epitaxy and nonepitaxy processes with high growth rates. It is low cost and does not require a vacuum system.11 The porous glass was prepared. Next, the reactant, bis(dipivaloylmethanato)zinc (Zn(DPM)2, KOJUNDO CHEMICAL LABORATORY CO., LTD) was loaded into a vaporizer and vaporized using an electric heater. The reactant vapor was first carried by nitrogen gas flowing at a rate of 1.5 L/min, then sprayed from a metallic nozzle directly onto substrates mounted on an electric heater. The distance from the nozzle to the substrate was maintained at 25 mm. Other experimental parameters were defined as discussed below. The temperature inside the vaporizer was measured using a K-type thermocouple and is denoted as vaporizing temperature (Tv). In addition, the surface temperature was measured using a K-type thermocouple and is denoted as substrate temperature (Ts). The deposition duration was 1 or 4 h. The substrate was heated using an electric heater placed behind it. The substrate temperature was maintained at 550 °C. The a-CN layers were synthesized using the dissociative excitation reaction of BrCN with metastable Ar atoms.12
Results and Discussion
Figure 1 shows the schematic of the THz-TDS system (Tera Evluator, Nippo Precison Co., Ltd.). The THz pulse was generated using a femtosecond laser with a pulse duration below 100 fs and a laser power above 20 mW, along with a biased photoconductive antenna fabricated on a low-temperature-grown GaAs thin film. The pulse generated by the radiation antenna was reflected from the sample surface and focused by a detection antenna triggered by delayed laser pulses. The time-domain electric field waveform of the reflected THz pulse was measured by changing the time delay of the trigger pulse. The waveform was used to obtain the spectral amplitude ratio and phase difference using the Fourier transform. Then, a hand-made cell with a THz wave transparent Si window was introduced in the sample space of the THz-TDS system.
Figure 1.

Schematic of the THz-TDS system (Tera Evluator, Nippo Precison Co., Ltd.).
For the gas sensing experiment, the microporous structure was enclosed in a stainless-steel sample chamber with a total volume of approximately 8.12 mL. A VOC cylinder connected to a flowmeter with a flow speed of 2 L/min was connected to the outlet port of the chamber to investigate the response. A commercial VOC gas mixture (Auto Indoor Air Pollutant Monitoring VOC Standard Gases, TERRA, Takachiho Chemical Industrial Co., Ltd.) was injected into the sensor and collected in a water bath. The mixture contains 13 VOC gases with 1 ppm per each. First, we obtained the time waveform spectra at various VOC injection times. Next, we obtained the phase difference spectra and used them to determine the “phase delay” spectra, which were standardized by the phase difference spectra obtained without VOCs.
We investigated the THz transparency of Samples 1, 2, and 4. Figure 2 shows the THz transmittance spectra of these samples. The electric field of THz pulses transmitted through the samples and reference were recorded in the time domain, and the corresponding frequency spectra were obtained using the numerical Fourier transform. Owing to the limited thickness of the ZnO films, the main THz pulse transmitted through the samples was trailed by multiple-reflected pulses in the time domain. However, the clear separation between the main pulse and first internal reflection enabled us to perform the data analysis of only the main pulse. Every pulse curve was taken as the average of seven individual measurements to increase the signal-to-noise ratio.
Figure 2.

THz transmittance spectra of Samples 1, 2, and 4 obtained using the THz-TDS system (a) at 14-20 ps and (b) at 16.6–17.2 ps (enlarged view).
THz pulse shifts depend on the film thickness. A previous study examined the thickness dependence using a THz-TDS system. The resolution and implications of the sample thickness measurement were discussed.13 The highest resolution thickness measurements were obtained for ∼500 μm silicon wafers. Therefore, we focused on the demonstration of the film’s thickness effect of THz transparency for VOC sensing. The film’s thickness effect on the THz transparency is cleared in micron-ordered film and not nanometer-ordered film because of thin film’s interference on the complex refractive index. Any deviation of more than ∼0.17% in the sample thickness introduced measurable changes in THz-TDS measurements. In this study, the THz pulse signal was shifted by increasing the deposition duration. In addition, the shift values differed depending on the film type.
Next, we investigated the photoemission yield of the films for VOC gas sensing. We expected the information of the work function to be of importance to the development of electronic or optoelectronic applications. The work function is essentially the Fermi level referenced to the vacuum level. It can be thought of as the ionization potential minus the Fermi level. The work function is not a material constant but rather can be modified through (1) carrier-doping (raises the Fermi level, thereby lowering the work function for a fixed ionization potential) and (2) modification of the surface dipole (can increase the ionization potential and therefore the work function for a fixed Fermi level), or a combination of these two methods. The given definitions of ionization potential and electron affinity provide a doping-independent measure of the surface dipole. Therefore, the work function values would be related to its electron affinity. In this study, we demonstrate work function effects on VOC gas sensing briefly. Angle-resolved UV photoelectron spectroscopy is used to investigate the electric structure and bonding of adsorbed hydrocarbons, the orientation and symmetry of an adsorbate on a surface, lateral interactions, and the formation of two-dimensional adsorbate band structures.14 In this study, photoemission yield spectroscopy was performed for the samples in air. Figure 3 shows the photoemission spectra of Samples 1 and 3. The threshold energy values and slopes in the spectra varied depending on the structure. The threshold energy was 5.5 eV for Sample 1 and 5.3 eV for Sample 3. An atmospheric photoelectron yield spectrometer is a surface analysis system that incorporates a special counting tube (open counter) to count the photoelectrons that are emitted when a surface is irradiated with UV light under atmospheric conditions. White UV light (mixture of photons with different energies) emitted from a light source is spectrally diffracted using a spectrometer so that gray UV light (only photons with uniform energy) is incident on a sample. The spectrometer is controlled to increase the photon energy. Photoemission occurs when the photon energy exceeds the work function of a sample. The emitted photoelectrons are counted by the open counter. The horizontal and vertical axes represent the energy of the incident UV photoelectrons (incident UV energy) and photoelectron yield (photoelectron count per second), respectively. This graph typically becomes parabolic. Hence, the vertical axis is set as the square root of the photoelectron yield to obtain a linear graph. This makes it easier to calculate the threshold energy and slope at which photoemission starts. The threshold energy corresponds to the energy required to remove one electron from the sample surface, and it can be interpreted as the work function or ionization potential. The slope is an indicator of photoemission. Hydrogen termination of the amorphous phase of carbon nitride consists of sp3 and sp2 hybridized materials that might be effective for reducing the work function.15 Hetero-termination generates a localized charge, resulting in the formation of a dipole moment. The termination formed by the methyl group for an instance distributes the electric charge of δ+ for hydrogen and δ– for carbon because of the difference in the electronegativities of these elements. The Pauling electronegativities of carbon and hydrogen are 2.5 and 2.1, respectively. The nitril group termination contains in a-CNx film, in which δ+ and δ– are distributed on carbon and nitrogen because of the low electronegativity of carbon, therefore leading to an increase in the work function because upward bending occurs. Thus, we prepared films on porous glasses with different work function values.
Figure 3.

Photoemission spectra of Samples 1 and 3. Approximate threshold energies are indicated in the spectra.(a) Sample 1 and (b) Sample 3.
Figure 4 shows the results of VOC gas sensing using THz-TDS with the ceramic architecture. VOC gas sensing was confirmed in Samples 2–5. The phase delays increased with the VOC gas flow duration. In contrast, the phase delay did not increase in Sample 5. Figure 5 shows the frequency dependence of VOC gas sensing for Samples 2–5. The obtained phase delay behaviors would be dependent on the sensor materials. We defined “phase delay” equals VOC sensing response amount of sensing materials at each duration. As technical terms, “phase delay” differs with phase difference. The phase difference means thickness interference with multiple interferences. However, the sensing materials treat as bulk based on THz-TDS. Therefore, we used “phase delay”. The phase delay evidently changed depending on the ceramic architecture because of the VOC gas adsorption process of each architecture. All carbon nitride films with hydroxyl, secondary amino, ethylene, and methyl groups exhibited relatively low work functions. Rutter and Robertson calculated the electron affinity of various terminations of the diamond surface using the ab initio pseudopotential method. A clear negative electron affinity was obtained for monohydride (111) and monohydride and dihydride (100) surfaces. The methyl group resulted in the formation of positive charge on the surface. This induced a downward surface bending of 0.3 eV.11,16
Figure 4.
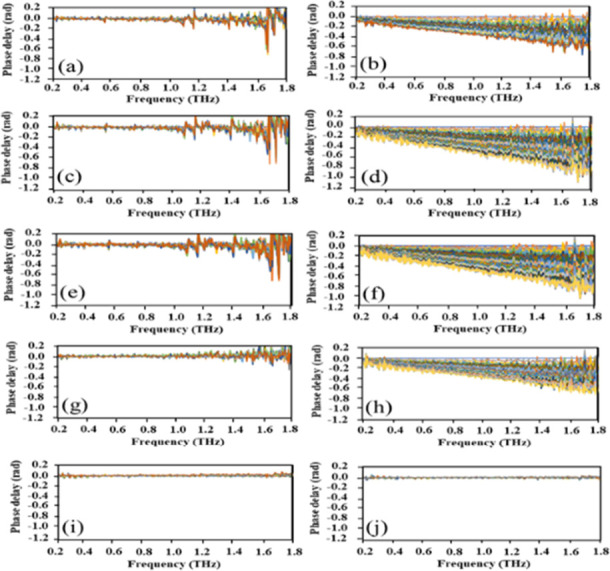
Phase delay of samples obtained using THz-TDS. (a, b) Sample 5, (c, d) Sample 2, (e, f) Sample 3, (g, h) Sample 4, and (i, j) blank (without samples). (a, c, e, g, i) Without VOC mixture gas and (b, d, f, h, j) with VOC mixture gas.
Figure 5.

Frequency dependence of VOC gas sensing using THz-TDS for Samples 2–5.
We performed gas sensing for a commercial VOC mixture with ppm-order concentrations using THz-TDS with ceramic architectures. Selective VOC gas sensing was achieved by controlling the architecture. First, a VOC was adsorbed on the porous glass because of the “cage” effect. Second, each VOC was separated owing to the “surface modification” effect. The phase delays of the architectures were different because of the adsorption processes of the sensor materials with the VOC gas mixture.
Acknowledgments
This work was supported by the CASIO SCIENCE PROMOTION FOUNDATION. In addition, we thank Dr. Nakajima (RIKEN KEIKI Co., Ltd.) for assistance in performing photoemission yield spectroscopy in air.
Author Contributions
Sample preparations and characterizations were performed by K.K. The obtained results were discussed with T.I., H.I., and H.S. All authors approved the final version of the manuscript.
The authors declare no competing financial interest.
References
- Sun X.; Shao K.; Wang T. Detection of volatile organic compounds (VOCs) from exhaled breath as noninvasive methods for cancer diagnosis. Anal. Bioanal. Chem. 2016, 408, 2759–2780. 10.1007/s00216-015-9200-6. [DOI] [PubMed] [Google Scholar]
- Kumar R.; Al-Dossary O.; Kumar G.; Umar A. Zinc Oxide Nanostructures for NO2 Gas–Sensor Applications: A Review. Nanomicro Lett. 2015, 7, 97–120. 10.1007/s40820-014-0023-3. [DOI] [PMC free article] [PubMed] [Google Scholar]
- Ge D.; Zhou J.; Chu Y.; Lu Y.; Zou X.; Xia L.; Liu Y.; Huang C.; Shen C.; Zhang L.; Wang H.; Chu Y. Distinguish oral-source VOCs and control their potential impact on breath biomarkers. Anal. Bioanal. Chem. 2022, 414, 2275–2284. 10.1007/s00216-021-03866-8. [DOI] [PubMed] [Google Scholar]
- Li R.; Xu A.; Zhao Y.; Chang H.; Li X.; Lin G. Genetic algorithm (GA) - Artificial neural network (ANN) modeling for the emission rates of toxic volatile organic compounds (VOCs) emitted from landfill working surface. J. Environ. Manage. 2022, 305, 114433 10.1016/j.jenvman.2022.114433. [DOI] [PubMed] [Google Scholar]
- Smith R. M.; Arnold M. A. Selectivity of Terahertz Gas-Phase Spectroscopy. Anal. Chem. 2015, 87, 10679–10683. 10.1021/acs.analchem.5b03028. [DOI] [PubMed] [Google Scholar]
- Galstyan V.; D’Arco A.; Fabrizio M. D.; Poli N.; Lupi S.; Comini E. Detection of volatile organic compounds: From chemical gas sensors to terahertz spectroscopy. Rev. Anal. Chem. 2021, 40, 33–57. 10.1515/revac-2021-0127. [DOI] [Google Scholar]
- Komatsu K.; Ishibashi Y.; Li K.; Zhu J.; Toda I.; Ohshio S.; Tsuda Y.; Saitoh H. Adsorption and separation behaviors of CO2 and CH4 gases on nanoporous carbon fabricated from rice husk. Trans. Mater. Res. Soc. Japan 2019, 44, 157–163. 10.14723/tmrsj.44.157. [DOI] [Google Scholar]
- Komatsu K.; Tanabe M.; Toda I.; Ohshio S.; Muramatsu H.; Saitoh H. Synthesis of Strontium Oxide Whiskers with Preferential Orientation by Atmospheric Chemical Vapor Deposition. J. Mater. Sci. Res. 2016, 5, 50–55. 10.5539/jmsr.v5n2p44. [DOI] [Google Scholar]
- Mu D.; Liu Z.-S.; Huang C.; Djilali N. Determination of the effective diffusion coefficient in porous media including Knudsen effects. Microfluid. Nanofluid. 2008, 4, 257–260. 10.1007/s10404-007-0182-3. [DOI] [Google Scholar]
- Sugimoto I.; Mitsui K.; Nakamura M.; Seyama M. Effects of surface water on gas sorption capacities of gravimetric sensing layers analyzed by molecular descriptors of organic adsorbates. Anal. Bioanal. Chem. 2011, 399, 1891–1899. 10.1007/s00216-010-4556-0. [DOI] [PubMed] [Google Scholar]
- Saitoh H.; Akasaka H.; Washio T.; Ohkawara Y.; Ohshio S.; Ito H. Work Function of Amorphous Carbon Nitride with Various Functional Groups. Jpn. J. Appl. Phys. 2002, 41, 6169–6173. 10.1143/JJAP.41.6169. [DOI] [Google Scholar]
- Tanaka A. D.; Ohkawara Y.; Itoh N.; Ohshio S.; Ito H.; Saitoh H. Hardness and Structure of a-CNx Films Synthesized by Chemical Vapor Deposition. Jpn. J. Appl. Phys. 2000, 39, 4148–4152. 10.1143/JJAP.39.4148. [DOI] [Google Scholar]
- Jen C.-Y.; Richter C. Sample Thickness Measurement with THz-TDS: Resolution and Implications. J. Infrared Millim. Terahertz Waves 2014, 35, 840–859. 10.1007/s10762-014-0093-9. [DOI] [Google Scholar]
- Steinruck H.-P. Angle-resolved photoemission studies of adsorbed hydrocarbons. J. Phys. Condens. Matter 1996, 8, 6465–6509. 10.1088/0953-8984/8/36/003. [DOI] [Google Scholar]
- Ohkawara Y.; Ohshio S.; Suzuki T.; Ito H.; Yatsui K.; Saitoh H. Quantitative Analysis of Hydrogen in Amorphous Films of Hydrogenated Carbon Nitride. Jpn. J. Appl. Phys. 2001, 40, 7007–7012. 10.1143/JJAP.40.7007. [DOI] [Google Scholar]
- Rutter M. J.; Robertson J. Ab initio calculation of electron affinities of diamond surfaces. Phys. Rev. B 1998, 57, 9241–9245. 10.1103/PhysRevB.57.9241. [DOI] [Google Scholar]