

Abstract
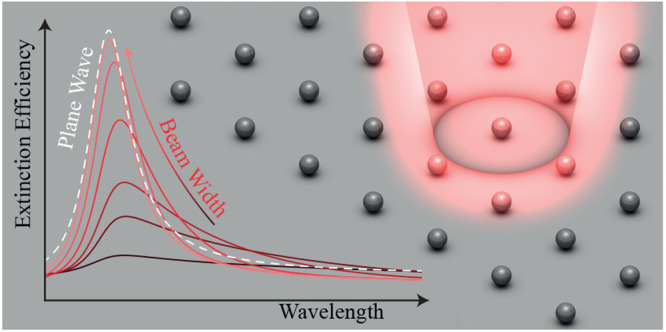
Periodic arrays of metallic nanostructures support collective lattice resonances, which give rise to optical responses that are, at the same time, stronger and more spectrally narrow than those of the localized plasmons of the individual nanostructures. Despite the extensive research effort devoted to investigating the optical properties of lattice resonances, the majority of theoretical studies have analyzed them under plane-wave excitation conditions. Such analysis not only constitutes an approximation to realistic experimental conditions, which require the use of finite-width light beams, but also misses a rich variety of interesting behaviors. Here, we provide a comprehensive study of the response of periodic arrays of metallic nanostructures when excited by finite-width light beams under both paraxial and nonparaxial conditions. We show how as the width of the light beam increases, the response of the array becomes more collective and converges to the plane-wave limit. Furthermore, we analyze the spatial extent of the lattice resonance and identify the optimum values of the light beam width to achieve the strongest optical responses. We also investigate the impact that the combination of finite-size effects in the array and the finite width of the light beam has on the response of the system. Our results provide a solid theoretical framework to understand the excitation of lattice resonances by finite-width light beams and uncover a set of behaviors that do not take place under plane-wave excitation.
Nanostructures made of metallic materials are well known to support localized plasmons.1 These excitations interact strongly with light, producing large absorption and scattering cross sections2 and near-field enhancements,3 which are being exploited in applications ranging from improved solar energy harvesting4 and photocatalysis5 to optical sensing6 and photothermal cancer therapies.7 However, the combination of large radiative cross sections and the inherent nonradiative losses of metallic materials usually results in the localized plasmons of individual nanostructures displaying relatively broad lineshapes with quality factors in the range of Q ≲ 10–20.8−10
A very promising approach to increase the quality factor and, at the same time, obtain stronger optical responses is to arrange identical metallic nanostructures into a periodic array. By doing so, it is possible to exploit the periodicity of the system to obtain collective modes commonly known as lattice resonances.9,11−23 These excitations, which arise from the coherent multiple scattering between the localized plasmons supported by the individual nanostructures, appear in the spectrum at wavelengths commensurate with the periodicity of the array9,20,23,24 and, due to their collective character, produce strong optical responses25−27 with very narrow lineshapes,9,20,23,28,29 leading to record quality factors for systems involving metallic materials.29−38 Thanks to these exceptional properties, the lattice resonances of arrays of metallic nanostructures are the subject of an extensive research effort with a focus on developing novel applications, such as ultrasensitive biosensors,39−42 different optical elements including lenses,43 color filters,44−46 nonlinear47−50 and light-emitting devices,51−62 as well as platforms to enhance long-range energy propagation63−67 or exploring new physical phenomena.68−71
However, despite the substantial research effort, the majority of the theoretical studies performed to date have focused on the analysis of the properties of lattice resonances when excited under plane-wave illumination conditions.9,13,20,21,23 A plane wave is an electromagnetic field with constant amplitude in any plane perpendicular to its propagation direction and, by definition, has an infinite spatial extension.72 Therefore, a plane wave represents an ideal limit of the electromagnetic field of a collimated light beam and, consequently, constitutes an approximation to any experimental conditions in which the electromagnetic field exciting the array always has a finite extension.73 It is therefore crucial to understand the conditions under which this approximation is accurate as well as what new behaviors can be obtained when the lattice resonances of periodic arrays of metallic nanostructures are excited by light beams of finite width.
In this article, we provide a detailed theoretical investigation of the optical response of periodic arrays of metallic nanostructures under excitation by finite-width light beams. Specifically, we implement a semianalytical approach based on the combination of the coupled dipole model13,21,24,29,74−76 and the angular spectrum representation of a light beam,73 which allows us to describe the excitation of the array by arbitrary light beams under both paraxial and nonparaxial conditions. We show that the optical response associated with the lattice resonance of the array is strongly dependent on the width of the light beam, and, as it increases, the response becomes more collective and approaches the plane-wave limit. Furthermore, we analyze how the width of the light beam affects the spatial extent of the response of the array. Our comprehensive analysis enables us to determine the properties of the light beam that produce the strongest optical responses for both infinite and finite systems. The results of this work provide strong theoretical insight into the excitation of lattice resonances by light beams of finite width, which, in addition to being highly applicable to experimental studies, also reveals a rich variety of behaviors that are not present in the case of plane-wave excitation.
Results and Discussion
The system under study is depicted in Figure 1a. It consists of a square array of period a made of identical silver nanospheres with diameter D. The array is surrounded by vacuum and located in the xy plane. We assume that the diameter of the nanoparticles D is significantly smaller than both the array period a and the wavelength of light λ, which allows us to describe the response of the array using the coupled dipole model.13,21,24,29,74−76 Following this approach, we model the nanoparticles as point dipoles with a polarizability α, which we compute from the dipolar Mie scattering coefficient77 using a tabulated dielectric function.78 Then, taking into account the interactions between all of the elements of the array, the dipole induced in the nanoparticle located at position Ri can be written as (see the Methods section)
| 1 |
Here, k∥ are
the components of the wavevector parallel to the array and 1BZ stands
for the first Brillouin zone. Furthermore,  is the polarizability of the array, and
  is the lattice sum, both defined in the Methods section. The array is excited by a light
beam with finite width propagating along the negative z axis and centered at the origin of the xy plane
(i.e., x = y = 0), whose electric
field at Ri can be expressed
using the angular spectrum representation73 as
is the lattice sum, both defined in the Methods section. The array is excited by a light
beam with finite width propagating along the negative z axis and centered at the origin of the xy plane
(i.e., x = y = 0), whose electric
field at Ri can be expressed
using the angular spectrum representation73 as
| 2 |
To satisfy Maxwell’s equations, E(k∥) has to fulfill E(k∥)·[k∥ + kzẑ] = 0 with  and k = 2π/λ.
It is important to remark that this expression is valid under both
paraxial and nonparaxial conditions. Throughout this work, we focus
on a light beam with a Gaussian intensity profile, for which E(k∥) = E0 [x̂ – ẑkx/kz] f(|k∥|) with f(|k∥|) =
2πw02 exp[−w0|k∥|2/2] and E0 being a constant. This field is predominantly polarized along the x axis, but the condition E(k∥)·[k∥ + kzẑ] = 0
forces it to have a nonzero longitudinal component. The parameter w0 controls the width of the light beam, and,
as expected, the field defined by eq 2 becomes an x-polarized plane wave
in the limit w0k ≫
1. Incidentally, 2/(w0k) could be used to approximately estimate the minimum numerical aperture
that would be needed in an experimental setup to create the finite-width
light beam with w0.
and k = 2π/λ.
It is important to remark that this expression is valid under both
paraxial and nonparaxial conditions. Throughout this work, we focus
on a light beam with a Gaussian intensity profile, for which E(k∥) = E0 [x̂ – ẑkx/kz] f(|k∥|) with f(|k∥|) =
2πw02 exp[−w0|k∥|2/2] and E0 being a constant. This field is predominantly polarized along the x axis, but the condition E(k∥)·[k∥ + kzẑ] = 0
forces it to have a nonzero longitudinal component. The parameter w0 controls the width of the light beam, and,
as expected, the field defined by eq 2 becomes an x-polarized plane wave
in the limit w0k ≫
1. Incidentally, 2/(w0k) could be used to approximately estimate the minimum numerical aperture
that would be needed in an experimental setup to create the finite-width
light beam with w0.
Figure 1.

(a) Schematics of the system under consideration, which consists of a periodic array of period a made of silver nanospheres with diameter D = 100 nm. The array is excited by a predominantly x-polarized beam of finite width propagating along the negative z axis and centered at x = y = 0. (b–e) Extinction efficiency for arrays with a = 300 (b), 400 (c), 500 (d), and 600 nm (e), calculated for different values of w0, as indicated by the legends. In all cases, the dashed gray curve shows the response of the array when excited by a plane wave.
Importantly, while the integral in eq 1 spans the first Brillouin zone of the array, the one in eq 2 runs over all k∥ that satisfy |k∥| ≤ k (i.e., it excludes all evanescent waves). Therefore, in order to compute the induced dipole using eq 1, it is necessary to appropriately transform the k∥ components of the electric field amplitude given in eq 2. This can be done by exploiting the periodicity of the array, which allows us to write
| 3 |
with the sum running over all of the reciprocal lattice vectors q = 2π[mx̂ + nŷ]/a (with m and n being integers) that satisfy |k∥ + q| ≤ k.
Once we know the dipole induced in the nanoparticles of the array, we can use it to calculate the extinction efficiency of the whole system. This quantity can be written as (see the Methods section)
| 4 |
where P0 is the power carried by the light beam exciting the array.
Figure 1b–e
displays the extinction efficiency of the lattice resonance with the
smallest energy, i.e., the one appearing at the largest wavelength,
supported by arrays with D = 100 nm and different
periods a. There, the colored curves correspond to
excitation by a finite-width light beam, while the gray dashed curve
shows the plane-wave limit. As indicated by the legends, smaller values
of w0 are represented by darker colored
curves, while lighter ones correspond to larger values of w0. Expectedly, in all cases, the extinction
efficiency approaches the plane-wave limit as w0 is increased. However, the value of w0 needed to reach the plane-wave limit is strongly dependent
on the period of the array a. This can be understood
by noting that lattice resonances are associated with the poles of
the array polarizability  , which, for excitation with an x-polarized field, appear approximately at wavelengths for
which
, which, for excitation with an x-polarized field, appear approximately at wavelengths for
which  vanishes. While the first term is controlled
by the properties of the nanoparticles (scaling as D–3 for the nanospheres under consideration), the
latter is determined by the geometrical characteristics of the array.
In particular, the real part of the lattice sum diverges to +∞
as the wavelength approaches the first Rayleigh anomaly (λ = a for k∥ = 0) from its red
side. Therefore, in order for the array to sustain a collective lattice
resonance, Re{α–1} must also take on a positive
value of significant magnitude for λ ≳ a. As illustrated in Figure S1 of the Supporting Information, this happens for wavelengths larger than that
of the localized plasmon resonance of the individual nanoparticles,
and, hence, only the systems for which the localized plasmon occurs
on the blue side of the Rayleigh anomaly can support truly collective
lattice resonances.12,74
vanishes. While the first term is controlled
by the properties of the nanoparticles (scaling as D–3 for the nanospheres under consideration), the
latter is determined by the geometrical characteristics of the array.
In particular, the real part of the lattice sum diverges to +∞
as the wavelength approaches the first Rayleigh anomaly (λ = a for k∥ = 0) from its red
side. Therefore, in order for the array to sustain a collective lattice
resonance, Re{α–1} must also take on a positive
value of significant magnitude for λ ≳ a. As illustrated in Figure S1 of the Supporting Information, this happens for wavelengths larger than that
of the localized plasmon resonance of the individual nanoparticles,
and, hence, only the systems for which the localized plasmon occurs
on the blue side of the Rayleigh anomaly can support truly collective
lattice resonances.12,74
This is clearly not the
case for the array with a = 300 nm since, as shown
in Figure S2 of the Supporting Information, the localized plasmon resonance of
the individual nanoparticles is located at λ ≈ 395 nm
for D = 100 nm. As a consequence, its response is
mostly dominated by that of the individual nanoparticles, slightly
modified by the interaction with their neighbors, and the resonance
supported by the array is not collective in nature. The evolution
of the extinction spectrum with w0 confirms
this hypothesis: even for the smallest w0 considered here, w0 = a, the extinction efficiency closely resembles that of the plane-wave
limit. It is important to note here that we are able to consider the
case of w0 = a because
we use a full nonparaxial description of the light beam rather than
relying on the paraxial approximation. On the other hand, the arrays
with larger periods, for which the plasmon lies on the blue side of
the Rayleigh anomaly, support true lattice resonances and thus require
significantly larger values of w0 to approach
the plane-wave limit, with larger values of a requiring
wider beams to reach this limit. The reason is that, for a given λ/a, the real part of the lattice sum scales as a–3. Then, as a increases for a
fixed value of D, the position of the lattice resonance
moves closer to the Rayleigh anomaly, where  takes larger values. Physically, this means
that the lattice resonance becomes more collective,27 and therefore, it is necessary to simultaneously excite
many more nanoparticles to recover the plane-wave limit.
takes larger values. Physically, this means
that the lattice resonance becomes more collective,27 and therefore, it is necessary to simultaneously excite
many more nanoparticles to recover the plane-wave limit.
We can gain more insight by explicitly analyzing the properties of the lattice resonances excited by finite-width light beams. Specifically, in Figure 2, we plot the peak value of the extinction efficiency and the quality factor Q for the spectra of Figure 1. The different solid curves display the results corresponding to the different array periods, while the dashed lines show the plane-wave limit. As expected, the extinction efficiency, which is shown in Figure 2a normalized to the plane-wave limit, approaches this limit as w0 increases. However, as we discussed above, the arrays with larger a require much larger values of w0 to reach that limit. For example, when the array period is increased from a = 400 nm to a = 600 nm, the value of w0 needed to approach the plane-wave limit increases by approximately 2 orders of magnitude.
Figure 2.
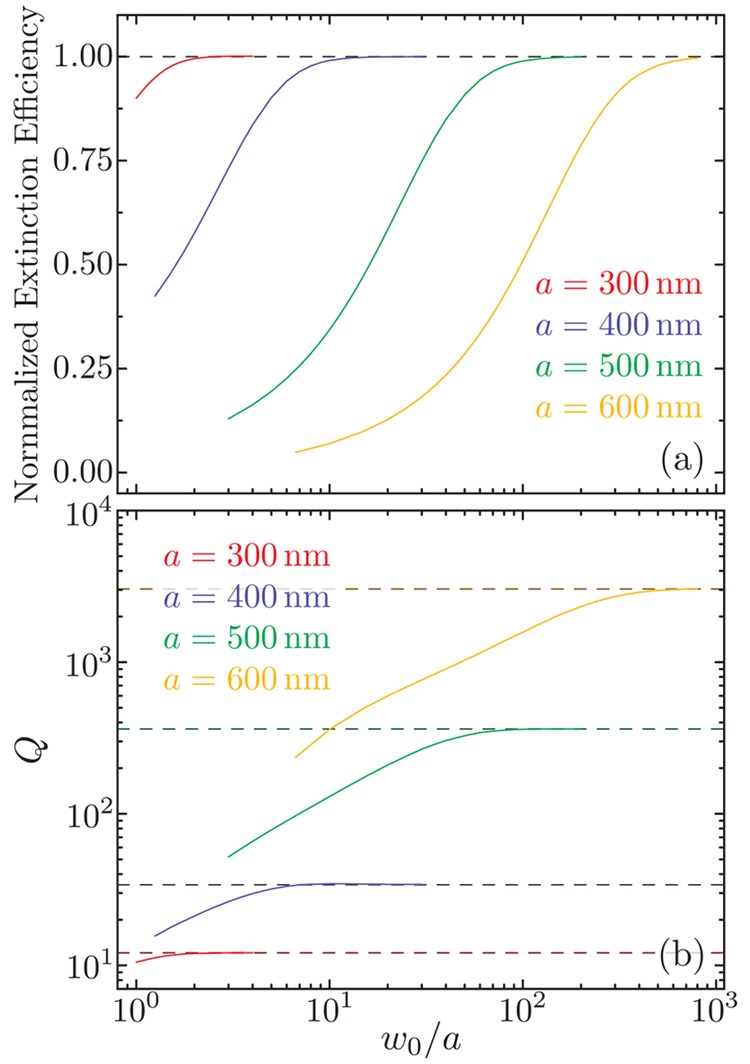
Peak value of the extinction efficiency (a) and quality factor (b) of the lattice resonances supported by the arrays of Figure 1 when excited by a finite-width light beam with different w0. As indicated by the legend, the different solid curves depict the results for different a, while the dashed lines indicate the corresponding plane-wave limit. The peak value of the extinction efficiency is normalized to the result obtained for the same array under plane-wave excitation.
The same general trend is observed in Figure 2b for the quality factor of the resonance, which is defined as the ratio between the wavelength of the resonance and its full-width at half-maximum. Interestingly, before it saturates to the plane-wave limit, the evolution of Q with w0 appears approximately linear in the figure, which, given the log–log scale, corresponds to a power-law growth. It is also important to note that the values of Q that are achieved in the plane-wave limit vary with a by several orders of magnitude. This is consistent with the scaling Q ∼ (a/D)9 of the quality factor of a lattice resonance for a/D ≫ 1 that we derived in ref (29) for plane-wave excitation. These two behaviors are a direct consequence of the increase in the collective nature of the lattice resonance as the ratio a/D grows.27 The more collective the lattice resonance gets, the larger its quality factor becomes, but simultaneously, it demands a larger number of nanostructures to be uniformly excited in order to sustain it. This imposes an obvious limitation on the minimum size of the arrays needed for an experiment, since there must be enough nanoparticles for the light beam to excite. Indeed, the interplay between the size of the array and the width of the light beam gives rise to very interesting behaviors that we discuss later.
So far, we have examined the response of the array as a whole, but it is also interesting to consider what occurs at the level of the individual nanoparticles. To that end, in Figure 3a–c, we plot the square of the amplitude of the induced dipoles |pi|2 for an array with a = 500 nm and D = 100 nm when excited by light beams with different w0. In all cases, the induced dipoles are calculated at the wavelength of the lattice resonance and normalized to their maximum value, which, expectedly, is reached in the nanoparticle located at the origin. For w0 = 10a, the spatial distribution of the induced dipoles is highly asymmetric, but for larger values of w0, the asymmetry becomes less pronounced. This behavior is analyzed in more detail in Figure 3d–f, in which blue and red solid curves display slices of the results of Figure 3a–c along the y and x axis, respectively. Examining the results for w0 = 10a, we observe that along the y axis the value of |pi|2 at a distance of 75a remains above 16% of its maximum. However, |pi|2 drops below that value at a distance of ∼14a along the x axis. This difference gradually decreases as w0 takes larger values. At the same time, the spatial distribution of the induced dipoles extends farther away from the origin and its shape becomes closer to a Gaussian profile. For comparison, the black dashed curves display the normalized electric field intensity of the light beam |Ei|2, which, for the values of w0 under consideration, takes indistinguishable values along the y and x axes. Importantly, in all cases, the spatial extension of the distribution of |pi|2 along the y axis clearly exceeds that of |Ei|2, although it does so by a smaller degree for larger w0. On the contrary, they perfectly match along the x axis.
Figure 3.

(a–c) Square of the amplitude of the induced dipoles |pi|2 for an array with a = 500 nm and D = 100 nm when excited
by a finite-width light beam with w0 =
10a (a), 50a (b), and 100a (c). In all cases, the induced dipoles are calculated
at the wavelength of the lattice resonance and normalized to their
largest value. (d–f) Slices of panels a–c along the y axis (blue solid curves) and x axis (red
solid curves). The dashed black curves show the value of the normalized
electric field intensity of the light beam |Ei|2. (g–i) Comparison of  (green curves) and [f(|k∥|)]2 (yellow curves) as a function
of ky for kx = 0 and for the same w0 as in a–c. Both quantities are normalized to
their maximum value.
(green curves) and [f(|k∥|)]2 (yellow curves) as a function
of ky for kx = 0 and for the same w0 as in a–c. Both quantities are normalized to
their maximum value.
In order to understand all of these behaviors, we need to consider that lattice resonances originate from the far-field coupling between the elements of the array, which is maximum along the axis perpendicular to the dipole moment induced in the nanoparticles.67 As discussed above, the electric field of the light beam that we consider in this work is mainly polarized along the x axis (see eq 2), and therefore, the lattice resonance excited in the array propagates predominantly along the y axis. This explains the strongly asymmetric spatial distribution of |pi|2 observed for the smallest value of w0. The asymmetry is reduced as w0 increases, and consequently, the width of the light beam becomes first comparable to and then larger than the propagation length of the lattice resonance. When that happens, the shape of the spatial distribution of the induced dipole closely follows the profile of the electric field intensity of the light beam.
To further support this explanation, we examine
the response of
both the array and the light beam in reciprocal space. In particular, Figure 3g–i shows
the values of  (green curves), which characterizes the
intrinsic response of the array, and [f(|k∥|)]2 (yellow curves), which defines
the profile of the electric field intensity of the light beam, both
as a function of ky for kx = 0 and normalized to their
maximum value. Notice that the inverse of the width of
(green curves), which characterizes the
intrinsic response of the array, and [f(|k∥|)]2 (yellow curves), which defines
the profile of the electric field intensity of the light beam, both
as a function of ky for kx = 0 and normalized to their
maximum value. Notice that the inverse of the width of  can be associated with an effective propagation
length for the lattice resonance. Comparing the two quantities, we
observe that, while for w0 = 10a, [f(|k∥|)]2 is much broader than the array polarizability, the
opposite is true for w0 = 100a. This confirms that, as w0 increases,
the spatial distribution of the induced dipoles transitions from being
determined by the lattice resonance of the array to being determined
by the characteristics of the light beam. Importantly, the fact that,
for certain values of w0, the induced
dipoles take significant values even beyond the spatial extent of
the light beam can be used experimentally to excite areas of the array
that are not directly illuminated by it.
can be associated with an effective propagation
length for the lattice resonance. Comparing the two quantities, we
observe that, while for w0 = 10a, [f(|k∥|)]2 is much broader than the array polarizability, the
opposite is true for w0 = 100a. This confirms that, as w0 increases,
the spatial distribution of the induced dipoles transitions from being
determined by the lattice resonance of the array to being determined
by the characteristics of the light beam. Importantly, the fact that,
for certain values of w0, the induced
dipoles take significant values even beyond the spatial extent of
the light beam can be used experimentally to excite areas of the array
that are not directly illuminated by it.
Our analysis of the results displayed in Figure 3 has revealed that the spatial distribution of the induced dipoles has a nontrivial dependence with w0 and that, in particular, many interesting behaviors emerge at the level of the individual nanoparticles as w0 varies. Motivated by this, in Figure 4, we investigate the optimal value of w0 that produces the maximum optical response in a cluster of nanoparticles constituting a subset of the full array. To do so, we define the following function
| 5 |
where the sum runs over all of the nanoparticles
located at a distance from the origin smaller than L, i.e., those satisfying |Ri| ≤ L, as indicated in the inset of Figure 4a. For n = 2, this function characterizes the linear response of the cluster.
In particular,  is proportional to the total power absorbed
by the nanoparticles in the cluster. On the other hand, for n > 2, this function provides different estimates of
the
nonlinear response of the cluster. It is important to note that in
order to obtain a meaningful comparison between light beams with different w0, we choose E0 such
that all of them carry the same total power. Figure 4a shows the results for n = 2 in units of e2 μm2, with e being the elementary charge. We
consider an array with a = 500 nm and D = 100 nm and, as indicated by the legend, the different colored
curves show the results obtained for different values of w0. Examining these results, we observe that, when L < 10a, the largest values of
is proportional to the total power absorbed
by the nanoparticles in the cluster. On the other hand, for n > 2, this function provides different estimates of
the
nonlinear response of the cluster. It is important to note that in
order to obtain a meaningful comparison between light beams with different w0, we choose E0 such
that all of them carry the same total power. Figure 4a shows the results for n = 2 in units of e2 μm2, with e being the elementary charge. We
consider an array with a = 500 nm and D = 100 nm and, as indicated by the legend, the different colored
curves show the results obtained for different values of w0. Examining these results, we observe that, when L < 10a, the largest values of  are obtained for the beam with the smallest w0. However, as the size of the cluster grows,
the optimum value of w0 continuously increases.
Indeed, we can infer from the results that, for a given L, the largest values of
are obtained for the beam with the smallest w0. However, as the size of the cluster grows,
the optimum value of w0 continuously increases.
Indeed, we can infer from the results that, for a given L, the largest values of  are obtained for light beams with w0 ≳ L. Expectedly, this
trend saturates as the response of the system reaches the plane-wave
limit, which, for the array under consideration, occurs for w0 ≈ 150a. We can explain
all of these results by considering two competing mechanisms: on one
hand, smaller values of w0 result in a
higher intensity directed at the nanoparticles of the cluster and,
hence, a larger individual response, but, on the other hand, as w0 grows, the response of the array becomes more
collective and therefore the strength of the lattice resonance increases,
as demonstrated in Figures 1 and 2. Consequently, as L grows, the second mechanism increasingly dominates the response
of the cluster, thus favoring larger values of w0.
are obtained for light beams with w0 ≳ L. Expectedly, this
trend saturates as the response of the system reaches the plane-wave
limit, which, for the array under consideration, occurs for w0 ≈ 150a. We can explain
all of these results by considering two competing mechanisms: on one
hand, smaller values of w0 result in a
higher intensity directed at the nanoparticles of the cluster and,
hence, a larger individual response, but, on the other hand, as w0 grows, the response of the array becomes more
collective and therefore the strength of the lattice resonance increases,
as demonstrated in Figures 1 and 2. Consequently, as L grows, the second mechanism increasingly dominates the response
of the cluster, thus favoring larger values of w0.
Figure 4.

(a–c) Value of  , defined in eq 5, as a function of L for n = 2 (a), 3 (b), and 4 (c). All calculations are performed
for an array with a = 500 nm and D = 100 nm and different values of w0,
as indicated by the legend.
, defined in eq 5, as a function of L for n = 2 (a), 3 (b), and 4 (c). All calculations are performed
for an array with a = 500 nm and D = 100 nm and different values of w0,
as indicated by the legend.
The behavior of  for n > 2 is analyzed
in Figure 4b and 4c, which shows, respectively, the values of
for n > 2 is analyzed
in Figure 4b and 4c, which shows, respectively, the values of  and
and  . For a small cluster size, the behavior
is similar to that of the n = 2 case. However, as L grows, we observe that
. For a small cluster size, the behavior
is similar to that of the n = 2 case. However, as L grows, we observe that  and
and  reach their largest values for w0 = 50a and 25a, respectively, and then continuously decrease as w0 further grows. This is a direct consequence of the larger
exponent in the induced dipole, which favors having a larger intensity
on the nanoparticles of the cluster over the collective enhancement
provided by the lattice resonances. Therefore, we conclude that, as
the size of the cluster increases, its linear response is enhanced
by the collective nature of the lattice resonance and therefore grows
with w0. On the contrary, for a response
associated with a larger value of n, there appears
to be optimum values of w0 that maximize
it. These results have important implications for experimental techniques
such as surface-enhanced Raman scattering (SERS) spectroscopy, since
they suggest that, under certain conditions, the optimal excitation
scenario is not necessarily a plane wave, but rather a light beam
of finite width.
reach their largest values for w0 = 50a and 25a, respectively, and then continuously decrease as w0 further grows. This is a direct consequence of the larger
exponent in the induced dipole, which favors having a larger intensity
on the nanoparticles of the cluster over the collective enhancement
provided by the lattice resonances. Therefore, we conclude that, as
the size of the cluster increases, its linear response is enhanced
by the collective nature of the lattice resonance and therefore grows
with w0. On the contrary, for a response
associated with a larger value of n, there appears
to be optimum values of w0 that maximize
it. These results have important implications for experimental techniques
such as surface-enhanced Raman scattering (SERS) spectroscopy, since
they suggest that, under certain conditions, the optimal excitation
scenario is not necessarily a plane wave, but rather a light beam
of finite width.
One important aspect that we need to consider is that, although arrays of nanoparticles are usually modeled as perfectly periodic and, hence, infinite systems, they must have a finite size in any experimental realization. This can lead to significant discrepancies between their optical response and the theoretical predictions obtained for infinite arrays. Such discrepancies, commonly known as finite-size effects, arise from the presence of edges as well as from the truncation of the collective behavior due to the finiteness of the structure. Several works have investigated the impact of finite-size effects on the response of periodic arrays of metallic nanoparticles under plane-wave excitation conditions.29,76,79−81 Then, it is very interesting to extend these studies to the cases in which the array is excited by a light beam with finite width and, in particular, investigate the effects arising from the interplay between the size of the array and the extension of the beam.
To that end, in Figure 5, we plot the peak value of the extinction efficiency and the quality factor Q of the lattice resonance supported by a finite array with N × N nanoparticles when excited by a light beam with different w0. These results are extracted from the extinction spectra plotted in Figure S3 of the Supporting Information (see the Methods section for details of the calculation). In all cases, the array has a = 400 nm and D = 100 nm and, as indicated by the legend, the different colored curves correspond to different values of N. Examining the peak extinction efficiency shown in Figure 5a, which is normalized to the value obtained for the same array under plane-wave excitation, we observe two very interesting behaviors. First, the extinction efficiency reaches a maximum at a certain value of w0 and then becomes smaller as w0 is further increased. Second, in some cases, the maximum value of the normalized extinction efficiency reaches values above one. This means that, when excited by the appropriate finite-width light beam, the extinction efficiency of the lattice resonance supported by finite arrays can surpass that obtained under plane-wave excitation conditions. Both of these behaviors are in sharp contrast with the results obtained for infinite arrays, for which, as shown in Figure 2, the maximum extinction efficiency is always reached at the plane-wave limit.
Figure 5.

Peak value of the extinction efficiency (a) and quality factor (b) of the lattice resonance of a finite array with N × N nanoparticles when excited by a finite-width light beam with different w0. In all cases, the array under consideration has a = 400 nm and D = 100 nm. As indicated by the legend, the different colored curves depict the results for different values of N. The peak value of the extinction efficiency is normalized to the result obtained for the same array under plane-wave excitation.
The quality factor of the lattice resonance, which is analyzed in Figure 5b, also displays a maximum, although, as opposed to the extinction efficiency, its value does not significantly decrease for larger values of w0. Expectedly, Q increases as N grows, approaching the value for the infinite array under plane-wave excitation, which is indicated by the black dashed line. Indeed, we know from previous works that, for plane-wave excitation, both the extinction efficiency and the quality factor become larger with the size of the array due to the increase of the collective nature of the lattice resonance that they support.29,76 As shown by both Figure S3 of the Supporting Information and Figure 5b, that behavior is clearly preserved under excitation by a finite-width light beam. However, in this case, for a given N, there exists an optimum value of w0 such that the spatial extension of the light beam is large enough to maximize the collective behavior of the lattice resonance but, at the same time, it concentrates as much intensity as possible in the area covered by the finite array. Therefore, this interplay between the size of the array and the width of the light beam is what gives rise to the interesting results shown in Figure 5. Furthermore, these results highlight the importance, for any experimental realization of these systems, of using a light beam with a width that is appropriately tailored to the finite size of the array.
All of the arrays we have investigated so far are made of the repetition of a unit cell with a single nanoparticle. However, arrays with multiparticle unit cells have been shown to display very interesting optical responses.19,22,24,37,82−86 These systems can support lattice resonances with properties that are fully controlled by the size and relative position of the nanoparticles in the unit cell.24 It is therefore very relevant to investigate how these lattice resonances behave when excited by a light beam with a finite width. To fulfill this goal, we analyze the response of the bipartite array depicted in Figure 6a. This array is made from the repetition over a square lattice of period a = 500 nm of a unit cell (shaded area) composed of two silver nanospheres with diameters of 90 and 110 nm. The smaller nanoparticle is located at the origin of the unit cell, while the larger one is placed at a distance d = Δxx̂ + Δyŷ with Δx = a/2.
Figure 6.

(a) Schematics of the bipartite array under consideration, which is built from the periodic repetition of a unit cell containing two silver nanospheres (shaded area) over a square lattice of period a = 500 nm. The smaller nanoparticle has a diameter of 90 nm and is located at the origin of the unit cell, while the larger one has a diameter of 110 nm and is placed at a distance d = Δxx̂ + Δyŷ from the other nanoparticle. (b) Extinction efficiency for the bipartite array when excited by either a plane wave (gray dashed curves) or a finite-width light beam with w0 = 10a (light solid curves) or w0 = 100a (dark solid curves). As indicated by the legend, the red, blue, and green curves correspond to bipartite arrays with Δy = 0, a/4, and a/2, respectively, while Δx = a/2 in all cases. (c–f) Spatial dependence of the square of the amplitude of the induced dipoles |pi|2 along the y axis for the bipartite array with Δy = 0 (c), a/2 (d), and a/4 (e, f). All induced dipoles are calculated at the wavelengths of the lattice resonances indicated above the panel, assuming that w0 = 100a, and are normalized to the largest value. The solid and dashed curves represent the values corresponding to the smaller and larger nanoparticles, respectively.
The bipartite array supports lattice resonances with very different properties depending on the value of Δy, as shown in Figure 6b. There, we plot the extinction efficiency for Δy = 0, a/4, and a/2 using the different colors indicated by the legend. In all cases, the light and dark solid colored curves represent the results obtained for excitation by a finite-width light beam with w0 = 10a and 100a, respectively, while the dashed gray curves indicate the results under plane-wave excitation. To perform these calculations, we extended eqs 1, 2, and 4 to account for multiparticle unit cells, following the approach described in refs (24) and (29). Examining the extinction efficiency spectra, we observe that, for both Δy = 0 and Δy = a/2, the system supports a single lattice resonance. However, while the resonance of the former is characterized by a broad linewidth and a large peak extinction efficiency, the latter displays the exact opposite characteristics. These resonances correspond, respectively, to the super- and subradiant lattice resonances described in ref (29), in which the dipoles induced in the nanoparticles oscillate in phase and in antiphase. On the other hand, for Δy = a/4, the system supports two different lattice resonances, each of which corresponds to the lattice resonance of one of the two single-particle arrays into which the bipartite array can be separated.24,29
Importantly, for all of the cases under investigation, the extinction efficiency spectrum for w0 = 100a completely matches that obtained for plane-wave excitation. However, for w0 = 10a, the extinction efficiency reaches smaller peak values and the quality factor deteriorates significantly. These results reveal the collective nature of the lattice resonances supported by bipartite arrays and confirm that their optical response evolves in the same way as that of their single-particle counterparts when excited by light beams of finite width.
To complete our analysis, in Figure 6c–f, we examine the response of the lattice resonances of the bipartite array at the level of the individual nanoparticles. We do so by analyzing the square of the amplitude of the dipole induced in the nanoparticles of the unit cells located along the y axis for the different arrays considered in Figure 6a. In all cases, the arrays are excited by a finite-width light beam with w0 = 100a and the calculations are performed at the wavelength of the lattice resonance, which is indicated above each of the panels. We use solid and dashed curves to display the value of |pi|2 for the smaller and larger nanoparticles, respectively. As discussed above, the lattice resonances supported by the arrays with Δy = 0 and a/2 involve the simultaneous excitation of the two nanoparticles in the unit cell, with the only difference being their relative phase. Consequently, the spatial distributions of the induced dipole, shown, respectively, in Figure 6c and 6d, are visually identical, with the larger particle displaying a larger value of |pi|2 due to its larger polarizability. As expected, these distributions follow the Gaussian profile of the finite-width light beam and are peaked at the origin, where the field reaches its maximum value.
The behavior is different for the array with Δy = a/4. This system supports two lattice resonances, which produce the spatial distributions of |pi|2 shown in Figure 6e and 6f. As expected, the first lattice resonance, which occurs closer to the Rayleigh anomaly, is sustained by the smaller nanoparticles, while for the second one, the situation is completely reversed. Examining these results more closely, we can see that, in both cases, the spatial distribution of |pi|2 for the nanoparticle sustaining the lattice resonance follows a Gaussian shape, while the distribution for the other nanoparticle in the unit cell displays a more complicated one. Interestingly, the largest induced dipole does not occur in the nanoparticles located at the origin, even though that is where the field of the light beam is maximum. On the contrary, the maximum induced dipole is reached at a unit cell located in the positive part of the y axis. This behavior can be attributed to the fact that, as opposed to the other two systems, the array with Δy = a/4 is not symmetric under inversion over the x axis. While this characteristic is irrelevant for plane-wave excitation, it does induce a spatially asymmetric response when the array is excited by a finite-width light beam. These results highlight, once again, the nontrivial behavior of lattice resonances when excited by finite-width light beams.
Conclusions
In summary, we have performed a comprehensive analysis of the behavior of the lattice resonances supported by periodic arrays of nanoparticles when excited by light beams of finite width. To do so, we have implemented a theoretical approach based on the combination of the coupled dipole model and the angular spectrum representation, which, despite its simplicity, provides a rigorous description of the excitation of periodic arrays by arbitrary light beams under paraxial as well as nonparaxial conditions. Using this approach, we have shown that the optical response produced by the lattice resonances of the array is strongly dependent on the width of the light beam that excites them. As the width of the light beam increases and hence approaches the plane-wave limit, the response becomes more collective, giving rise to larger extinction efficiencies and quality factors. Interestingly, the width at which the plane-wave limit is reached can vary by orders of magnitude depending on the characteristics of the array. Furthermore, we have found that when the propagation length of the lattice resonance exceeds the width of the light beam, the spatial response of the array displays a significant asymmetry, extending farther away in the direction perpendicular to the polarization of the light beam. We have also identified the optimum characteristics of a light beam to produce the strongest optical responses in both finite and infinite systems, revealing a complicated interplay between the size of the array and the extension of the beam that excites it. Finally, we have extended our analysis to the lattice resonances of bipartite arrays, for which, depending on the geometry of their unit cell, excitation by finite-width light beams can result in symmetry breaking effects. Although we have focused on arrays of metallic nanoparticles, our theoretical approach can be readily extended to arrays made of other elements, such as dielectric nanostructures87 or atoms,88−90 by using the appropriate polarizability. This work establishes a solid theoretical framework to understand the excitation of lattice resonances by light beams of finite-width, revealing a range of behaviors that are not present under plane-wave excitation. Due to the realistic nature of the finite-width light beams we consider, our results are highly relevant to any experimental efforts dedicated to exploiting the extraordinary optical properties of lattice resonances.
Methods
Derivation of the Induced Dipole
Within the dipolar approximation, we describe the response of each of the nanospheres using a point dipole with polarizability α. Then, following the coupled dipole model,13,21,24,29,74−76 we can write the dipole induced in the nanoparticle located at position Ri as
| 6 |
Here, Ei is the external field at the nanoparticle,  is the Green tensor of vacuum, and k = 2π/λ (notice that we use Gaussian units).
For an infinite array of period a, we can exploit
its periodicity and use the Fourier transform defined as
is the Green tensor of vacuum, and k = 2π/λ (notice that we use Gaussian units).
For an infinite array of period a, we can exploit
its periodicity and use the Fourier transform defined as  , where the integral runs over the first
Brillouin zone. By doing so, we transform eq 6 into the following self-consistent expression
for the k∥ components of the dipole
induced in the nanoparticles
, where the integral runs over the first
Brillouin zone. By doing so, we transform eq 6 into the following self-consistent expression
for the k∥ components of the dipole
induced in the nanoparticles
| 7 |
where  is known as the lattice sum. Then, solving eq 7, we obtain
  , with
  being the polarizability
of the array. In the case of a finite array, eq 6 can be directly solved to obtain pi = ∑jAijEj with
being the polarizability
of the array. In the case of a finite array, eq 6 can be directly solved to obtain pi = ∑jAijEj with  .
.
Derivation of the Extinction Efficiency of the Array
We can calculate  by summing the extinction efficiency of
each of the dipoles in the array:
by summing the extinction efficiency of
each of the dipoles in the array:  . For an infinite array, we can substitute
the expressions of the dipole and field given in eqs 1 and 2, respectively,
and use
. For an infinite array, we can substitute
the expressions of the dipole and field given in eqs 1 and 2, respectively,
and use  to obtain the result of eq 4.
Acknowledgments
This work was sponsored by a Leonardo Grant for Researchers in Physics from the BBVA Foundation. The authors also acknowledge support from Grant Nos. PID2019-104268GB-C21 and PID2019-109502GA-I00 funded by MCIN/AEI/10.13039/501100011033 as well as the U.S. National Science Foundation (Grant No. DMR-1941680). L.Z. acknowledges support from the Department of Energy Computational Science Graduate Fellowship (Grant No. DE-SC0020347). J.R.D.-R. acknowledges a predoctoral fellowship from the MCIN/AEI assigned to Grant No. PID2019-109502GA-I00. We also thank the UNM Center for Advanced Research Computing, supported in part by the U.S. National Science Foundation, for providing some of the computational resources used in this work.
Supporting Information Available
The Supporting Information is available free of charge at https://pubs.acs.org/doi/10.1021/acsomega.2c03847.
Analysis of the origin of the lattice resonance within the coupled dipole model; extinction cross section of an individual nanoparticle; extinction efficiency spectra for finite arrays of nanoparticles excited by either finite-width light beams with different w0 or a plane wave (PDF)
Author Contributions
§ L.Z. and J.R.D.-R.: These authors contributed equally to this paper.
The authors declare no competing financial interest.
Supplementary Material
References
- Maier S. A.Plasmonics: Fundamentals and Applications; Springer: New York, 2007. [Google Scholar]
- Myroshnychenko V.; Rodríguez-Fernández J.; Pastoriza-Santos I.; Funston A. M.; Novo C.; Mulvaney P.; Liz-Marzán L. M.; García de Abajo F. J. Modelling the optical response of gold nanoparticles. Chem. Soc. Rev. 2008, 37, 1792–1805. 10.1039/b711486a. [DOI] [PubMed] [Google Scholar]
- Álvarez-Puebla R. A.; Liz-Marzán L. M.; García de Abajo F. J. Light concentration at the nanometer scale. J. Phys. Chem. Lett. 2010, 1, 2428–2434. 10.1021/jz100820m. [DOI] [Google Scholar]
- Atwater H. A.; Polman A. Plasmonics for improved photovoltaic devices. Nat. Mater. 2010, 9, 205–213. 10.1038/nmat2629. [DOI] [PubMed] [Google Scholar]
- Brongersma M. L.; Halas N. J.; Nordlander P. Plasmon-induced hot carrier science and technology. Nat. Nanotechnol. 2015, 10, 25–34. 10.1038/nnano.2014.311. [DOI] [PubMed] [Google Scholar]
- Ding S.-Y.; You E.-M.; Tian Z.-Q.; Moskovits M. Electromagnetic theories of surface-enhanced Raman spectroscopy. Chem. Soc. Rev. 2017, 46, 4042–4076. 10.1039/C7CS00238F. [DOI] [PubMed] [Google Scholar]
- Rastinehad A. R.; et al. Gold nanoshell-localized photothermal ablation of prostate tumors in a clinical pilot device study. Proc. Natl. Acad. Sci. U. S. A. 2019, 116, 18590–18596. 10.1073/pnas.1906929116. [DOI] [PMC free article] [PubMed] [Google Scholar]
- Derom S.; Vincent R.; Bouhelier A.; Colas des Francs G. Resonance quality, radiative/ohmic losses and modal volume of Mie plasmons. Europhys. Lett. 2012, 98, 47008. 10.1209/0295-5075/98/47008. [DOI] [Google Scholar]
- Kravets V. G.; Kabashin A. V.; Barnes W. L.; Grigorenko A. N. Plasmonic surface lattice resonances: a review of properties and applications. Chem. Rev. 2018, 118, 5912–5951. 10.1021/acs.chemrev.8b00243. [DOI] [PMC free article] [PubMed] [Google Scholar]
- Doiron B.; Mota M.; Wells M. P.; Bower R.; Mihai A.; Li Y.; Cohen L. F.; Alford N. M.; Petrov P. K.; Oulton R. F.; Maier S. A. Quantifying figures of merit for localized surface plasmon resonance applications: a materials survey. ACS Photonics 2019, 6, 240–259. 10.1021/acsphotonics.8b01369. [DOI] [Google Scholar]
- Zhao L.; Kelly K. L.; Schatz G. C. The extinction spectra of silver nanoparticle arrays: influence of array structure on plasmon resonance wavelength and width. J. Phys. Chem. B 2003, 107, 7343–7350. 10.1021/jp034235j. [DOI] [Google Scholar]
- Zou S.; Janel N.; Schatz G. C. Silver nanoparticle array structures that produce remarkably narrow plasmon lineshapes. J. Chem. Phys. 2004, 120, 10871–10875. 10.1063/1.1760740. [DOI] [PubMed] [Google Scholar]
- García de Abajo F. J. Colloquium: Light scattering by particle and hole arrays. Rev. Mod. Phys. 2007, 79, 1267–1290. 10.1103/RevModPhys.79.1267. [DOI] [Google Scholar]
- Auguié B.; Barnes W. L. Collective resonances in gold nanoparticle arrays. Phys. Rev. Lett. 2008, 101, 143902. 10.1103/PhysRevLett.101.143902. [DOI] [PubMed] [Google Scholar]
- Kravets V. G.; Schedin F.; Grigorenko A. N. Extremely narrow plasmon resonances based on diffraction coupling of localized plasmons in arrays of metallic nanoparticles. Phys. Rev. Lett. 2008, 101, 087403. 10.1103/PhysRevLett.101.087403. [DOI] [PubMed] [Google Scholar]
- Chu Y.; Schonbrun E.; Yang T.; Crozier K. B. Experimental observation of narrow surface plasmon resonances in gold nanoparticle arrays. Appl. Phys. Lett. 2008, 93, 181108. 10.1063/1.3012365. [DOI] [Google Scholar]
- Vecchi G.; Giannini V.; Gómez Rivas J. Surface modes in plasmonic crystals induced by diffractive coupling of nanoantennas. Phys. Rev. B 2009, 80, 201401R. 10.1103/PhysRevB.80.201401. [DOI] [PubMed] [Google Scholar]
- Humphrey A. D.; Meinzer N.; Starkey T. A.; Barnes W. L. Surface lattice resonances in plasmonic arrays of asymmetric disc dimers. ACS Photonics 2016, 3, 634–639. 10.1021/acsphotonics.5b00727. [DOI] [Google Scholar]
- Humphrey A. D.; Barnes W. L. Plasmonic surface lattice resonances in arrays of metallic nanoparticle dimers. J. Opt. 2016, 18, 035005. 10.1088/2040-8978/18/3/035005. [DOI] [Google Scholar]
- Wang W.; Ramezani M.; Väkeväinen A. I.; Törmä P.; Gómez Rivas J.; Odom T. W. The rich photonic world of plasmonic nanoparticle arrays. Mater. Today 2018, 21, 303–314. 10.1016/j.mattod.2017.09.002. [DOI] [Google Scholar]
- Cherqui C.; Bourgeois M. R.; Wang D.; Schatz G. C. Plasmonic surface lattice resonances: theory and computation. Acc. Chem. Res. 2019, 52, 2548–2558. 10.1021/acs.accounts.9b00312. [DOI] [PubMed] [Google Scholar]
- Fradkin I. M.; Dyakov S. A.; Gippius N. A. Nanoparticle lattices with bases: Fourier modal method and dipole approximation. Phys. Rev. B 2020, 102, 045432. 10.1103/PhysRevB.102.045432. [DOI] [Google Scholar]
- Utyushev A. D.; Zakomirnyi V. I.; Rasskazov I. L. Collective lattice resonances: Plasmonics and beyond. Rev. Phys. 2021, 6, 100051. 10.1016/j.revip.2021.100051. [DOI] [Google Scholar]
- Baur S.; Sanders S.; Manjavacas A. Hybridization of lattice resonances. ACS Nano 2018, 12, 1618–1629. 10.1021/acsnano.7b08206. [DOI] [PubMed] [Google Scholar]
- Zou S.; Schatz G. C. Silver nanoparticle array structures that produce giant enhancements in electromagnetic fields. Chem. Phys. Lett. 2005, 403, 62–67. 10.1016/j.cplett.2004.12.107. [DOI] [Google Scholar]
- Nikitin A. G.; Kabashin A. V.; Dallaporta H. Plasmonic resonances in diffractive arrays of gold nanoantennas: near and far field effects. Opt. Express 2012, 20, 27941–27952. 10.1364/OE.20.027941. [DOI] [PubMed] [Google Scholar]
- Manjavacas A.; Zundel L.; Sanders S. Analysis of the limits of the near-field produced by nanoparticle arrays. ACS Nano 2019, 13, 10682–10693. 10.1021/acsnano.9b05031. [DOI] [PubMed] [Google Scholar]
- Scarabelli L.; Vila-Liarte D.; Mihi A.; Liz-Marzán L. M. Templated colloidal self-assembly for lattice plasmon engineering. Acc. Mater. Res. 2021, 2, 816–827. 10.1021/accountsmr.1c00106. [DOI] [Google Scholar]
- Cuartero-González A.; Sanders S.; Zundel L.; Fernández-Domínguez A. I.; Manjavacas A. Super- and subradiant lattice resonances in bipartite nanoparticle arrays. ACS Nano 2020, 14, 11876. 10.1021/acsnano.0c04795. [DOI] [PubMed] [Google Scholar]
- Adato R.; Yanik A. A.; Wu C.-H.; Shvets G.; Altug H. Radiative engineering of plasmon lifetimes in embedded nanoantenna arrays. Opt. Express 2010, 18, 4526–4537. 10.1364/OE.18.004526. [DOI] [PubMed] [Google Scholar]
- Zakomirnyi V. I.; Rasskazov I. L.; Gerasimov V. S.; Ershov A. E.; Polyutov S. P.; Karpov S. V. Refractory titanium nitride two-dimensional structures with extremely narrow surface lattice resonances at telecommunication wavelengths. Appl. Phys. Lett. 2017, 111, 123107. 10.1063/1.5000726. [DOI] [Google Scholar]
- Khlopin D.; Laux F.; Wardley W. P.; Martin J.; Wurtz G. A.; Plain J.; Bonod N.; Zayats A. V.; Dickson W.; Gérard D. Lattice modes and plasmonic linewidth engineering in gold and aluminum nanoparticle arrays. J. Opt. Soc. Am. B 2017, 34, 691–700. 10.1364/JOSAB.34.000691. [DOI] [Google Scholar]
- Le-Van Q.; Zoethout E.; Geluk E.-J.; Ramezani M.; Berghuis M.; Gómez Rivas J. Enhanced quality factors of surface lattice resonances in plasmonic arrays of nanoparticles. Adv. Opt. Mater. 2019, 7, 1801451. 10.1002/adom.201801451. [DOI] [Google Scholar]
- Zhu X.; Imran Hossain G. M.; George M.; Farhang A.; Cicek A.; Yanik A. A. Beyond noble metals: high q-factor aluminum nanoplasmonics. ACS Photonics 2020, 7, 416–424. 10.1021/acsphotonics.9b01368. [DOI] [Google Scholar]
- Deng S.; Li R.; Park J.-E.; Guan J.; Choo P.; Hu J.; Smeets P. J. M.; Odom T. W. Ultranarrow plasmon resonances from annealed nanoparticle lattices. Proc. Natl. Acad. Sci. U. S. A. 2020, 117, 23380–23384. 10.1073/pnas.2008818117. [DOI] [PMC free article] [PubMed] [Google Scholar]
- Bin-Alam M. S.; Reshef O.; Mamchur Y.; Alam M. Z.; Carlow G.; Upham J.; Sullivan B. T.; Ménard J.-M.; Huttunen M. J.; Boyd R. W.; Dolgaleva K. Ultra-high-Q resonances in plasmonic metasurfaces. Nat. Commun. 2021, 12, 974. 10.1038/s41467-021-21196-2. [DOI] [PMC free article] [PubMed] [Google Scholar]
- Zundel L.; May A.; Manjavacas A. Lattice resonances induced by periodic vacancies in arrays of nanoparticles. ACS Photonics 2021, 8, 360–368. 10.1021/acsphotonics.0c01672. [DOI] [Google Scholar]
- Molet P.; Passarelli N.; Pérez L. A.; Scarabelli L.; Mihi A. Engineering plasmonic colloidal meta-molecules for tunable photonic supercrystals. Adv. Opt. Mater. 2021, 9, 2100761. 10.1002/adom.202100761. [DOI] [Google Scholar]
- Adato R.; Yanik A. A.; Amsden J. J.; Kaplan D. L.; Omenetto F. G.; Hong M. K.; Erramilli S.; Altug H. Ultra-sensitive vibrational spectroscopy of protein monolayers with plasmonic nanoantenna arrays. Proc. Natl. Acad. Sci. U. S. A. 2009, 106, 19227–19232. 10.1073/pnas.0907459106. [DOI] [PMC free article] [PubMed] [Google Scholar]
- Thackray B. D.; Kravets V. G.; Schedin F.; Auton G.; Thomas P. A.; Grigorenko A. N. Narrow collective plasmon resonances in nanostructure arrays observed at normal light incidence for simplified sensing in asymmetric air and water environments. ACS Photonics 2014, 1, 1116–1126. 10.1021/ph5002186. [DOI] [Google Scholar]
- Danilov A.; Tselikov G.; Wu F.; Kravets V. G.; Ozerov I.; Bedu F.; Grigorenko A. N.; Kabashin A. V. Ultra-narrow surface lattice resonances in plasmonic metamaterial arrays for biosensing applications. Biosens. Bioelectron. 2018, 104, 102–112. 10.1016/j.bios.2017.12.001. [DOI] [PubMed] [Google Scholar]
- Matricardi C.; Hanske C.; Garcia-Pomar J. L.; Langer J.; Mihi A.; Liz-Marzán L. M. Gold nanoparticle plasmonic superlattices as surface-enhanced raman spectroscopy substrates. ACS Nano 2018, 12, 8531–8539. 10.1021/acsnano.8b04073. [DOI] [PubMed] [Google Scholar]
- Hu J.; Wang D.; Bhowmik D.; Liu T.; Deng S.; Knudson M. P.; Ao X.; Odom T. W. Lattice-resonance metalenses for fully reconfigurable imaging. ACS Nano 2019, 13, 4613–4620. 10.1021/acsnano.9b00651. [DOI] [PubMed] [Google Scholar]
- Olson J.; Manjavacas A.; Basu T.; Huang D.; Schlather A. E.; Zheng B.; Halas N. J.; Nordlander P.; Link S. High chromaticity aluminum plasmonic pixels for active liquid crystal displays. ACS Nano 2016, 10, 1108–1117. 10.1021/acsnano.5b06415. [DOI] [PubMed] [Google Scholar]
- Kristensen A.; Yang J. K. W.; Bozhevolnyi S. I.; Link S.; Nordlander P.; Halas N. J.; Mortensen N. A. Plasmonic colour generation. Nat. Rev. Mater. 2017, 2, 16088. 10.1038/natrevmats.2016.88. [DOI] [Google Scholar]
- Esposito M.; Todisco F.; Bakhti S.; Passaseo A.; Tarantini I.; Cuscunà M.; Destouches N.; Tasco V. Symmetry breaking in oligomer surface plasmon lattice resonances. Nano Lett. 2019, 19, 1922–1930. 10.1021/acs.nanolett.8b05062. [DOI] [PubMed] [Google Scholar]
- Czaplicki R.; Kiviniemi A.; Laukkanen J.; Lehtolahti J.; Kuittinen M.; Kauranen M. Surface lattice resonances in second-harmonic generation from metasurfaces. Opt. Lett. 2016, 41, 2684–2687. 10.1364/OL.41.002684. [DOI] [PubMed] [Google Scholar]
- Michaeli L.; Keren-Zur S.; Avayu O.; Suchowski H.; Ellenbogen T. Nonlinear surface lattice resonance in plasmonic nanoparticle arrays. Phys. Rev. Lett. 2017, 118, 243904. 10.1103/PhysRevLett.118.243904. [DOI] [PubMed] [Google Scholar]
- Huttunen M. J.; Rasekh P.; Boyd R. W.; Dolgaleva K. Using surface lattice resonances to engineer nonlinear optical processes in metal nanoparticle arrays. Phys. Rev. A 2018, 97, 053817. 10.1103/PhysRevA.97.053817. [DOI] [Google Scholar]
- Hooper D. C.; Kuppe C.; Wang D.; Wang W.; Guan J.; Odom T. W.; Valev V. K. Second harmonic spectroscopy of surface lattice resonances. Nano Lett. 2019, 19, 165–172. 10.1021/acs.nanolett.8b03574. [DOI] [PubMed] [Google Scholar]
- Rodriguez S. R. K.; Lozano G.; Verschuuren M. A.; Gomes R.; Lambert K.; De Geyter B.; Hassinen A.; Van Thourhout D.; Hens Z.; Gomez Rivas J. Quantum rod emission coupled to plasmonic lattice resonances: A collective directional source of polarized light. Appl. Phys. Lett. 2012, 100, 111103. 10.1063/1.3693397. [DOI] [Google Scholar]
- Lozano G.; Louwers D. J.; Rodríguez S. R. K.; Murai S.; Jansen O. T. A.; Verschuuren M. A.; Gómez Rivas J. Plasmonics for solid-state lighting: enhanced excitation and directional emission of highly efficient light sources. Light Sci. Appl. 2013, 2, e66. 10.1038/lsa.2013.22. [DOI] [Google Scholar]
- Zhou W.; Dridi M.; Suh J. Y.; Kim C. H.; Co D. T.; Wasielewski M. R.; Schatz G. C.; Odom T. W. Lasing action in strongly coupled plasmonic nanocavity arrays. Nat. Nanotechnol. 2013, 8, 506–511. 10.1038/nnano.2013.99. [DOI] [PubMed] [Google Scholar]
- Lozano G.; Grzela G.; Verschuuren M. A.; Ramezani M.; Gómez Rivas J. Tailor-made directional emission in nanoimprinted plasmonic-based light-emitting devices. Nanoscale 2014, 6, 9223–9229. 10.1039/C4NR01391C. [DOI] [PubMed] [Google Scholar]
- Schokker A. H.; Koenderink A. F. Lasing at the band edges of plasmonic lattices. Phys. Rev. B 2014, 90, 155452. 10.1103/PhysRevB.90.155452. [DOI] [Google Scholar]
- Ramezani M.; Lozano G.; Verschuuren M. A.; Gómez-Rivas J. Modified emission of extended light emitting layers by selective coupling to collective lattice resonances. Phys. Rev. B 2016, 94, 125406. 10.1103/PhysRevB.94.125406. [DOI] [Google Scholar]
- Zakharko Y.; Held M.; Graf A.; Rödlmeier T.; Eckstein R.; Hernandez-Sosa G.; Hähnlein B.; Pezoldt J.; Zaumseil J. Surface lattice resonances for enhanced and directional electroluminescence at high current densities. ACS Photonics 2016, 3, 2225–2230. 10.1021/acsphotonics.6b00491. [DOI] [PMC free article] [PubMed] [Google Scholar]
- Cotrufo M.; Osorio C. I.; Koenderink A. F. Spin-dependent emission from arrays of planar chiral nanoantennas due to lattice and localized plasmon resonances. ACS Nano 2016, 10, 3389–3397. 10.1021/acsnano.5b07231. [DOI] [PubMed] [Google Scholar]
- Schokker A. H.; van Riggelen F.; Hadad Y.; Alù A.; Koenderink A. F. Systematic study of the hybrid plasmonic-photonic band structure underlying lasing action of diffractive plasmon particle lattices. Phys. Rev. B 2017, 95, 085409. 10.1103/PhysRevB.95.085409. [DOI] [Google Scholar]
- Wang D.; Yang A.; Wang W.; Hua Y.; Schaller R. D.; Schatz G. C.; Odom T. W. Band-edge engineering for controlled multi-modal nanolasing in plasmonic superlattices. Nat. Nanotechnol. 2017, 12, 889. 10.1038/nnano.2017.126. [DOI] [PubMed] [Google Scholar]
- Guo R.; Nečada M.; Hakala T. K.; Väkeväinen A. I.; Törmä P. Lasing at K points of a honeycomb plasmonic lattice. Phys. Rev. Lett. 2019, 122, 013901. 10.1103/PhysRevLett.122.013901. [DOI] [PubMed] [Google Scholar]
- Vaskin A.; Kolkowski R.; Koenderink F. A.; Staude I. Light-emitting metasurfaces. Nanophotonics 2019, 8, 1151. 10.1515/nanoph-2019-0110. [DOI] [Google Scholar]
- Yadav R. K.; Bourgeois M. R.; Cherqui C.; Juarez X. G.; Wang W.; Odom T. W.; Schatz G. C.; Basu J. K. Room temperature weak-to-strong coupling and the emergence of collective emission from quantum dots coupled to plasmonic arrays. ACS Nano 2020, 14, 7347–7357. 10.1021/acsnano.0c02785. [DOI] [PubMed] [Google Scholar]
- Yadav R. K.; Otten M.; Wang W.; Cortes C. L.; Gosztola D. J.; Wiederrecht G. P.; Gray S. K.; Odom T. W.; Basu J. K. Strongly coupled exciton-surface lattice resonances engineer long-range energy propagation. Nano Lett. 2020, 20, 5043–5049. 10.1021/acs.nanolett.0c01236. [DOI] [PubMed] [Google Scholar]
- Yadav R. K.; Liu W.; Li R.; Odom T. W.; Agarwal G. S.; Basu J. K. Room-temperature coupling of single photon emitting quantum dots to localized and delocalized modes in a plasmonic nanocavity array. ACS Photonics 2021, 8, 576–584. 10.1021/acsphotonics.0c01635. [DOI] [Google Scholar]
- Boddeti A. K.; Guan J.; Sentz T.; Juarez X.; Newman W.; Cortes C.; Odom T. W.; Jacob Z. Long-range dipole-dipole interactions in a plasmonic lattice. Nano Lett. 2022, 22, 22–28. 10.1021/acs.nanolett.1c02835. [DOI] [PubMed] [Google Scholar]
- Zundel L.; Cuartero-González A.; Sanders S.; Fernández-Domínguez A. I.; Manjavacas A. Green tensor analysis of lattice resonances in periodic arrays of nanoparticles. ACS Photonics 2022, 9, 540–550. 10.1021/acsphotonics.1c01463. [DOI] [Google Scholar]
- Väkeväinen A. I.; Moerland R. J.; Rekola H. T.; Eskelinen A.-P.; Martikainen J.-P.; Kim D.-H.; Törmä P. Plasmonic surface lattice resonances at the strong coupling regime. Nano Lett. 2014, 14, 1721–1727. 10.1021/nl4035219. [DOI] [PubMed] [Google Scholar]
- Rodriguez S. R. K.; Feist J.; Verschuuren M. A.; Garcia Vidal F. J.; Gómez Rivas J. Thermalization and cooling of plasmon-exciton polaritons: towards quantum condensation. Phys. Rev. Lett. 2013, 111, 166802. 10.1103/PhysRevLett.111.166802. [DOI] [PubMed] [Google Scholar]
- Ramezani M.; Halpin A.; Fernández-Domínguez A. I.; Feist J.; Rodriguez S. R.-K.; Garcia-Vidal F. J.; Gómez Rivas J. Plasmon-exciton-polariton lasing. Optica 2017, 4, 31–37. 10.1364/OPTICA.4.000031. [DOI] [Google Scholar]
- Hakala T. K.; Moilanen A. J.; Väkeväinen A. I.; Guo R.; Martikainen J.-P.; Daskalakis K. S.; Rekola H. T.; Julku A.; Törmä P. Bose–Einstein condensation in a plasmonic lattice. Nat. Phys. 2018, 14, 739–744. 10.1038/s41567-018-0109-9. [DOI] [Google Scholar]
- Jackson J. D.Classical Electrodynamics; Wiley: New York, 1975. [Google Scholar]
- Novotny L.; Hecht B.. Principles of Nano-Optics; Cambridge University Press: New York, 2006. [Google Scholar]
- Teperik T. V.; Degiron A. Design strategies to tailor the narrow plasmon-photonic resonances in arrays of metallic nanoparticles. Phys. Rev. B 2012, 86, 245425. 10.1103/PhysRevB.86.245425. [DOI] [Google Scholar]
- Kolkowski R.; Koenderink A. F. Lattice resonances in optical metasurfaces with gain and loss. Proc. IEEE 2019, 108 (5), 795–818. 10.1109/JPROC.2019.2939396. [DOI] [Google Scholar]
- Zundel L.; Manjavacas A. Finite-size effects on periodic arrays of nanostructures. J. Phys.: Photonics 2019, 1 (1), 015004. 10.1088/2515-7647/aae8a2. [DOI] [Google Scholar]
- García de Abajo F. J. Multiple scattering of radiation in clusters of dielectrics. Phys. Rev. B 1999, 60, 6086–6102. 10.1103/PhysRevB.60.6086. [DOI] [Google Scholar]
- Yang H. U.; D’Archangel J.; Sundheimer M. L.; Tucker E.; Boreman G. D.; Raschke M. B. Optical dielectric function of silver. Phys. Rev. B 2015, 91, 235137. 10.1103/PhysRevB.91.235137. [DOI] [Google Scholar]
- Rodriguez S. R. K.; Schaafsma M. C.; Berrier A.; Gómez-Rivas J. Collective resonances in plasmonic crystals: Size matters. Physica B 2012, 407, 4081–4085. 10.1016/j.physb.2012.03.053. [DOI] [Google Scholar]
- Zakomirnyi V. I.; Ershov A. E.; Gerasimov V. S.; Karpov S. V.; Ågren H.; Rasskazov I. L. Collective lattice resonances in arrays of dielectric nanoparticles: a matter of size. Opt. Lett. 2019, 44, 5743–5746. 10.1364/OL.44.005743. [DOI] [PubMed] [Google Scholar]
- Kostyukov A. S.; Rasskazov I. L.; Gerasimov V. S.; Polyutov S. P.; Karpov S. V.; Ershov A. E. Multipolar lattice resonances in plasmonic finite-size metasurfaces. Photonics 2021, 8, 109. 10.3390/photonics8040109. [DOI] [Google Scholar]
- Humphrey A. D.; Barnes W. L. Plasmonic surface lattice resonances on arrays of different lattice symmetry. Phys. Rev. B 2014, 90, 075404. 10.1103/PhysRevB.90.075404. [DOI] [Google Scholar]
- Lunnemann P.; Koenderink A. F. Dispersion of guided modes in two-dimensional split ring lattices. Phys. Rev. B 2014, 90, 245416. 10.1103/PhysRevB.90.245416. [DOI] [Google Scholar]
- Li R.; Bourgeois M. R.; Cherqui C.; Guan J.; Wang D.; Hu J.; Schaller R. D.; Schatz G. C.; Odom T. W. Hierarchical hybridization in plasmonic honeycomb lattices. Nano Lett. 2019, 19, 6435–6441. 10.1021/acs.nanolett.9b02661. [DOI] [PubMed] [Google Scholar]
- Warren A.; Alkaisi M. M.; Moore C. P. Subradiant resonances in Au and Ag bipartite lattices in the visible spectrum. J. Vac. Sci. Technol. 2021, 39, 063601. 10.1116/6.0001270. [DOI] [Google Scholar]
- Movsesyan A.; Besteiro L. V.; Kong X.-T.; Wang Z.; Govorov A. O. Engineering strongly chiral plasmonic lattices with achiral unit cells for sensing and photodetection. Adv. Opt. Mater. 2021, 10 (14), 2101943. 10.1002/adom.202101943. [DOI] [Google Scholar]
- Ciarella L.; Tognazzi A.; Mangini F.; De Angelis C.; Pattelli L.; Frezza F. Finite-size and illumination conditions effects in all-dielectric metasurfaces. Electronics 2022, 11, 1017. 10.3390/electronics11071017. [DOI] [Google Scholar]
- Bettles R. J.; Gardiner S. A.; Adams C. S. Enhanced optical cross section via collective coupling of atomic dipoles in a 2D array. Phys. Rev. Lett. 2016, 116, 103602. 10.1103/PhysRevLett.116.103602. [DOI] [PubMed] [Google Scholar]
- Shahmoon E.; Wild D. S.; Lukin M. D.; Yelin S. F. Cooperative resonances in light scattering from two-dimensional atomic arrays. Phys. Rev. Lett. 2017, 118, 113601. 10.1103/PhysRevLett.118.113601. [DOI] [PubMed] [Google Scholar]
- Rui J.; Wei D.; Rubio-Abadal A.; Hollerith S.; Zeiher J.; Stamper-Kurn D. M.; Gross C.; Bloch I. A subradiant optical mirror formed by a single structured atomic layer. Nature 2020, 583, 369–374. 10.1038/s41586-020-2463-x. [DOI] [PubMed] [Google Scholar]
Associated Data
This section collects any data citations, data availability statements, or supplementary materials included in this article.