

Abstract

Analytical capabilities in atmospheric chemistry provide new opportunities to investigate indoor air. HOMEChem was a chemically comprehensive indoor field campaign designed to investigate how common activities, such as cooking and cleaning, impacted indoor air in a test home. We combined gas-phase chemical data of all compounds, excluding those with concentrations <1 ppt, with established databases of health effect thresholds to evaluate potential risks associated with gas-phase air contaminants and indoor activities. The chemical composition of indoor air is distinct from outdoor air, with gaseous compounds present at higher levels and greater diversity—and thus greater predicted hazard quotients—indoors than outdoors. Common household activities like cooking and cleaning induce rapid changes in indoor air composition, raising levels of multiple compounds with high risk quotients. The HOMEChem data highlight how strongly human activities influence the air we breathe in the built environment, increasing the health risk associated with exposure to air contaminants.
Keywords: indoor air, air pollution, atmospheric chemistry, health risk assessment, household activities
Short abstract
Air pollution indoors is always present and can increase during household activities such as cleaning and cooking. Many of these pollutants are known or suspected air toxics.
1. Introduction
People in the United States spend ∼90% of their time indoors and ∼63% in their own homes.1 Built environments are sources of chemical air contaminants, some of which are hazardous or linked with negative health outcomes.2 Inhalation of gaseous compounds is an important exposure source for volatile and semivolatile pollutants.3,4 Gas-phase components of indoor air have diverse sources including release from building materials,5−7 use of personal care products and other volatile chemical products,8,9 occupant activities like cooking and cleaning,10,11 and secondary chemistry occurring on building surfaces or via gas-phase oxidation reactions.12−16 Building materials and furnishings of residences emit known air toxics such as phthalate esters, formaldehyde, and acrolein,17−20 while cleaning with bleach releases chlorine gas, particles and additional air toxics.11,13 However, the health impacts of these individual compounds, let alone the complex mixtures present in indoor environments, on both short (minutes to days) and long (months to years) timescales are poorly understood.21
Indoor environmental stressors like noise and air quality influence patterns of illness, wellbeing, and adverse health endpoints among diverse populations.22 Air quality stressors include particle- and gas-phase pollutants. While particle number and mass are often measured indoors, particle composition and gas-phase species are more challenging to comprehensively measure due to their diverse functionality.23 High time-resolution measurements of particle composition and volatile organic compounds (VOCs) are thus relatively rare.24
Risk assessments consider composition, frequency, intensity, and duration of identified compounds. Such indoor data for most compounds are lacking beyond simple gases (e.g., CO, CO2) and a few well-established air toxics (e.g., formaldehyde, benzene). Indoor sources operate on multiple timescales, presenting another barrier to quantifying potential exposure and associated health risks. Some sources, such as household materials, emit continuously and thus vary on long (weeks to months) timescales.25 Other sources, such as cooking or cleaning, can be intense but short (minutes to hours).26,27 Human activity patterns further complicate exposure calculations as activities may be either sporadic (e.g., cleaning) or repeated on weekly, daily, or sub-daily timescales (e.g., cooking). These varying timescales, coupled with multiple sources for individual contaminants, challenge traditional approaches to classifying health risks by acute, short-term, or chronic exposure to individual compounds.3
Indoor airborne contaminants are numerous and diverse in residences.28−31 Current data is insufficient to prioritize and allocate resources to hazard and risk reduction efforts. Atmospheric chemists can now quantify a vast number of compounds and at high time resolution,32 but these advances are rarely applied to indoor air health assessments for occupational settings.33 Here, we directly apply advanced instrumentation with both high chemical and time resolution for a health assessment in a residential setting.
Few indoor studies are chemically comprehensive. Large-scale projects like OFFICAIR and RIOPA measured compounds in multiple buildings or homes, but only for 12 and 18 VOCs, respectively.34,35 Test house, classroom, and building measurements with more comprehensive chemical measurements25,36−50 have, for example, shown how chemical transformations of cigarette smoke on fabric and building surfaces induce particle/gas/surface repartitioning through ‘third hand cigarette smoke.51−53 Price et al.50 noted higher levels of VOCs and total reactivity inside an art gallery than outdoor air. Despite these advances, chemically comprehensive indoor datasets have not yet been applied to quantifying human exposure or identifying indoor air hazards. Such an assessment is essential because indoor air is so chemically different from outdoor air that exposure is likely dominated by different air toxics.25,50,54 Identifying which compounds are the greatest hazards is the first step in assessing risks associated with indoor air and identifying targets for reduction efforts.
We use data from the House Observations of Microbial and Environmental Chemistry (HOMEChem) study to investigate how different gas-phase compounds contribute to potential exposure risk during different indoor activities. First, we use the gas-phase data to quantify total levels and chemical diversity of air contaminants. Second, we develop a hybrid approach to classify gas-phase compounds with respect to hazard indices using databases of known air toxics and predicted human health effects. Third, we apply this hybrid approach to HOMEChem data to identify and contrast key air contaminants of concern in indoor versus outdoor air and during different indoor activities. While HOMEChem investigated only one house, it provides an unprecedented dataset (Table S1) to study chemical diversity and concentrations in indoor residential air, allowing us to probe how indoor air and different household activities may impact human inhalation exposure.
2. Methods
2.1. HOMEChem
HOMEChem investigated how everyday residential activities impact indoor air.26 HOMEChem included comprehensive chemical measurements of gases, particles, and building metrics in the UTest House at the University of Texas, Austin in June 2018. Cooking activities followed scripted recipes and included repeated vegetarian stir-fries; beef chili; and hot breakfast of eggs, toast, and sausage. Cleaning activities included mopping with bleach, pine-scented, or ‘natural’ products, mixed to manufacturer specifications. Unoccupied house conditions provide a proxy for exposure in the absence of indoor activities. However, humans are emission sources through both biochemistry55 and personal care product usage56 and the unoccupied baseline neglects these human emissions. We periodically ran an ozone generator in the house air supply closet, which increased indoor ozone to 30 ppb from the 5–15 ppb observed when windows and doors were closed.26 These ozone additions allow us to examine potential effects of infiltration of pollution or use of products that generate ozone either deliberately or accidentally.
Gas-phase measurements included >300 unique compounds in both outdoor and indoor air using on-line mass spectrometry, spectroscopy, and chromatography instruments (Table S2). All inlets were in the kitchen. All systems report mixing ratios by volume. We refer to actual HOMEChem observations as mixing ratios or levels but use the term concentration for more general discussions (e.g., concentrations of compounds during activities). We further only consider compounds with levels >1 ppt (part per trillion), as all of the published threshold concentrations we compare the data to are at least 100 ppt (Section 2.2).
We limit this analysis to on-line, real-time measurements. We exclude CO, CO2, and CH4 as the toxicity of these compounds in indoor environments has been extensively characterized57−59 but include their concentrations in Table S1. Data from each instrument was rigorously evaluated for quality and calibrated following instrument-specific procedures (Table S3, SI S2, other publications11−13,26,54).
2.2. Hybrid Classification Approach
To classify known, suspected, or unknown air toxics, we developed a hybrid classification approach to separate molecules into three categories: (i) known air toxics, as identified on the Hazardous Air Pollutants (HAPs) list maintained by the U.S. Environmental Protection Agency (EPA) and the air toxics database maintained by California’s EPA Office of Environmental Health Hazard Assessment (OEHHA), (ii) molecules anticipated to be toxic based on the EPA Toxicity Estimation Software Tool (T.E.S.T.) quantitative structure activity relationship model,60 using the developmental toxicity and Ames mutagenicity toxicity endpoints (SI details HAPs/OEHHA lists, T.E.S.T. model, and toxicity endpoints), and (iii) chemical air contaminants not identified in the HAPs/OEHHA lists or T.E.S.T. predictions (Table S1). This third category includes unlisted compounds. Some unlisted compounds, including dibromomethane, propanethiol, and methanethiol, are identified as air toxics by the National Institute for Occupational Safety and Health or other databases. In contrast to previous indoor and outdoor contaminant exposure studies that identified hazardous or potentially hazardous species,2 we combine targeted and untargeted analyses to provide a more comprehensive and activity-resolved approach.
To relate measured concentrations of a diverse range of gas-phase compounds to potential exposure risk, we considered three aspects: (1) the number of compounds present (chemical diversity) by classifying compounds in two ways: their potential health hazard using the hybrid classification approach (e.g., known, potential, and unlisted air toxics), and by elemental composition (e.g., compounds containing C, H, and O atoms versus C, H, O, and Cl); (2) the mixing ratio (level) of each compound; and (3) the anticipated time period of exposure.
Sorting compounds by mixing ratio provides a metric for the number of molecules an individual is potentially exposed to in each chemical air contaminant category (i.e., “exposure potential”). We consider mixing ratios present during activities, outside, and during house background conditions, as well as enhancement ratios in levels above the initial house background air conditions. We calculate enhancements as the ratio of the mean levels observed for the 60 min period after the start of the activity, encompassing the activity (typically 15–30 min) and time afterward during which levels remain elevated, to the mean levels observed 60 min before the start of the activity. For compounds uniquely emitted during the activity, we calculate enhancements relative to the initial concentration of the compound, and present data for enhancement ratios of1.1, 3, and 10.
To investigate which individual compounds are most likely to influence health for anticipated time periods of exposure, we use the databases of known air toxics to calculate acute, chronic, and chronic-weighted hazard quotients. Hazard quotients are the ratio of the observed concentration of a species divided by its threshold concentration,61 or concentration below which adverse (non-cancer) effects are unlikely to occur. Adverse (non-cancer) effects are unlikely to occur for air toxics with hazard quotients ≤1. We consider acute hazard quotients as exposure over 1 h, chronic hazard quotients as exposure over a lifetime, and chronic-weighted hazard quotients as exposure over a lifetime weighted by the time anticipated spent upon that activity or location (SI S7). Finally, we compare HOMEChem data to cancer threshold concentrations or concentrations of a carcinogenic compound that result in 1 excess lifetime tumor per 1 million people. Any exposure to a carcinogen can result in an increased chance of getting cancer, and cancer risks here are not considered against acute versus chronic exposures.
This hybrid classification system is a straightforward method to sort through a comprehensive and quantitative dataset to identify potential air contaminants. The use of calibrated, quantitative concentration measurements contrasts with the qualitative non-targeted analysis frequently used in pollutant screening.62 This framework could be applied to other air toxics databases or predictive models and may be useful for other indoor or outdoor studies. While the exact mixtures, concentrations, and time periods of exposure to chemical air contaminants vary by day and home, our approach considers how different activities or mitigation strategies can impact indoor air.
This analysis assumes that input data are reasonably complete and that instrument uncertainties are smaller than experimental variance. We calculated the relative standard deviation of replicate experiments (e.g., repeated mopping) for a given compound and find variations of up to hundreds of percent, while instrument uncertainties were ≪100% (Table 1).
Health effects can be non-linear with exposure, meaning that hazard quotients >1 do not necessarily indicate correspondingly greater probabilities of adverse effects.61 Additional challenges with hazard quotients include the choice of database (OEHHA versus HAPs), consideration of only single pollutants in toxicity rather than complex mixtures, assumption that short events (e.g., cooking) should be treated acute exposures even if commonly repeated, and lack of established thresholds in T.E.S.T. and thus exclusion of predicted (but not known) toxics from analyses.
3. Results and Discussion
3.1. Chemical Diversity, Levels, and Indoor Activities
Three consistent patterns emerge when simultaneously considering chemical air contaminant diversity (i.e., total number of compounds; Figure 1) and total (summed) chemical air contaminant levels (Figure 2 and Figure S1) at HOMEChem: (1) outdoor air at the HOMEChem site is less chemically diverse and has lower concentrations of measured compounds than indoor air, (2) all indoor activities increase chemical diversity of indoor air, and (3) cooking elevates indoor concentrations of trace gas compounds more than any other activity. Known air toxics are only a small fraction of the compounds observed during HOMEChem, but a substantial fraction of the total level of compounds predicted to have toxicity.
Figure 1.

Chemical diversity (number of compounds) measured during HOMEChem, sorted by elemental composition. We only show compounds observed at mixing ratios >1 ppt. Each pie label indicates the activity or condition. The number (#) above each pie label indicates the total number of species quantified under the stated condition. Numerical percentage breakdowns of each category by compound number are in Table S4. The pie radii are relative to bleach, the activity with the greatest number of quantified compounds. The chemical classes are Cl = compounds containing 1 or more chlorine atoms, N = compounds containing 1 or more nitrogen atoms, S = compounds containing 1 or more sulfur atoms, Si = compounds containing 1 or more silicon atoms, CH = compounds composed of only carbon and hydrogen atoms (hydrocarbons), CHO = compounds composed of only carbon, hydrogen, and oxygen atoms (oxygenated organics), and Ox/Rad = O3, OH, HO2. Each compound is assigned to only one class in this figure.
Figure 2.
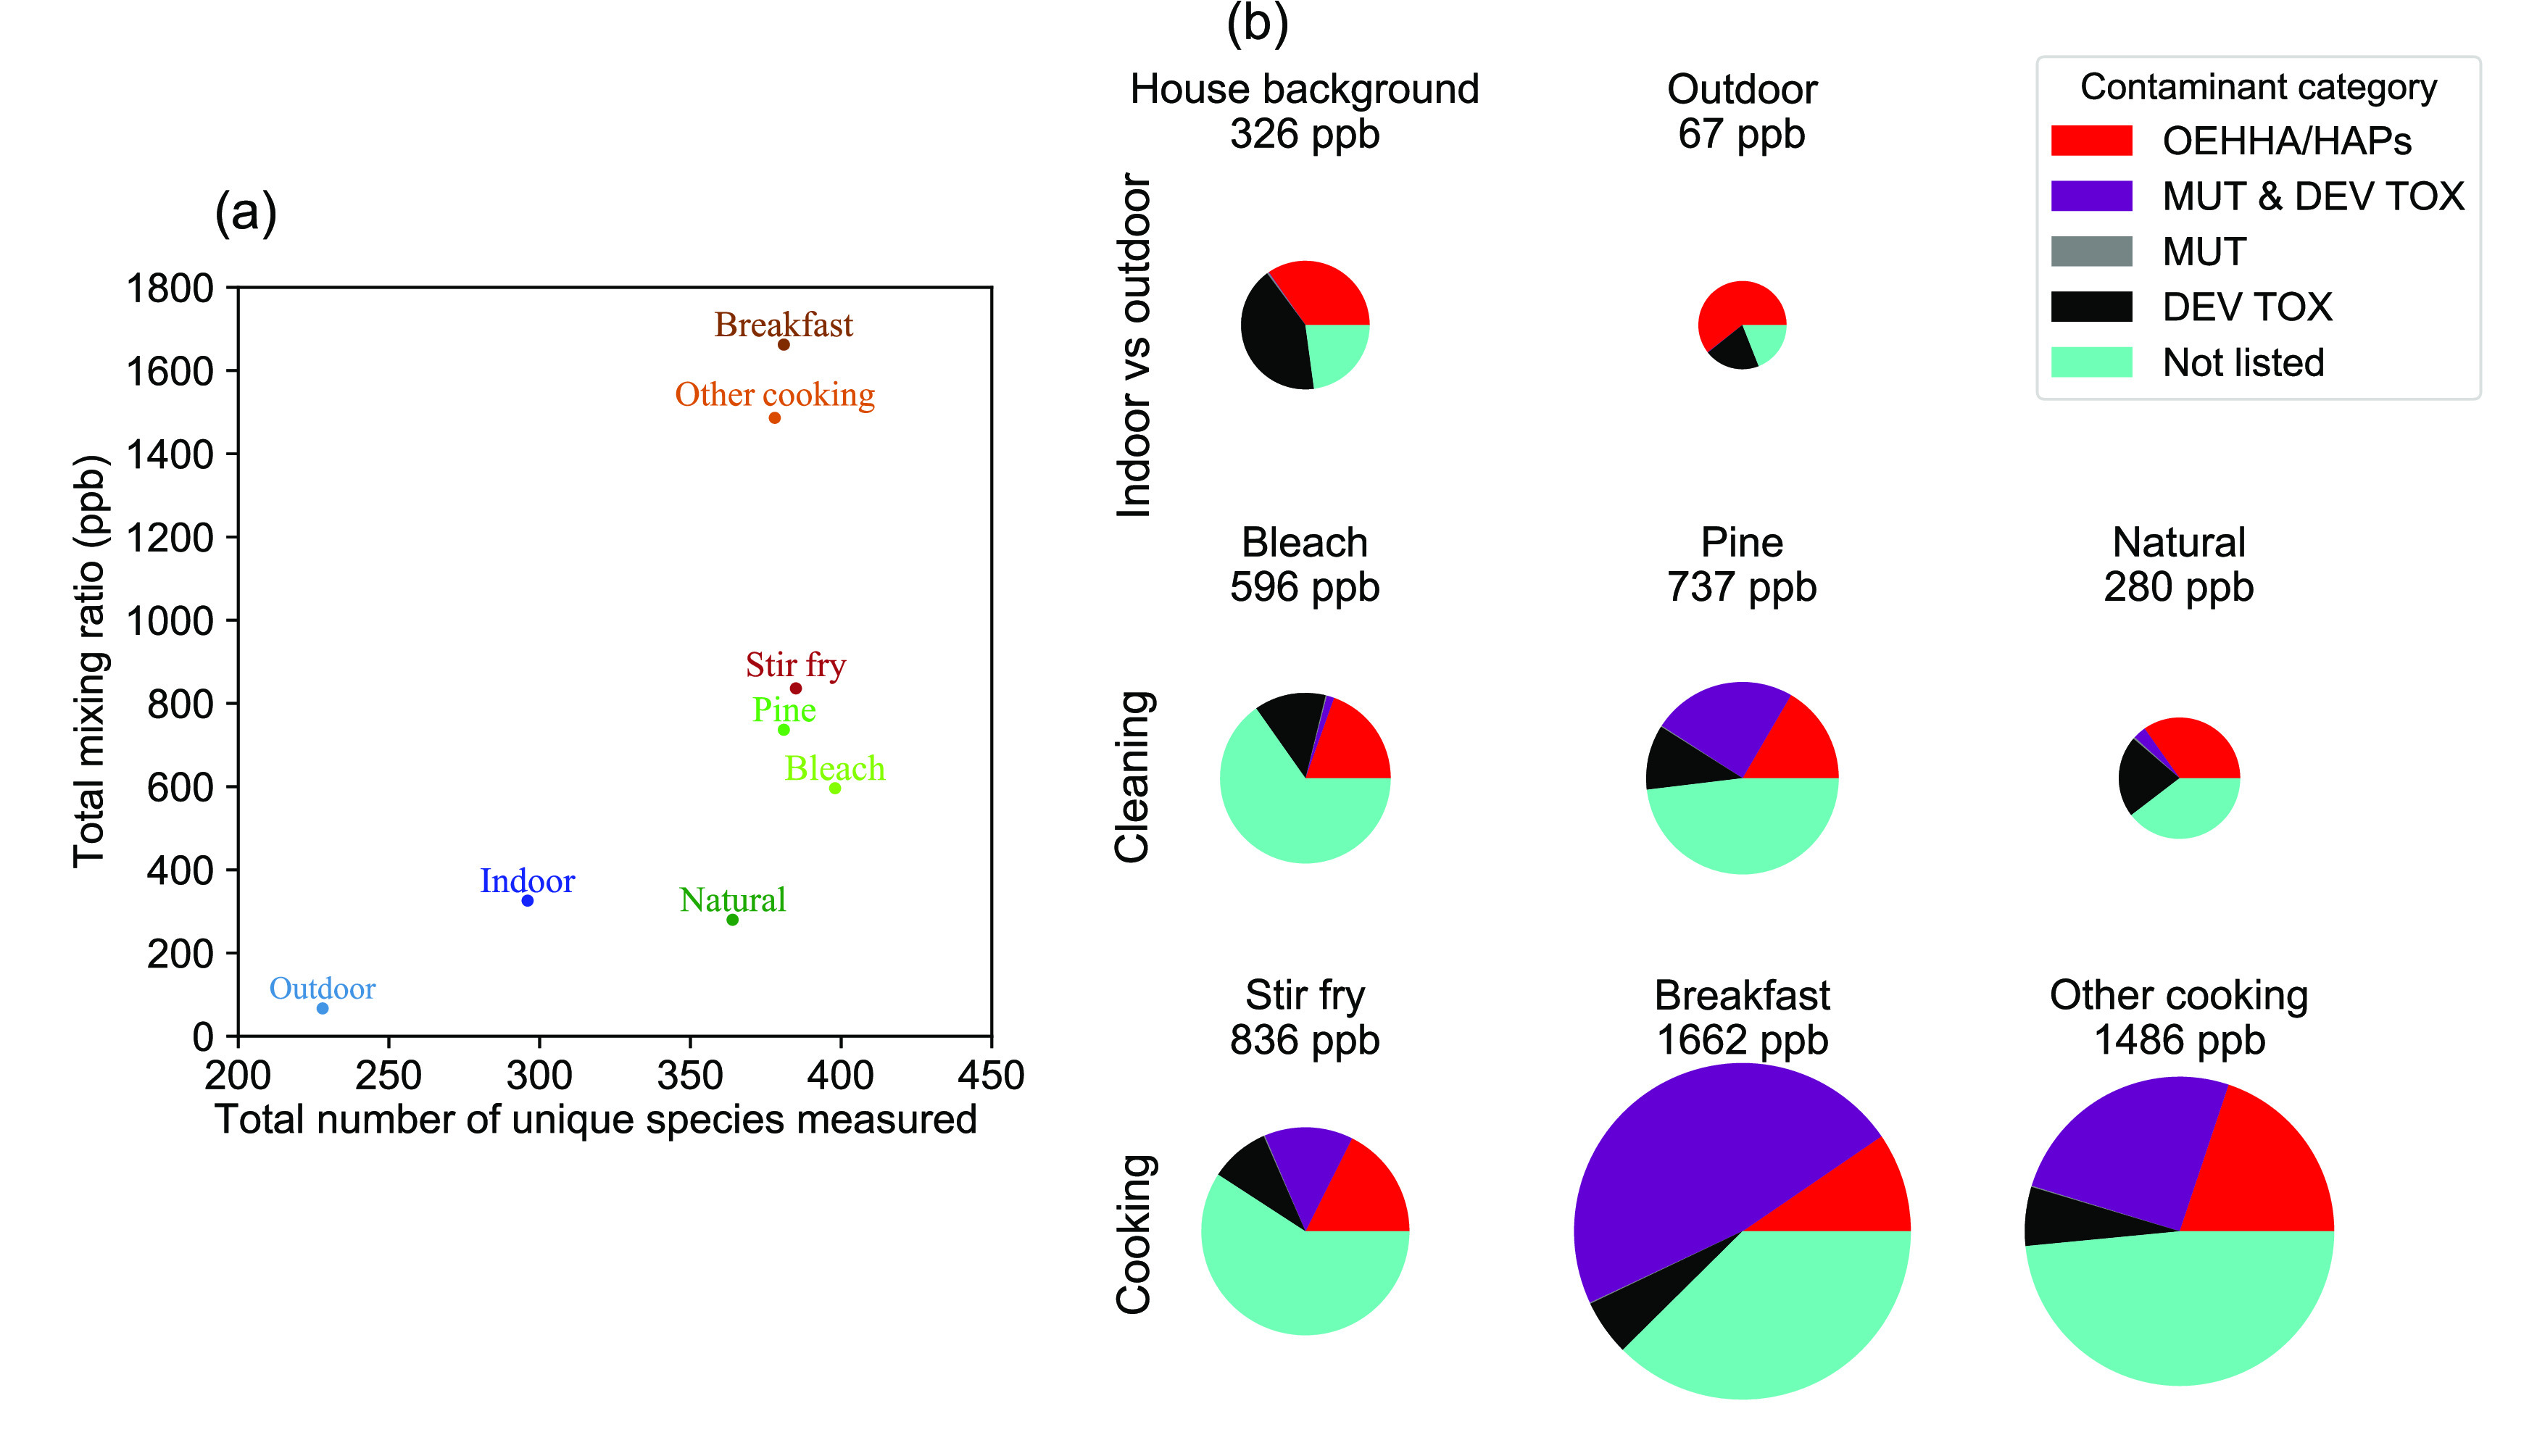
(a) Scatter plot of the total concentrations in ppb present of all measured compounds versus the total number of compounds present during each activity or condition. (b) Contributions to pollutant concentrations by chemical air contaminant category. We only include compounds present at mixing ratios >1 ppt. Numerical percentage breakdowns of each category by mixing ratio is listed in Table S4. Pie radii are relative to the highest total levels (breakfast). The chemical air contaminant categories are OEHHA/HAPs = identified as an air toxic within the OEHHA and/or HAPs databases, MUT & DEV TOX = compounds identified in the T.E.S.T. model to be both potentially mutagenic (MUT) and to potentially cause developmental toxicity (DEV TOX), MUT = compounds identified in the T.E.S.T. model to be only potentially mutagenic, DEV TOX = compounds identified in the T.E.S.T. model to only potentially cause developmental toxicity, and Not listed = compounds not listed in the OEHHA, HAPs, or T.E.S.T. model to be a known or potential air toxic. Panel (b) is replotted in Figure S3 with equal pie radii for ease of visual comparison between pie sections. Each compound is assigned to only one class in this figure. Concentrations have been calculated using the centroid of each data point; while the true concentrations may vary, the trends shown are not anticipated to change.
We observe more compounds and at higher levels in indoor air than outdoor air during HOMEChem (Figures 1 and 2). HOMEChem took place in a major U.S. city and near multiple highways. The relative distributions of compounds by class were similar, regardless of activity type (Figure 1 and Table S4) – likely because instruments were so sensitive and house emissions so strong that detectable compounds were typically above detection limits indoors, even during unoccupied periods. Unlike chemical diversity, levels of individual compounds were impacted by location (indoors versus outdoors) and activities (Figure S1 and Table S4). Levels of chemical air contaminants are consistently higher indoors than outdoors, and indoor activities increase total indoor levels by up to 4-fold. Distributions of each chemical air contaminant category by number are also remarkably similar between indoor and outdoor air, regardless of activity (Figure S2), while the distributions are dissimilar by mixing ratio space (Figure 2 and Figure S3). Outdoor air has substantially lower levels of chemical air contaminants and less chemical diversity than even the house background air (Figure 2a,b). Cleaning and cooking are strong sources of chemical air contaminants to indoor environments.
Outdoor air has the lowest total mixing ratio of measured trace gases but also the highest percentage of levels that are identified in the OEHHA/HAPs databases (61%) of all locations and activities examined. This greater proportion of compounds with established health effects may be, in part, influenced by the fact that inclusion in these databases prioritizes compounds measured in ambient air at Superfund sites. Another 20% of the total mixing ratio of compounds measured outdoors is predicted by T.E.S.T. to have developmental toxicity. The house background air contains substantially higher total trace gas levels (326 vs 67 ppb) than outdoor air, along with a smaller fraction (35%) of established OEHHA/HAPs and a larger fraction (45%) of total trace gas levels predicted to have developmental toxicity. This large fraction of trace gas levels predicted to have developmental toxicity highlights the need for investigating the extent to which compounds predicted to have toxicity by T.E.S.T. poses health risks at real-world exposure levels.
Residential activities not only increased the total number and level of chemical air contaminants but also the total number and levels of compounds with potential toxicity. For cooking and cleaning, 30–65% of compounds by level are known or potential air toxics. Bleach mopping has the highest fraction of the total level of compounds in the ‘not listed’ category (65%), while the HOMEChem breakfast (eggs, sausage, toast, tomato, coffee) has the highest level of compounds predicted to have mutagenicity, developmental toxicity, or both (53%). However, we emphasize uncertainties of predictive abilities (false negatives) and the limited health endpoints in the T.E.S.T. model: molecules that are ‘not listed’ by this model or the OEHHA/HAPs databases may still have negative health consequences, including those beyond developmental toxicity and mutagenicity. For example, isocyanic acid (HNCO) can undergo carbamoylation reactions, which are linked with cardiovascular disease, rheumatoid arthritis, and cataracts.63 However, HNCO is not listed in either database nor identified within the endpoints of the T.E.S.T. model (mutagenicity, developmental toxicity). Bleach mopping releases many oxygenated and chlorinated organic compounds that are not in the T.E.S.T. model but warrant further study regarding negative health effects outside of the T.E.S.T. endpoints.
3.2. Hazard Quotients
Few molecules measured indoors during HOMEChem exceed acute, chronic, or chronic-weighted limits, and no molecules measured outdoors exceed any limits (Figure 3, Figure S4, and Table S1). Long-term exposure to house background air is generally considered a chronic exposure, but short-term increases represent acute or short-term exposures. Acute and chronic exposure to the same compound can have different health outcomes. Acrolein and formaldehyde have both a chronic contribution from the house background air and an acute contribution from specific short-term indoor activities. One approach to parsing exposure time is weighting exposure by time spent in each activity/location. Figure 3 presents ‘chronic-weighted’ hazard quotients based on HOMEChem layered days, which included cooking three meals and cleaning. No compound’s level exceeded a chronic-weighted hazard quotient of one, emphasizing that while cooking and cleaning can release known air toxics, it is indoor air in the absence of activities that dominates chronic exposure risk due to the amount of time we spend indoors.
Figure 3.
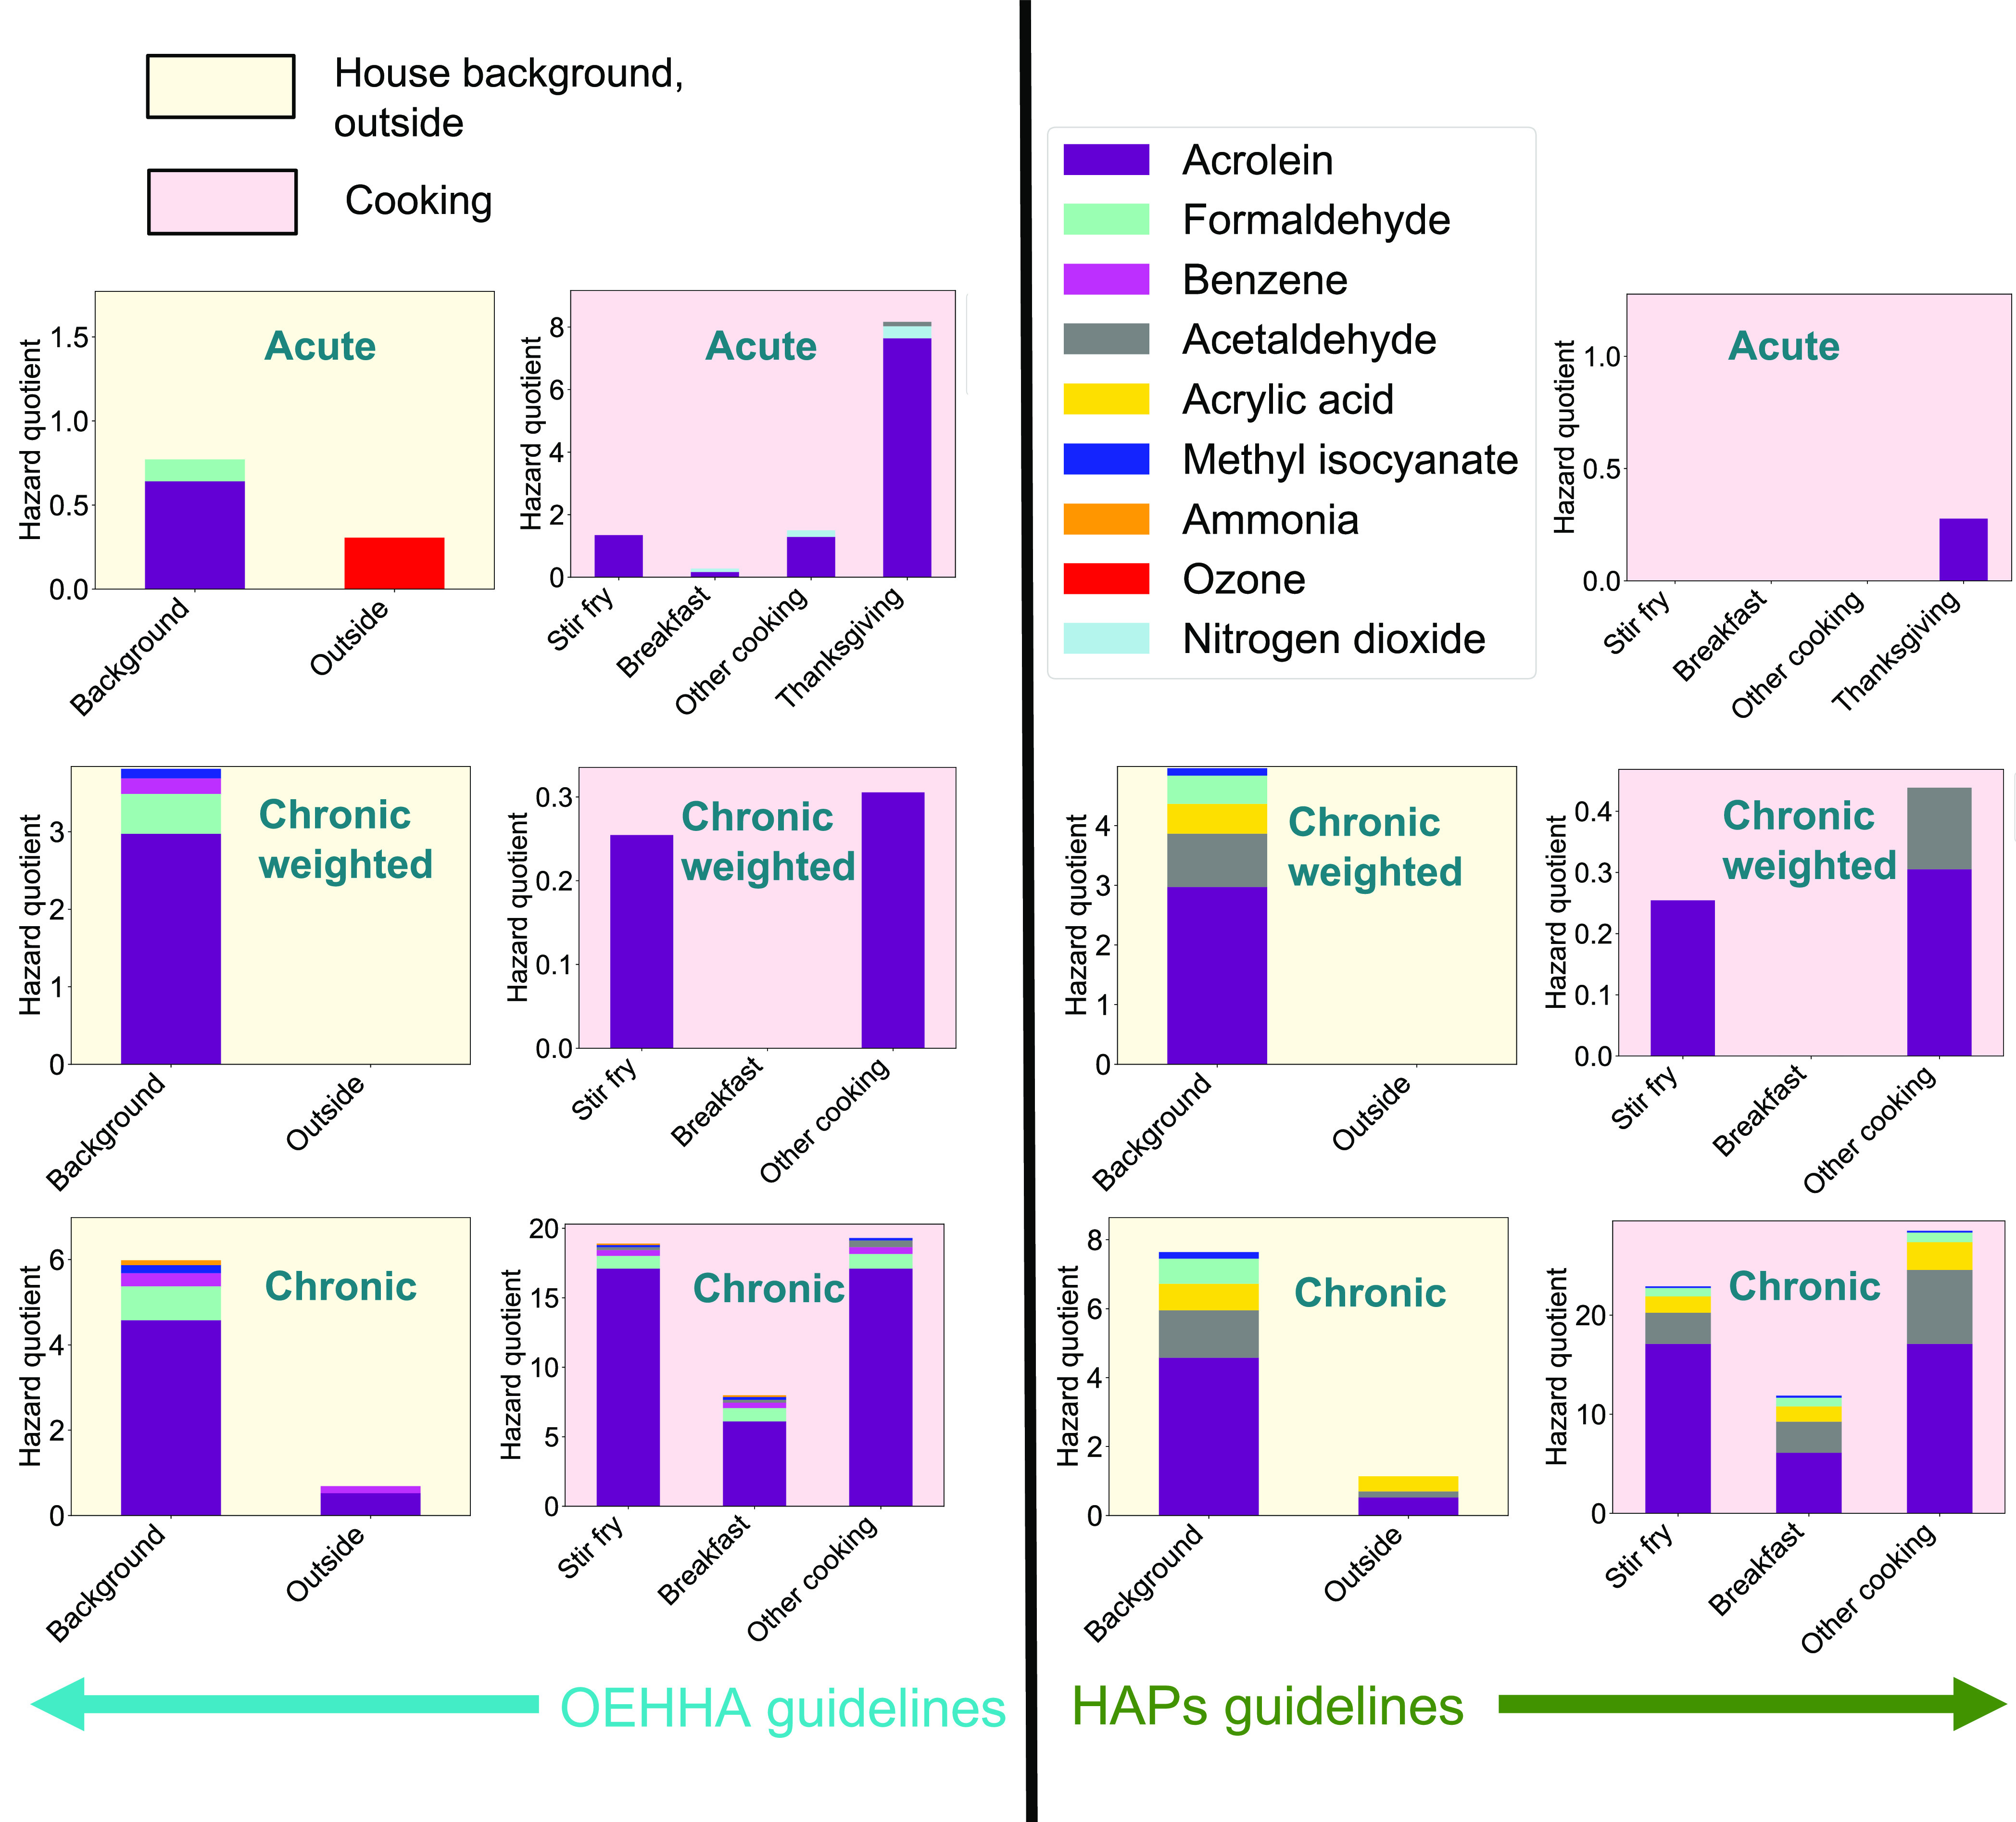
Median hazard quotients (ratio of observed concentration of a given species to a guideline threshold concentration for that species) for background and outdoor (first and third columns; light yellow figure backgrounds) and cooking (second and fourth columns; light red figure backgrounds) activities at HOMEChem. We show acute (1 h exposure; top row), chronic-weighted (lifetime exposure multiplied by the fraction of time spent upon that activity or location (e.g., indoors with no activities, the “House background”; middle row; see Methods & Materials for calculations) and chronic (lifetime exposure; bottom row) hazard quotients. We compare hazard quotients obtained from the OEHHA (left side) versus HAPs guidelines (right side). We only show hazard quotients >0.1 here. Table S1 lists hazard quotients for other compounds identified within the OEHHA and/or HAPs guidelines and observed during HOMEChem.
Our hazard quotient analysis identifies seven known air toxics of concern during HOMEChem: acrolein, acrylic acid, formaldehyde, acetaldehyde, acetamide, acrylonitrile, and benzene (Figures 3 and 4). Acrolein, a pulmonary toxicant emitted by lumber and heating of fats,5,20 has the highest chronic, chronic-weighted, and acute hazard quotients in both house background and cooking, often >1. No compounds are near an acute hazard quotient of one during mopping with bleach, pine, or natural products, although emissions of molecular chlorine (Cl2) from bleach mopping are substantial and would result in hazard quotients ≫1 if considered against chronic thresholds (Figure S4). Other compounds with hazard quotients over or near one for house background air and cooking included acetaldehyde, formaldehyde, and acrylic acid. Potential instrument interferences cause formaldehyde hazard quotients to represent lower bounds during HOMEChem (SI S2).
Figure 4.

Predicted number of tumors per 1 million people exposed for (a) background and outdoor and (b) cooking activities at HOMEChem for the OEHHA threshold concentrations, assuming a chronic exposure. The inset figure in (a) shows chronic-weighted tumor calculations for the background and outside. The HAPs guideline predictions are shown in Figure S5. We only show species predicted to cause one or more tumors per 1 million people exposed here, with the full list of possible carcinogens and number of tumors predicted for other compounds identified within the OEHHA and/or HAPs guidelines and observed during HOMEChem listed in Table S1. No compound exceeds a chronic-weighted tumor risk of 1 for the outside or any cooking activity.
Using the OEHHA/HAPs databases, we find elevated tumor risks for formaldehyde, acetaldehyde, acetamide, acrylonitrile, and benzene (Figure 4a,b and Figure S5; Table S1). Understanding risk from intermittent exposures such as cooking remains limited and may be mediated by subclinical effects.64−66 To compare different cooking activities, we calculate cancer risk based on the same fixed exposure timeframe (continuous lifetime). Time-weighted (chronic-weighted) risk estimates show the relative contribution to cancer risk from continuous background exposures vs intermittent activities (Figure 4a and Figure S5a). No compounds exceed a chronic-weighted risk of 1 tumor per 1 million exposed for the outdoor or cooking activities. For comparison, risks from indoor exposure to radon at the 4 pCi/L remediation action level are 7300 per million;67 risks from secondhand and thirdhand smoke exposure indoors range 1–4100 per million68−70 and indoor risks from benzene exposure for nonsmoking adults in Hong Kong were > 18 per million.71 We do not include uncertainty in our hazard quotient and tumor risk calculations, but such analyses are unlikely to change which compounds have elevated risks.
We compare HOMEChem results with Logue et al.2 who provide the most comprehensive review to date of air toxics for residences in the U.S. and countries that lead similar lifestyles. Logue et al.2 identified nine priority hazards including five gas-phase pollutants that we also measured at HOMEChem: acetaldehyde, acrolein, benzene, formaldehyde, and NO2.2 We observed these five priority pollutants at HOMEChem at similar background concentrations (SI S8).2 During HOMEChem, NO2 did not exceed a hazard quotient of 1 but may be higher in other homes due to gas stoves or other combustion sources. Our findings of additional compounds of interest beyond Logue (acrylic acid, acetamide, acrylonitrile) highlight the utility of comprehensive measurements – and the potential diversity in indoor environments across the U.S.. Finally, particulate matter (PM) is another key indoor air pollutant72 and should be also considered in exposure analyses.73,74
3.3. Activity-Driven Contaminant Enhancements
The enhancement in chemical air contaminant levels observed during a given activity above initial house background air conditions highlights specific categories for further toxicology study (Figure 5 and Figures S6–S8; Table S3). All cooking and cleaning activities during HOMEChem perturb indoor air composition, increase chemical diversity, and increase the number of compounds classified as known or potential air pollutants. However, some activities cause greater enhancements in air concentration than others. Cleaning with natural or pine-based products only slightly enhances chemical diversity and levels of potentially toxic compounds, while cooking stir-fry substantially enhances both metrics (Figure 5 and Figures S6–S8). Bleach cleaning strongly (>1000%) enhances halogenated and nitrogen-containing compounds, although the majority (75–80%) of enhanced compounds during bleach cleaning are unlisted in terms of potential toxicity. Bleach cleaning involves secondary chemistry,11 highlighting the potential for indoor reactions to impact exposure.
Figure 5.

Chemical diversity of compounds for which concentrations increased by 300% (3×) or more during a given HOMEChem activity, categorized by chemical air contaminant (top) and elemental composition (bottom). Each pie radius is normalized by the maximum number of compounds observed per activity to be enhanced by at least 3 times. We calculate enhancements as the ratio to the mean levels observed for the 60 min period that encompasses the activity (which typically took 15–30 min) and time afterward during which levels remain elevated to the mean levels observed 60 min before the start of the activity. Table S4 includes numerical percentage breakdowns of each category by compound number. Figure S7 shows the same data with the pies not normalized for ease of visual comparison.
Infiltration of outdoor urban smog can also introduce ozone to homes,75 as does the use of chemical air cleaners, such as ozone and hydroxyl radical generators.76,77 We investigated the potential for human activities (e.g., use of ozone-generating “air purifier”, window opening during a smog event) that introduce primary oxidants to induce secondary chemistry with the addition of ozone to the house through the air handling system via the return vent. Ozone increases from ∼7 ppb before the generator is turned on to around 30 ppb near the end of the experiment (Figure S9). Figure 6 and Figure S9 summarize enhancements of air contaminants during ozone addition and show that (1) changes in chemical composition are rapid and occur on timescales of seconds to minutes and (2) levels of not only ozone but also numerous other gas-phase compounds increase substantially (30 + %). Ozone is a well-known air pollutant that causes inflammation in lungs and impacts the respiratory system, while the other compounds, including formaldehyde, are likely products of surface, particle, and gas-phase ozone reactions. Ten trace gases increased by >30% during the ozone generator experiment, seven of which are known (OEHHA/HAPs) or suspected (T.E.S.T.) air toxics. Nitric oxide (NO) decreased by at least 30% and is in the unlisted category. Ozone additions is well-established to induce indoor secondary chemistry.78 Many compounds that increased upon ozone addition are water-soluble and semivolatile and can thus be influenced by temperature (Figure 6) and relative humidity.
Figure 6.

Enhancement ratios (ratio of observed levels as a function of time to the mean level observed 1 h before the ozone generator was turned on) during an ozone generator experiment. Solid lines indicate compounds identified in the HAPs and/or OEHHA databases. Dot-dashed lines are compounds identified to have developmental toxicity and/or mutagenicity by the T.E.S.T. model (Table S1). Dashed lines are compounds that are not in the HAPs, OEHHA, or TEST databases as a known or predicted air toxic. This figure only shows compounds that increase or decrease by at least 30% during the ozone generator experiment. Air conditioning was turned off during this experiment; the right axis indicates the house temperature (C) increased by 3.4 °C.
Chemical air contaminants can undergo transformations in the indoor environment both on surfaces and in air, producing an array of secondary products that may be more or less toxic than the parent compound.51,79 The vast diversity and total mass present indoors during HOMEChem highlights the potential for health effects from indoor chemistry and warrants further study. Bleach mopping provides a compelling example (Figure S8), as multiphase chemistry substantially enhanced levels of suspected air toxics such as chloramines, methyl isocyanate, and cyanogen chloride.11,13
4. Implications
Indoor air has significantly higher levels of air contaminants than outdoor air. Chemical air contaminants present in homes can be more chemically diverse and have higher concentrations than outdoors, and different activities in the home can change chemical diversity of indoor air and indoor concentrations of known and possible air toxics. Traditional approaches to indoor environmental exposure assessment that time-average and time-integrate indoor concentrations are not designed to characterize exposures arising from indoor activities that dramatically and frequently, albeit briefly, elevate levels of specific compounds.
The stark chemical difference between indoor and outdoor air challenges the application of outdoor air quality metrics that prioritize ambient compounds found at National Priority Lists, such as EPA’s Air Quality Index, to indoor environments. While the Air Quality Index focuses on air pollutants such as ozone and NOx, our work suggests that organic compounds like acrolein may be more relevant and that complex halogenated or nitrogenated organic species warrant consideration. While HOMEChem focused on one home, the underlying concept that activities influence indoor air chemistry and thus exposure is broadly applicable to other environments, even as the composition and concentrations of indoor air contaminants change through emerging products, materials, and building technologies.
Disclaimer
The views expressed in this document are solely those of the authors and do not necessarily reflect those of the United States Environmental Protection Agency. The US EPA does not endorse any products or commercial services mentioned in this publication.
Acknowledgments
The Alfred P. Sloan Foundation funded this work (G-2020-13929, G-2017-9944, G-2019-11412, G-2019-11404). We thank Atila Novoselac, Steve Bourne, Serena Chung, Lauren Garofalo, Sheryl Magzamen, Matson Pothier, and Erin Boedicker, and the HOMEChem Science Team.
Supporting Information Available
The Supporting Information is available free of charge at https://pubs.acs.org/doi/10.1021/acs.est.2c01381.
Table S1: List of gas-phase compounds present at HOMEChem; Table S4: Percentage breakdowns of all pie charts presented in the main text and supporting information (XSLX)
Table S2: Measurements summary; Table S3; Instrument details summary; Figure S1; Contributions of compounds to total mixing ratios by chemical class; Figure S2: Contributions of compounds to number of compounds by chemical air contaminant category: Figure S3: Contributions of compounds to total mixing ratios by contaminant category; Figure S4: Acute and chronic median hazard quotients for the bleach, pine, and natural product mopping experiments at HOMEChem; Figure S5: Predicted number of tumors per 1 million people exposed; Figure S6: Chemical diversity of compounds; Figure S7: Chemical diversity of compounds for which concentrations increased by 300% (3×) or more during a given HOMEChem activity; Figure S8: Chemical diversity of compounds for which concentrations increased by 1000% (10×) or more during a given HOMEChem activity; Figure S9: Levels in ppbv of the first ozone generator experiment on June 24 (PDF)
Author Present Address
& Present address: School of Environmental Science and Engineering, Southern University of Science and Technology, Shenzhen, China 518055
Author Present Address
¶ Present address: Center for Environmental Measurement and Modeling, U.S. EPA, Research Triangle Park, North Carolina 27711, United States
Author Present Address
◆ Present address: Handix Scientific, Fort Collins, Colorado, 80525, United States
The authors declare no competing financial interest.
Supplementary Material
References
- Klepeis N. E.; Nelson W. C.; Ott W. R.; Robinson J. P.; Tsang A. M.; Switzer P.; Behar J. V.; Hern S. C.; Engelmann W. H. The National Human Activity Pattern Survey (NHAPS): A Resource for Assessing Exposure to Environmental Pollutants. J. Exposure Anal. Environ. Epidemiol. 2001, 11, 231–252. 10.1038/sj.jea.7500165. [DOI] [PubMed] [Google Scholar]
- Logue J. M.; Mckone T. E.; Sherman M. H.; Singer B. C. Hazard Assessment of Chemical Air Contaminants Measured in Residences. Indoor Air 2011, 21, 92–109. 10.1111/j.1600-0668.2010.00683.x. [DOI] [PubMed] [Google Scholar]
- Lunderberg D. M.; Misztal P. K.; Liu Y.; Arata C.; Tian Y.; Kristensen K.; Weber R. J.; Nazaroff W. W.; Goldstein A. H. High-Resolution Exposure Assessment for Volatile Organic Compounds in Two California Residences. Environ. Sci. Technol. 2021, 55, 6740–6751. 10.1021/acs.est.0c08304. [DOI] [PubMed] [Google Scholar]
- Li L.; Arnot J. A.; Wania F. How Are Humans Exposed to Organic Chemicals Released to Indoor Air?. Environ. Sci. Technol. 2019, 11276–11284. 10.1021/acs.est.9b02036. [DOI] [PubMed] [Google Scholar]
- Seaman V. Y.; Bennett D. H.; Cahill T. M. Indoor Acrolein Emission and Decay Rates Resulting from Domestic Cooking Events. Atmos. Environ. 2009, 43, 6199–6204. 10.1016/j.atmosenv.2009.08.043. [DOI] [Google Scholar]
- Blondel A.; Plaisance H. Screening of Formaldehyde Indoor Sources and Quantification of Their Emission Using a Passive Sampler. Build. Environ. 2011, 46, 1284–1291. 10.1016/j.buildenv.2010.12.011. [DOI] [Google Scholar]
- Salthammer T. Emission of Volatile Organic Compounds from Furniture Coatings. Indoor Air 1997, 7, 189–197. 10.1111/j.1600-0668.1997.t01-1-00004.x. [DOI] [Google Scholar]
- Yeoman A. M.; Shaw M.; Carslaw N.; Murrells T.; Passant N.; Lewis A. C. Simplified Speciation and Atmospheric Volatile Organic Compound Emission Rates from Non-Aerosol Personal Care Products. Indoor Air 2020, 30, 459–472. 10.1111/ina.12652. [DOI] [PMC free article] [PubMed] [Google Scholar]
- Nematollahi N.; Kolev S. D.; Steinemann A. Volatile Chemical Emissions from 134 Common Consumer Products. Air Qual. Atmos. Health 2019, 12, 1259–1265. 10.1007/s11869-019-00754-0. [DOI] [Google Scholar]
- Klein F.; Platt S. M.; Farren N. J.; Detournay A.; Bruns E. A.; Bozzetti C.; Daellenbach K. R.; Kilic D.; Kumar N. K.; Pieber S. M.; Slowik J. G.; Temime-Roussel B.; Marchand N.; Hamilton J. F.; Baltensperger U.; Prévôt A. S. H.; El Haddad I. Characterization of Gas-Phase Organics Using Proton Transfer Reaction Time-of-Flight Mass Spectrometry: Cooking Emissions. Environ. Sci. Technol. 2016, 50, 1243–1250. 10.1021/acs.est.5b04618. [DOI] [PubMed] [Google Scholar]
- Mattila J. M.; Lakey P. S. J.; Shiraiwa M.; Wang C.; Abbatt J. P. D.; Arata C.; Goldstein A. H.; Ampollini L.; Katz E. F.; DeCarlo P. F.; Zhou S.; Kahan T. F.; Cardoso-Saldaña F. J.; Ruiz L. H.; Abeleira A.; Boedicker E. K.; Vance M. E.; Farmer D. K. Multiphase Chemistry Controls Inorganic Chlorinated and Nitrogenated Compounds in Indoor Air during Bleach Cleaning. Environ. Sci. Technol. 2020, 54, 1730–1739. 10.1021/acs.est.9b05767. [DOI] [PubMed] [Google Scholar]
- Wang C.; Collins D. B.; Arata C.; Goldstein A. H.; Mattila J. M.; Farmer D. K.; Ampollini L.; DeCarlo P. F.; Novoselac A.; Vance M. E.; Nazaroff W. W.; Abbatt J. P. D. Surface Reservoirs Dominate Dynamic Gas-Surface Partitioning of Many Indoor Air Constituents. Sci. Adv. 2020, eaay8973. 10.1126/sciadv.aay8973. [DOI] [PMC free article] [PubMed] [Google Scholar]
- Mattila J. M.; Arata C.; Wang C.; Katz E. F.; Abeleira A.; Zhou Y.; Zhou S.; Goldstein A. H.; Abbatt J. P. D.; DeCarlo P. F.; Farmer D. K. Dark Chemistry during Bleach Cleaning Enhances Oxidation of Organics and Secondary Organic Aerosol Production Indoors. Environ. Sci. Technol. Lett. 2020, 795. 10.1021/acs.estlett.0c00573. [DOI] [Google Scholar]
- Weschler C. J.; Carslaw N. Indoor Chemistry. Environ. Sci. Technol. 2018, 2419–2428. 10.1021/acs.est.7b06387. [DOI] [PubMed] [Google Scholar]
- Ault A. P.; Grassian V. H.; Carslaw N.; Collins D. B.; Destaillats H.; Donaldson D. J.; Farmer D. K.; Jimenez J. L.; McNeill V. F.; Morrison G. C.; O’Brien R. E.; Shiraiwa M.; Vance M. E.; Wells J. R.; Xiong W. Indoor Surface Chemistry: Developing a Molecular Picture of Reactions on Indoor Interfaces. Chem 2020, 3203. 10.1016/j.chempr.2020.08.023. [DOI] [PMC free article] [PubMed] [Google Scholar]
- Uhde E.; Salthammer T. Impact of Reaction Products from Building Materials and Furnishings on Indoor Air quality—A Review of Recent Advances in Indoor Chemistry. Atmos. Environ. 2007, 41, 3111–3128. 10.1016/j.atmosenv.2006.05.082. [DOI] [Google Scholar]
- Otake T.; Yoshinaga J.; Yanagisawa Y. Exposure to Phthalate Esters from Indoor Environment. J. Exposure Anal. Environ. Epidemiol. 2004, 14, 524–528. 10.1038/sj.jea.7500352. [DOI] [PubMed] [Google Scholar]
- Bergh C.; Magnus Åberg K.; Svartengren M.; Emenius G.; Östman C. Organophosphate and Phthalate Esters in Indoor Air: A Comparison between Multi-Storey Buildings with High and Low Prevalence of Sick Building Symptoms. J. Environ. Monit. 2011, 13, 2001–2009. 10.1039/c1em10152h. [DOI] [PubMed] [Google Scholar]
- Gilbert N. L.; Guay M.; David Miller J.; Judek S.; Chan C. C.; Dales R. E. Levels and Determinants of Formaldehyde, Acetaldehyde, and Acrolein in Residential Indoor Air in Prince Edward Island, Canada. Environ. Res. 2005, 99, 11–17. 10.1016/j.envres.2004.09.009. [DOI] [PubMed] [Google Scholar]
- Seaman V. Y.; Bennett D. H.; Cahill T. M. Origin, Occurrence, and Source Emission Rate of Acrolein in Residential Indoor Air. Environ. Sci. Technol. 2007, 6940–6946. 10.1021/es0707299. [DOI] [PubMed] [Google Scholar]
- Salthammer T.; Zhang Y.; Mo J.; Koch H. M.; Weschler C. J. Assessing Human Exposure to Organic Pollutants in the Indoor Environment. Angew. Chem., Int. Ed. 2018, 57, 12228–12263. 10.1002/anie.201711023. [DOI] [PubMed] [Google Scholar]
- Bluyssen P. M. Towards an Integrated Analysis of the Indoor Environmental Factors and Its Effects on Occupants. Intell. Build. Int. 2020, 12, 199–207. 10.1080/17508975.2019.1599318. [DOI] [Google Scholar]
- Farmer D. K. Analytical Challenges and Opportunities For Indoor Air Chemistry Field Studies. Anal. Chem. 2019, 91, 3761–3767. 10.1021/acs.analchem.9b00277. [DOI] [PubMed] [Google Scholar]
- Schripp T.; Etienne S.; Fauck C.; Fuhrmann F.; Märk L.; Salthammer T. Application of Proton-Transfer-Reaction-Mass-Spectrometry for Indoor Air Quality Research. Indoor Air 2014, 24, 178–189. 10.1111/ina.12061. [DOI] [PubMed] [Google Scholar]
- Kristensen K.; Lunderberg D. M.; Liu Y.; Misztal P. K.; Tian Y.; Arata C.; Nazaroff W. W.; Goldstein A. H. Sources and Dynamics of Semivolatile Organic Compounds in a Single-Family Residence in Northern California. Indoor Air 2019, 29, 645–655. 10.1111/ina.12561. [DOI] [PubMed] [Google Scholar]
- Farmer D. K.; Vance M. E.; Abbatt J. P. D.; Abeleira A.; Alves M. R.; Arata C.; Boedicker E.; Bourne S.; Cardoso-Saldaña F.; Corsi R.; DeCarlo P. F.; Goldstein A. H.; Grassian V. H.; Hildebrandt Ruiz L.; Jimenez J. L.; Kahan T. F.; Katz E. F.; Mattila J. M.; Nazaroff W. W.; Novoselac A.; O’Brien R. E.; Or V. W.; Patel S.; Sankhyan S.; Stevens P. S.; Tian Y.; Wade M.; Wang C.; Zhou S.; Zhou Y. Overview of HOMEChem: House Observations of Microbial and Environmental Chemistry. Environ. Sci.: Processes Impacts 2019, 1280–1300. 10.1039/c9em00228f. [DOI] [PubMed] [Google Scholar]
- Arata C.; Misztal P. K.; Tian Y.; Lunderberg D. M.; Kristensen K.; Novoselac A.; Vance M. E.; Farmer D. K.; Nazaroff W. W.; Goldstein A. H. Volatile Organic Compound Emissions during HOMEChem. Indoor Air 2021, 31, 2099–2117. 10.1111/ina.12906. [DOI] [PubMed] [Google Scholar]
- Brown S. K.; Sim M. R.; Abramson M. J.; Gray C. N. Concentrations of Volatile Organic Compounds in Indoor Air - A Review. Indoor Air 1994, 123–134. 10.1111/j.1600-0668.1994.t01-2-00007.x. [DOI] [Google Scholar]
- Paciência I.; Madureira J.; Rufo J.; Moreira A.; de Fernandes E. A Systematic Review of Evidence and Implications of Spatial and Seasonal Variations of Volatile Organic Compounds (VOC) in Indoor Human Environments. J. Toxicol. Environ. Health, Part B 2016, 19, 47–64. 10.1080/10937404.2015.1134371. [DOI] [PubMed] [Google Scholar]
- Li Y.; Cakmak S.; Zhu J. Profiles and Monthly Variations of Selected Volatile Organic Compounds in Indoor Air in Canadian Homes: Results of Canadian National Indoor Air Survey 2012-2013. Environ. Int. 2019, 134–144. 10.1016/j.envint.2019.02.035. [DOI] [PubMed] [Google Scholar]
- Zhu J.; Wong S. L.; Cakmak S. Nationally Representative Levels of Selected Volatile Organic Compounds in Canadian Residential Indoor Air: Population-Based Survey. Environ. Sci. Technol. 2013, 47, 13276–13283. 10.1021/es403055e. [DOI] [PubMed] [Google Scholar]
- Heald C. L.; Kroll J. H. The Fuel of Atmospheric Chemistry: Toward a Complete Description of Reactive Organic Carbon. Sci. Adv. 2020, 6, eaay8967. 10.1126/sciadv.aay8967. [DOI] [PMC free article] [PubMed] [Google Scholar]
- Xu H.; Li Y.; Feng R.; He K.; Ho S. S. H.; Wang Z.; Ho K. F.; Sun J.; Chen J.; Wang Y.; Liu Y.; Wang F.; Xue W.; Qu L.; Shen Z.; Cao J. Comprehensive Characterization and Health Assessment of Occupational Exposures to Volatile Organic Compounds (VOCs) in Xi’an, a Major City of Northwestern China. Atmos. Environ. 2021, 246, 118085. 10.1016/j.atmosenv.2020.118085. [DOI] [Google Scholar]
- Mandin C.; Trantallidi M.; Cattaneo A.; Canha N.; Mihucz V. G.; Szigeti T.; Mabilia R.; Perreca E.; Spinazzè A.; Fossati S.; De Kluizenaar Y.; Cornelissen E.; Sakellaris I.; Saraga D.; Hänninen O.; De Oliveira Fernandes E.; Ventura G.; Wolkoff P.; Carrer P.; Bartzis J. Assessment of Indoor Air Quality in Office Buildings across Europe – The OFFICAIR Study. Sci. Total Environ. 2017, 579, 169–178. 10.1016/j.scitotenv.2016.10.238. [DOI] [PubMed] [Google Scholar]
- Su F.-C.; Mukherjee B.; Batterman S. Determinants of Personal, Indoor and Outdoor VOC Concentrations: An Analysis of the RIOPA Data. Environ. Res. 2013, 126, 192–203. 10.1016/j.envres.2013.08.005. [DOI] [PMC free article] [PubMed] [Google Scholar]
- Liu S.; Li R.; Wild R. J.; Warneke C.; de Gouw J. A.; Brown S. S.; Miller S. L.; Luongo J. C.; Jimenez J. L.; Ziemann P. J. Contribution of Human-Related Sources to Indoor Volatile Organic Compounds in a University Classroom. Indoor Air 2016, 925–938. 10.1111/ina.12272. [DOI] [PubMed] [Google Scholar]
- Liu S.; Thompson S. L.; Stark H.; Ziemann P. J.; Jimenez J. L. Gas-Phase Carboxylic Acids in a University Classroom: Abundance, Variability, and Sources. Environ. Sci. Technol. 2017, 51, 5454–5463. 10.1021/acs.est.7b01358. [DOI] [PubMed] [Google Scholar]
- Young C. J.; Zhou S.; Siegel J. A.; Kahan T. F. Illuminating the Dark Side of Indoor Oxidants. Environ. Sci. Proc. Impacts 2019, 21, 1229–1239. 10.1039/C9EM00111E. [DOI] [PubMed] [Google Scholar]
- Zhou S.; Young C. J.; VandenBoer T. C.; Kowal S. F.; Kahan T. F. Time-Resolved Measurements of Nitric Oxide, Nitrogen Dioxide, and Nitrous Acid in an Occupied New York Home. Environ. Sci. Technol. 2018, 52, 8355–8364. 10.1021/acs.est.8b01792. [DOI] [PubMed] [Google Scholar]
- Gandolfo A.; Gligorovski V.; Bartolomei V.; Tlili S.; Gómez Alvarez E.; Wortham H.; Kleffmann J.; Gligorovski S. Spectrally Resolved Actinic Flux and Photolysis Frequencies of Key Species within an Indoor Environment. Build. Environ. 2016, 109, 50–57. 10.1016/j.buildenv.2016.08.026. [DOI] [Google Scholar]
- Tang X.; Misztal P. K.; Nazaroff W. W.; Goldstein A. H. Siloxanes Are the Most Abundant Volatile Organic Compound Emitted from Engineering Students in a Classroom. Environ. Sci. Technol. Lett. 2015, 303–307. 10.1021/acs.estlett.5b00256. [DOI] [Google Scholar]
- Liu Y.; Misztal P. K.; Xiong J.; Tian Y.; Arata C.; Weber R. J.; Nazaroff W. W.; Goldstein A. H. Characterizing Sources and Emissions of Volatile Organic Compounds in a Northern California Residence Using Space- and Time-Resolved Measurements. Indoor Air 2019, 29, 630–644. 10.1111/ina.12562. [DOI] [PubMed] [Google Scholar]
- Sheu R.; Fortenberry C. F.; Walker M. J.; Eftekhari A.; Stönner C.; Bakker A.; Peccia J.; Williams J.; Morrison G. C.; Williams B. J.; Gentner D. R. Evaluating Indoor Air Chemical Diversity, Indoor-to-Outdoor Emissions, and Surface Reservoirs Using High-Resolution Mass Spectrometry. Environ. Sci. Technol. 2021, 55, 10255–10267. 10.1021/acs.est.1c01337. [DOI] [PMC free article] [PubMed] [Google Scholar]
- Fortenberry C.; Walker M.; Dang A.; Loka A.; Date G.; Cysneiros de Carvalho K.; Morrison G.; Williams B. Analysis of Indoor Particles and Gases and Their Evolution with Natural Ventilation. Indoor Air 2019, 29, 761–779. 10.1111/ina.12584. [DOI] [PMC free article] [PubMed] [Google Scholar]
- Wang N.; Zannoni N.; Ernle L.; Bekö G.; Wargocki P.; Li M.; Weschler C. J.; Williams J. Total OH Reactivity of Emissions from Humans: In Situ Measurement and Budget Analysis. Environ. Sci. Technol. 2021, 149–159. 10.1021/acs.est.0c04206. [DOI] [PMC free article] [PubMed] [Google Scholar]
- Bekö G.; Wargocki P.; Wang N.; Li M.; Weschler C. J.; Morrison G.; Langer S.; Ernle L.; Licina D.; Yang S.; Zannoni N.; Williams J. The Indoor Chemical Human Emissions and Reactivity (ICHEAR) Project: Overview of Experimental Methodology and Preliminary Results. Indoor Air 2020, 30, 1213–1228. 10.1111/ina.12687. [DOI] [PubMed] [Google Scholar]
- Veres P. R.; Faber P.; Drewnick F.; Lelieveld J.; Williams J. Anthropogenic Sources of VOC in a Football Stadium: Assessing Human Emissions in the Atmosphere. Atmos. Environ. 2013, 77, 1052–1059. 10.1016/j.atmosenv.2013.05.076. [DOI] [Google Scholar]
- Avery A. M.; Waring M. S.; DeCarlo P. F. Seasonal Variation in Aerosol Composition and Concentration upon Transport from the Outdoor to Indoor Environment. Environ. Sci. Proc. Impacts 2019, 21, 528–547. 10.1039/C8EM00471D. [DOI] [PubMed] [Google Scholar]
- Katz E. F.; Lunderberg D. M.; Brown W. L.; Day D. A.; Jimenez J. L.; Nazaroff W. W.; Goldstein A. H.; DeCarlo P. F. Large Emissions of Low-Volatility Siloxanes during Residential Oven Use. Environ. Sci. Technol. Lett. 2021, 8, 519–524. 10.1021/acs.estlett.1c00433. [DOI] [Google Scholar]
- Price D. J.; Day D. A.; Pagonis D.; Stark H.; Algrim L. B.; Handschy A. V.; Liu S.; Krechmer J. E.; Miller S. L.; Hunter J. F.; de Gouw J. A.; Ziemann P. J.; Jimenez J. L. Budgets of Organic Carbon Composition and Oxidation in Indoor Air. Environ. Sci. Technol. 2019, 53, 13053–13063. 10.1021/acs.est.9b04689. [DOI] [PubMed] [Google Scholar]
- DeCarlo P. F.; Avery A. M.; Waring M. S. Thirdhand Smoke Uptake to Aerosol Particles in the Indoor Environment. Sci. Adv. 2018, 4, eaap8368. 10.1126/sciadv.aap8368. [DOI] [PMC free article] [PubMed] [Google Scholar]
- Sheu R.; Stönner C.; Ditto J. C.; Klüpfel T.; Williams J.; Gentner D. R. Human Transport of Thirdhand Tobacco Smoke: A Prominent Source of Hazardous Air Pollutants into Indoor Nonsmoking Environments. Sci. Adv. 2020, eaay4109. 10.1126/sciadv.aay4109. [DOI] [PMC free article] [PubMed] [Google Scholar]
- Collins D. B.; Wang C.; Abbatt J. P. D. Selective Uptake of Third-Hand Tobacco Smoke Components to Inorganic and Organic Aerosol Particles. Environ. Sci. Technol. 2018, 52, 13195–13201. 10.1021/acs.est.8b03880. [DOI] [PubMed] [Google Scholar]
- Mattila J. M.; Arata C.; Abeleira A.; Zhou Y.; Wang C.; Katz E. F.; Goldstein A. H.; Abbatt J. P. D.; DeCarlo P. F.; Vance M. E.; Farmer D. K. Contrasting Chemical Complexity and the Reactive Organic Carbon Budget of Indoor and Outdoor Air. Environ. Sci. Technol. 2022, 10.1021/acs.est.1c03915. [DOI] [PubMed] [Google Scholar]
- Weschler C. J. Roles of the Human Occupant in Indoor Chemistry. Indoor Air 2016, 26, 6–24. 10.1111/ina.12185. [DOI] [PubMed] [Google Scholar]
- Wei W.; Little J. C.; Ramalho O.; Mandin C. Predicting Chemical Emissions from Household Cleaning and Personal Care Products: A Review. Build. Environ. 2022, 108483. 10.1016/j.buildenv.2021.108483. [DOI] [Google Scholar]
- Raub J. The Setting of Health-Based Standards for Ambient Carbon Monoxide and Their Impact on Atmospheric Levels*. Carbon Monoxide Toxic. 2000, 83–99. 10.1201/9781420039320.ch4. [DOI] [Google Scholar]
- Persily A. K.Indoor Carbon Dioxide Concentrations in Ventilation and Indoor Air Quality Standards. In 36th AIVC Conference Effective Ventilation in High Performance Buildings; 2015, pp. 810–819.
- Duncan I. J. Does Methane Pose Significant Health and Public Safety hazards?—A Review. Environ. Geosci. 2015, 22, 85–96. 10.1306/eg.06191515005. [DOI] [Google Scholar]
- Martin T.User’s Guide for T.E.S.T. (version 4.2) (Toxicity Estimation Software Tool) A Program to Estimate Toxicity from Molecular Structure. 2016.
- Epa U. S. Technical Support Document EPA ’ S 2011 National-Scale Air Toxics Assessment 2014 NATA TSD. 2018.
- McCord J. P.; Groff L. C.; Sobus J. R. Quantitative Non-Targeted Analysis: Bridging the Gap between Contaminant Discovery and Risk Characterization. Environ. Int. 2022, 158, 107011. 10.1016/j.envint.2021.107011. [DOI] [PMC free article] [PubMed] [Google Scholar]
- Leslie M. D.; Ridoli M.; Murphy J. G.; Borduas-Dedekind N. Isocyanic Acid (HNCO) and Its Fate in the Atmosphere: A Review. Environ. Sci. Proc. Impacts 2019, 21, 793–808. 10.1039/C9EM00003H. [DOI] [PubMed] [Google Scholar]
- Halmes N. C. Reevaluating Cancer Risk Estimates for Short-Term Exposure Scenarios. Toxicol. Sci. 2000, 32–42. 10.1093/toxsci/58.1.32. [DOI] [PubMed] [Google Scholar]
- Barck C.; Lundahl J.; Halldén G.; Bylin G. Brief Exposures to NO2 Augment the Allergic Inflammation in Asthmatics. Environ. Res. 2005, 97, 58–66. 10.1016/j.envres.2004.02.009. [DOI] [PubMed] [Google Scholar]
- Upadhyay S.; Chakraborty A.; Thimraj T. A.; Baldi M.; Steneholm A.; Ganguly K.; Gerde P.; Ernstgård L.; Palmberg L. Establishment of Repeated In Vitro Exposure System for Evaluating Pulmonary Toxicity of Representative Criteria Air Pollutants Using Advanced Bronchial Mucosa Models. Toxics 2022, 277. 10.3390/toxics10060277. [DOI] [PMC free article] [PubMed] [Google Scholar]
- United States Environmental Protection Agency (EPA) . EPA Assessment of Risks from Radon Homes; CreateSpace Independent Publishing Platform, 2018. [Google Scholar]
- Siegel M.; Skeer M.. Exposure to secondhand smoke and excess lung cancer mortality risk among workers in the “5 B’s”: bars, bowling alleys, billiard halls, betting establishments, and bingo parlours. Tobacco control , 12 (), 333–338. [DOI] [PMC free article] [PubMed] [Google Scholar]
- Liu R.; Jiang Y.; Li Q.; Hammond S. K. An Assessment of Health Risks and Mortality from Exposure to Secondhand Smoke in Chinese Restaurants and Bars. PLoS One 2014, 9, e84811 10.1371/journal.pone.0084811. [DOI] [PMC free article] [PubMed] [Google Scholar]
- Yang J.; Hashemi S.; Han W.; Song Y.; Lim Y. Exposure and Risk Assessment of Second- and Third-Hand Tobacco Smoke Using Urinary Cotinine Levels in South Korea. Int. J. Environ. Res. Public Health 2022, 19, 3746. 10.3390/ijerph19063746. [DOI] [PMC free article] [PubMed] [Google Scholar]
- Guo H.; Lee S. C.; Chan L. Y.; Li W. M. Risk Assessment of Exposure to Volatile Organic Compounds in Different Indoor Environments. Environ. Res. 2004, 94, 57–66. 10.1016/S0013-9351(03)00035-5. [DOI] [PubMed] [Google Scholar]
- Logue J. M.; Price P. N.; Sherman M. H.; Singer B. C. A Method to Estimate the Chronic Health Impact of Air Pollutants in U. S. Residences. Environ. Health Perspect. 2012, 120, 216–222. 10.1289/ehp.1104035. [DOI] [PMC free article] [PubMed] [Google Scholar]
- Patel S.; Sankhyan S.; Boedicker E. K.; DeCarlo P. F.; Farmer D. K.; Goldstein A. H.; Katz E. F.; Nazaroff W. W.; Tian Y.; Vanhanen J.; Vance M. E. Indoor Particulate Matter during HOMEChem: Concentrations, Size Distributions, and Exposures. Environ. Sci. Technol. 2020, 54, 7107–7116. 10.1021/acs.est.0c00740. [DOI] [PubMed] [Google Scholar]
- Tian Y.; Arata C.; Boedicker E.; Lunderberg D. M.; Patel S.; Sankhyan S.; Kristensen K.; Misztal P. K.; Farmer D. K.; Vance M.; Novoselac A.; Nazaroff W. W.; Goldstein A. H. Indoor Emissions of Total and Fluorescent Supermicron Particles during HOMEChem. Indoor Air 2021, 31, 88–98. 10.1111/ina.12731. [DOI] [PubMed] [Google Scholar]
- Nazaroff W. W.; Weschler C. J. Indoor Ozone: Concentrations and Influencing Factors. Indoor Air 2022, e12942. 10.1111/ina.12942. [DOI] [PubMed] [Google Scholar]
- Siegel J. A. Primary and Secondary Consequences of Indoor Air Cleaners. Indoor Air 2016, 26, 88–96. 10.1111/ina.12194. [DOI] [PubMed] [Google Scholar]
- Collins D. B.; Farmer D. K. Unintended Consequences of Air Cleaning Chemistry. Environ. Sci. Technol. 2021, 55, 12172–12179. 10.1021/acs.est.1c02582. [DOI] [PubMed] [Google Scholar]
- Weschler C. J. Ozone in Indoor Environments: Concentration and Chemistry. Indoor Air 2000, 269–288. 10.1034/j.1600-0668.2000.010004269.x. [DOI] [PubMed] [Google Scholar]
- Carslaw N.; Shaw D. Secondary Product Creation Potential (SPCP): A Metric for Assessing the Potential Impact of Indoor Air Pollution on Human Health. Environ. Sci. Proc. Impacts 2019, 21, 1313–1322. 10.1039/C9EM00140A. [DOI] [PubMed] [Google Scholar]
Associated Data
This section collects any data citations, data availability statements, or supplementary materials included in this article.