

Abstract
Background.
Improving antibiotic use has the potential to decrease healthcare costs by reducing the incidence of antibiotic-resistant infections, antibiotic-associated adverse events, and expenditures due to unnecessary prescriptions. Antibiotic expenditures in 2009 totaled $10.7 billion in the United States. Since then, national and local antibiotic stewardship initiatives have grown. The purpose of this study was to assess trends in antibiotic expenditures by healthcare setting in the United States between 2010 and 2015.
Methods.
Systemic (nontopical) antibiotic expenditures from January 2010 to December 2015 were extracted from the QuintilesIMS National Sales Perspectives database. These data represent a statistically valid projection of US medication purchases. Regression analyses evaluated trends in expenditures over the study period.
Results.
Antibiotic expenditures totaled $56.0 billion over the 6-year period; the majority (59.1%) of expenditures were associated with the outpatient setting. Overall antibiotic expenditures in 2015 ($8.8 billion) were 16.6% lower than in 2010 ($10.6 billion). Antibiotic expenditures similarly decreased in the community by 25.5% (P = .05), but outpatient clinics and mail service pharmacy expenditures experienced significant growth (148% and 67% increase, respectively; P < .01 for both). In 2015, 16.5% of antibiotic expenditures in the community were for parenteral formulations, an increase of 25%.
Conclusions.
From 2010 to 2015, antibiotic expenditures decreased. The majority of antibiotic expenditures were in the outpatient setting, specifically community pharmacies. Expenditures for intravenous agents in the community are increasing and may represent increased use. These results reinforce the importance of antibiotic stewardship efforts across the spectrum of healthcare.
Keywords: antibiotic, expenditures, stewardship, community, outpatient parenteral antimicrobial therapy
Reducing inappropriate antibiotic use has the potential to decrease healthcare costs by reducing the incidence of antibiotic-resistant infections, antibiotic-associated adverse events, and expenditures due to unnecessary prescriptions [1, 2]. Recent estimates suggest that at least 30% of antibiotics prescribed in outpatient settings are unnecessary and are often prescribed for viral respiratory tract infections [3]. Similarly, antibiotics in the inpatient setting are frequently prescribed inappropriately [4, 5]. All antibiotic use, whether appropriate or not, contributes to increased bacterial resistance. In light of new resistance threats and decreasing antibiotic development, the threat of antibiotic resistance has become a public health crisis [6–10].
Antibiotic stewardship has been shown to decrease unnecessary antibiotic use while increasing patient safety [1, 4–6, 11, 12]. Several recent health policy statements by the White House, the President’s Council of Advisors on Science and Technology (PCAST), the Centers for Disease Control and Prevention (CDC), The Joint Commission, the Centers for Medicare and Medicaid Services (CMS), state governments, and professional organizations have encouraged and, in some cases, mandated antibiotic stewardship initiatives [5, 12–14].
By decreasing unnecessary use, antibiotic stewardship also has the potential to reduce medication expenditures [1]. Medication expenditures total $300 billion annually in the United States and are 11% of overall healthcare costs [15, 16]. The anti-infective class of medications, which includes antibacterial agents, is consistently one of the top therapeutic categories in terms of expenditures [17–22]. Using medication expenditure data from 2009, we reported previously that antibiotic expenditures totaled $10.7 billion in the United States, 61.5% from outpatient healthcare settings [23]. The objective of the present study was to assess trends in overall and class- and agent-specific antibiotic expenditures by healthcare setting in the United States between 2010 and 2015. A secondary objective was to assess the proportion of antibiotic expenditures attributable to parenteral formulations.
METHODS
Systemic (ie, inhaled, oral, and parenteral) antibiotic expenditures, from 1 January 2010 through 31 December 2015, were extracted from the QuintilesIMS National Sales Perspectives database. These data are a statistically valid projection of total medication purchases by healthcare settings and public services in the United States and represent a population-level view of medication expenditures [24]. Systemic antibiotics were stratified into class (aminoglycosides, cephalosporins, macrolides, miscellaneous anti-infectives, oxazolidinones, penicillins, quinolones, sulfonamides [includes trimethoprim], and tetracyclines) as defined by the Uniform System of Classification (https://www.imshealth.com/files/web/IMSH%20Institute/USC_Classification_Process_2011.pdf). The “miscellaneous” class includes the carbapenem, polymyxin, glycopeptide, chloramphenicol, metronidazole, lipopeptide, and lipoglycopeptide subclasses.
Antibiotic expenditures in the community refer to antibiotics sold or administered in community pharmacies, mail service pharmacies, and outpatient clinics. These expenditures represent the purchases made by the pharmacy or healthcare setting that dispenses the prescription. Antibiotic expenditures do not represent patient out-of-pocket costs or costs covered by insurance on behalf of the patient. Community pharmacies include chain and independent stores, as well as mass merchandisers and food and convenience stores with a licensed pharmacy. Pharmacies located in a physician’s office were included with community pharmacies. Mail service pharmacies included both private-sector and federal facilities with licensed mail order pharmacies. Mail order pharmacies also included specialty pharmacies. Clinics included physician offices and outpatient clinics, such as general, family medicine, specialty clinics, and urgent care centers. Medication expenditures in the clinic category primarily comprised medications administered in the clinic (eg, intravenous medications or directly observed therapy) and not traditional prescriptions dispensed by a pharmacy. Nonfederal hospitals included all non-federally owned facilities licensed as hospitals, including inpatient treatment and rehabilitation facilities, in addition to general and specialty acute care institutions. Other nonretail included long-term care facilities, federal facilities, the Public Health Service, and United States ships at sea. Veterans Affairs facilities were not included in the federal hospital category after 31 December 2013.
Antibiotics were assessed by year, class, and healthcare setting; total US dollars spent and proportions within groups were used to characterize expenditures. The dollar values were reported in the year they occurred (eg, 2010 expenditures were reported in 2010 dollars). In 2014 and 2015, data included the formulation of the agent. Therefore, agents were further categorized by formulation (oral, injectable) for 2014 and 2015.
To assess the statistical significance of overall trends, as well as trends in the proportion of expenditures, by healthcare setting and antibiotic class over the study period, simple linear regression analysis was applied. A P value ≤.05 was considered significant. SAS version 9.3 (SAS Institute, Cary, North Carolina) was used for data and statistical analysis.
RESULTS
From 2010 through 2015, antibiotic expenditures were $55.9 billion. Expenditures in 2015 ($8.8 billion) were 16.6% lower than in 2010 ($10.6 billion) (Table 1). Over the 6-year period, there was a decline in antibiotic expenditures except for 2013, where an 8.6% increase was observed (P = .11).
Table 1.
Antibiotic Expenditures Overall and by Year in Healthcare Settings in the United States, 2010–2015a
| Year | Antibiotic Expenditures (in Millions) | % Growth |
|---|---|---|
|
| ||
| 2010 | $10 569 | ... |
| 2011 | $9788 | −7.4 |
| 2012 | $8436 | −13.8 |
| 2013 | $9163 | 8.6 |
| 2014 | $9095 | −0.7 |
| 2015 | $8810 | −3.1 |
| Total expenditures, 2010–2015 | $55 861 | −16.6 |
P = .1119 for trend.
Expenditures by Healthcare Setting
The majority (59.1%; $33.2 billion) of antibiotic expenditures during the study period were associated with the outpatient setting. Of the outpatient expenditures, 86.5% were for prescriptions dispensed in community pharmacies ($28.7 billion), followed by clinics (7.5% of outpatient expenditures; $2.5 billion) and mail service pharmacies (5.7%; 1.9 billion). Nonfederal hospitals accounted for 29.3% ($16.4 billion) of overall antibiotic expenditures. Other nonretail, which includes long-term care and federal facilities, was the smallest proportion of expenditures (11.6%; $6.5 billion). From 2010 to 2015, the largest growth in antibiotic expenditures occurred in clinics (148.0% increase; P < .01) and mail service pharmacies (67.0% increase; P < .01; Table 2), whereas community pharmacies experienced decreased growth (−37.4%; P < .02). Nonfederal hospitals and other nonretail settings experienced nonsignificant changes in antibiotic expenditures.
Table 2.
Expenditures by Healthcare Setting and Year
| Year | Community Pharmaciesa | Mail Service Pharmaciesa | Nonfederal Hospitalsa | Other Nonretaila | Clinicsa |
|---|---|---|---|---|---|
|
| |||||
| 2010 | 5.9 (55.5) | 0.23 (2.2) | 3.1 (29.1) | 1.1 (10.6) | 0.28 (2.6) |
| 2011 | 5.4 (54.8) | 0.24 (2.5) | 2.8 (28.9) | 1.1 (10.9) | 0.29 (2.9) |
| 2012 | 4.4 (52.3) | 0.24 (2.9) | 2.6 (31.3) | 0.86 (10.2) | 0.29 (3.4) |
| 2013 | 4.9 (53.8) | 0.39 (4.3) | 2.5 (274) | 0.94 (10.3) | 0.39 (4.2) |
| 2014 | 4.3 (46.9) | 0.39 (4.3) | 2.6 (28.9) | 1.2 (13.4) | 0.59 (6.5) |
| 2015 | 3.7 (42.6) | 0.38 (4.4) | 2.7 (30.8) | 1.2 (14.2) | 0.69 (8.0) |
| P valueb | .0141 | .0051 | .7438 | .0657 | .0039 |
| % growth, 2010 to 2015c | −37.4 | 67.0 | −13.7 | 9.6 | 148.0 |
Results are reported in millions of dollars (percentage).
P value is evaluating the trend in the proportion of expenditures over 6 years.
Percentage growth is calculated from 2015 and 2010 expenditures.
Expenditures by Antibiotic Class
The antibiotic class accounting for the largest proportion of antibiotic expenditures over the 6 years was the miscellaneous class (21.1% of overall expenditures; $11.8 billion; daptomycin and vancomycin had the greatest expenditures in this class; Supplementary Table 1), followed by the tetracyclines (20.9%; $11.7 billion), penicillins (16.4%; $9.1 billion), cephalosporins (10.6%; $5.9 billion), macrolides (9.6%; $5.4 billion), and quinolones (9.1%; $5.1 billion). Whereas the proportion of expenditures for quinolones decreased significantly (P = .01) over the study period, expenditures for cephalosporins and sulfonamides increased (P < .05 for all; Table 3). There were no significant trends in expenditures for the penicillin, macrolide, tetracycline, aminoglycoside, or oxazolidinone classes.
Table 3.
Cost and Proportion of Antibiotic Expenditures According to Class and Year, 2010–2015
| Antibiotic Class | 2010a | 2011a | 2012a | 2013a | 2014a | 2015a | P Valueb |
|---|---|---|---|---|---|---|---|
|
| |||||||
| Tetracyclines | 1.8 (17.2) | 1.9 (19.1) | 1.7 (20.2) | 2.6 (28.4) | 2.0 (22.2) | 1.7 (19.2) | .4679 |
| Cephalosporins | 0.88 (8.3) | 0.91 (9.3) | 0.95 (11.2) | 1.0 (11.4) | 1.1 (11.5) | 1.1 (12.2) | .0065 |
| Macrolides | 0.86 (8.1) | 0.91 (9.3) | 0.93 (11.0) | 0.85 (9.3) | 0.88 (9.6) | 0.93 (10.7) | .1913 |
| Penicillins | 1.9 (17.9) | 1.6 (16.5) | 1.4 (16.6) | 1.3 (14.5) | 1.5 (16.4) | 1.4 (16.0) | .2283 |
| Aminoglycosides | 0.31 (3.0) | 0.34 (3.4) | 0.38 (4.5) | 0.44 (4.8) | 0.38 (4.2) | 0.31 (3.7) | .3318 |
| Quinolones | 2.2 (21.1) | 1.5 (15.1) | 0.48 (5.7) | 0.42 (4.6) | 0.27 (3.0) | 0.20 (2.3) | .0103 |
| Sulfonamides | 0.07 (0.7) | 0.07 (0.7) | 0.06 (0.7) | 0.07 (0.8) | 0.10 (1.1) | 0.12 (1.4) | .0124 |
| Oxazolidinones | 0.69 (6.6) | 0.73 (7.5) | 0.71 (8.5) | 0.73 (8.0) | 0.75 (8.2) | 0.59 (6.9) | .6749 |
| Miscellaneous | 1.8 (17.2) | 1.9 (19.2) | 1.8 (21.7) | 1.7 (18.2) | 2.2 (23.9) | 2.4 (27.7) | .0008 |
Results are reported in millions of dollars (percentage); for each percent value, the denominator is the total expenditure in that calendar year.
P value is evaluating the trend in the proportion of expenditures over 5 years.
When comparing the distribution of expenditures by healthcare setting, the majority of expenditures for tetracyclines (82.8% of tetracycline expenditures), sulfonamides (74.7%), macrolides (72.6%), quinolones (71.4%), and cephalosporins (61.9%) were in community pharmacies (Figure 1). However, mail service pharmacies accounted for the majority of expenditures for aminoglycosides (47.7%), and nonfederal hospitals had the majority of expenditures for penicillins (44.7%), oxazolidinones (47.5%), and the miscellaneous class (51.7%). No antibiotic class predominated in the clinic or other nonretail setting.
Figure 1.
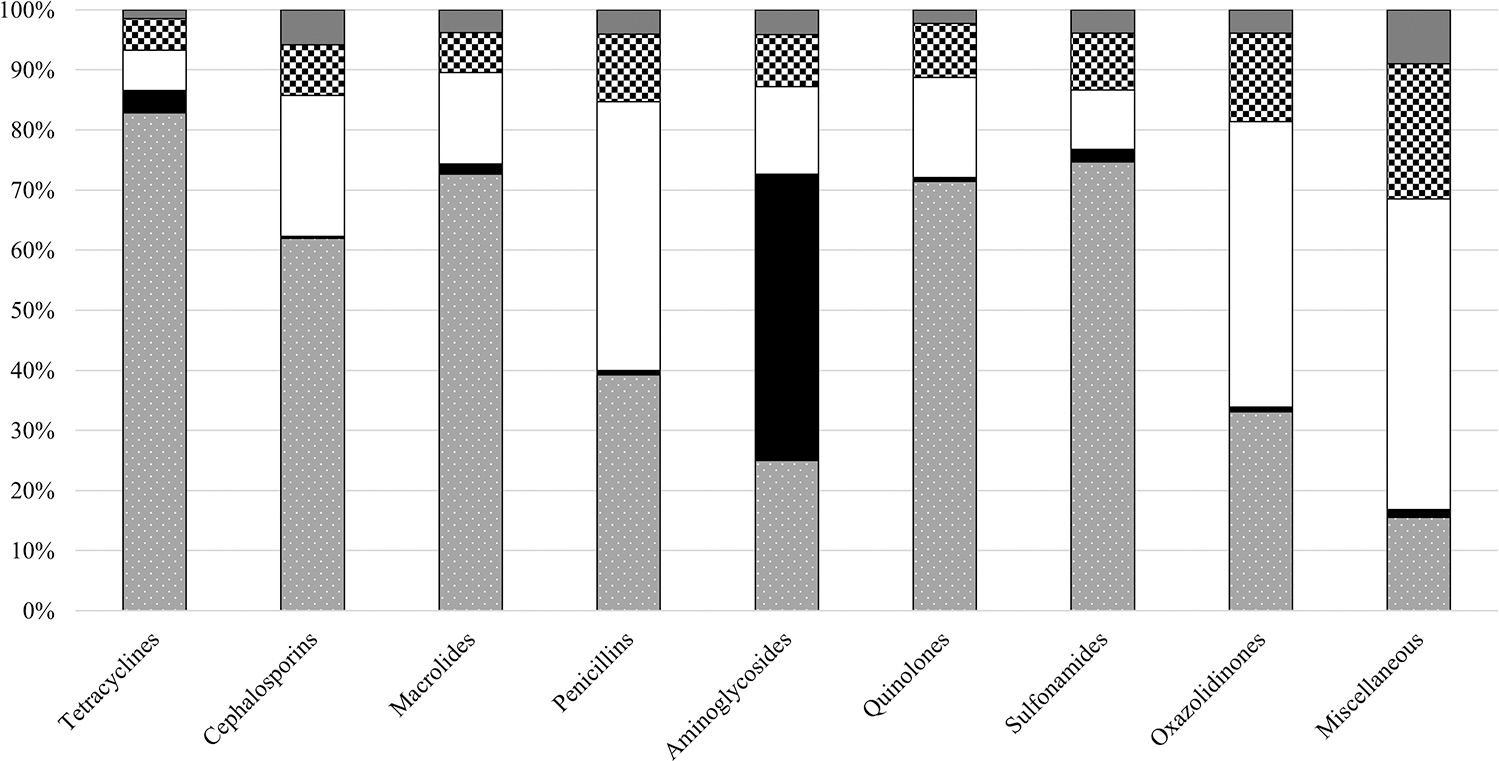
Antibiotic class expenditures stratified by healthcare setting, 2010–2015. Community pharmacies (gray background with white dots), mail service pharmacy (solid black), nonfederal hospitals (solid white), other nonretail (white and black checkerboard), clinics (solid dark gray). Denominator equals total dollars in the respective antibiotic class.
The tetracycline and macrolide classes led antibiotic expenditures in the community (31.2% of outpatient antibiotic expenditures, $10.3 billion; 12.7%, $4.2 billion, respectively). In nonfederal hospitals, the miscellaneous class accounted for the greatest expenditure of antibiotics (37.2% of nonfederal hospital antibiotic expenditures; $6.1 billion), followed by the penicillin class (24.9%; $4.1 billion) (Supplementary Table 2). The miscellaneous class (41.0%; $2.7 billion) and penicillins (15.9%; $1.0 billion) accounted for the majority of the other nonretail antibiotic expenditures (Supplementary Table 2).
Expenditures by Agent
The top single antibiotic by expenditure overall was doxycycline ($7.0 billion; 12.5% of total expenditures), followed by daptomycin ($4.9 billion; 8.8%) and linezolid ($4.4 billion; 7.8%) (Supplementary Table 1). From 2010 to 2015, the proportion of expenditures decreased significantly for minocycline (P = .02), levofloxacin (P = .03), and azithromycin (P = .03), whereas expenditures increased for daptomycin (P = .01) and linezolid (P = .048) (Supplementary Table 1). In the community, the top agents by expenditures were doxycycline and minocycline totaling, 19.6% and 10.7% of outpatient antibiotic expenditures, respectively (Supplementary Table 3). Community expenditures for minocycline, levofloxacin, azithromycin, and moxifloxacin decreased between 2010 and 2015 (P ≤ .04; Supplementary Table 3). Supplementary Table 4 shows the top agents by expenditures for the specific healthcare setting within the community. The agents contributing the most cost in nonfederal hospitals included piperacillin-tazobactam (16.5% of nonfederal hospital expenditures), daptomycin (18.1%), and linezolid (12.1%) (Supplementary Table 3). Nonfederal hospital expenditures for daptomycin and ertapenem increased significantly over the study period (P ≤ .01). Other nonretail settings were similar to hospitals; daptomycin (20.0% of other nonretail expenditures), linezolid (9.5%), and ertapenem (8.0%) were the agents with the highest expenditures (Supplementary Table 3). Ertapenem expenditures in other nonretail settings grew significantly (>101%) from 2010 to 2015 (P < .01).
Expenditures for Outpatient Parenteral Antimicrobial Therapy
In 2014 and 2015, 13.2% ($692.6 million) and 16.5% ($788.8 million) of antibiotic expenditures in the community, respectively, were for parenteral formulations. The overall proportion of outpatient parenteral antimicrobial therapy (OPAT) expenditures increased by 25% in 2015 compared with 2014. Classes with the highest proportion of parenteral expenditures included the miscellaneous class and aminoglycosides (Figure 2). The largest growth in OPAT expenditures was for penicillins (71.8% increase), cephalosporins (39.5% increase), and tetracyclines (37.1% increase). In 2015, 70% of community parenteral expenditures comprised 5 antibiotics: daptomycin ($229.5 million; 29.1% of OPAT expenditures), vancomycin ($141.7 million; 18.0%), tobramycin ($96.6 million; 12.2%), ertapenem ($47.0 million; 6.0%), and penicillin ($45.8 million; 5.9%).
Figure 2.
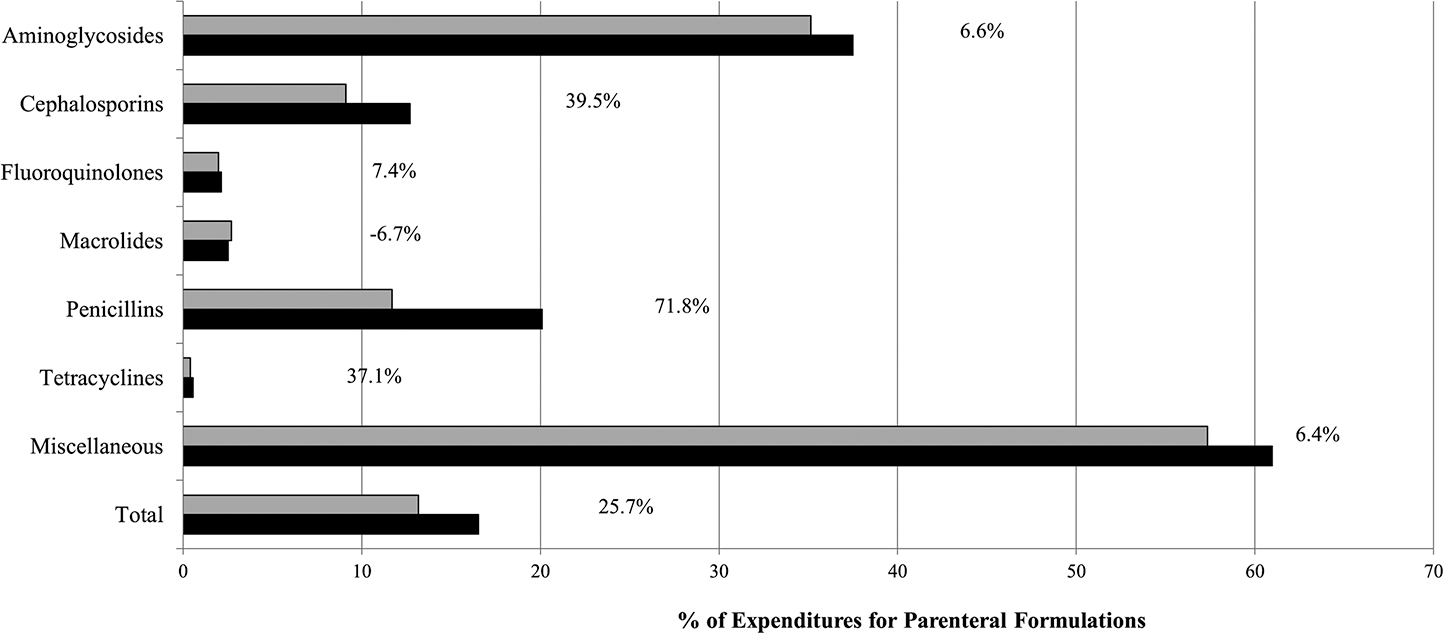
Annual proportion of antibiotic expenditures and percentage growth for parenteral formulations overall and by class in the community, 2014 (solid light gray) and 2015 (solid black). Community is defined as community pharmacies, mail order pharmacies, and clinics. For this analysis, oxazolidinones were grouped with the miscellaneous class.
DISCUSSION
We identified a downward trend in antibiotic expenditures from 2010 through 2015. The majority (59%) of expenditures were in the community, most often community pharmacies. While our previous analysis reported quinolones as the top medication class by expenditure [23], the miscellaneous category and tetracyclines represented the majority of expenditures overall in this analysis. The rise in expenditures for the tetracycline class found in our study was likely due to January 2013 doxycycline manufacturing issues leading to limited availability and an increase in wholesale cost [25, 26]. However, after manufacturing issues were resolved, high doxycycline purchase costs and thus, expenditures persisted into 2015 [27, 28]. These continued high purchase costs are under investigation [27, 28]. Quinolones had the most dramatic decrease in expenditures over the study period, decreasing by 91.0% (from $2.2 billion in 2010 to $272.4 million in 2015). This decrease was likely secondary to levofloxacin and moxifloxacin losing their United States patents in 2011 with generic formulations available at lower costs [29]. A small number of antibiotics comprised a significant proportion of expenditures. By expenditure, the top 5 agents (doxycycline, daptomycin, linezolid, minocycline, and piperacillin-tazobactam) comprised 40% of overall antibiotic expenditures. In the outpatient, other nonretail, and nonfederal hospital settings, the top 5 agents comprised >50% of expenditures in each of these healthcare settings.
Decreasing community expenditures for antibiotics in 2015, as compared with 2010, are consistent with national data showing decreased antibiotic prescribing in the community, though on a smaller scale [30, 31]. In this study, antibiotic expenditures from community pharmacies were reduced by more than one-third. While the decreases in overall antibiotic prescribing are not on par with the decreasing expenditures, and cannot be directly linked to one another, our results may be an early indicator that national stewardship initiatives are improving outpatient antibiotic prescribing. Regardless, community pharmacies still represented the majority of antibiotic expenditures and, therefore, outpatient stewardship efforts should remain a priority. While other studies have reported increases in total hospital medication expenditures [15, 22], our results demonstrate nonsignificant decreases in nonfederal hospital antibiotic acquisition expenditures.
Overall antibiotic expenditures decreased, but antibiotic expenditures in clinics and mail service pharmacies increased significantly, nearly doubling over the study period. These increases, combined with increased tetracycline expenditures, are likely the primary factors driving the increase in 2013 overall antibiotic expenditures. A sensitivity analysis removing doxycycline expenditures from total expenditures found that overall expenditures would have decreased by an additional 3.9% (16.6% in the original analysis vs 20.5% in the sensitivity analysis). Increases in clinic and mail service pharmacy antibiotic expenditures is consistent with total medication expenditure data, which demonstrated 13% and 24% increases, respectively, in 2014 and 2013. Increased antibiotic expenditures from mail service pharmacies could be a reflection of increasing use of the mail service pharmacy sector to fill prescriptions for chronic use of antibiotics for acne and other indications. Clinic expenditures represent clinic-administered medications (intravenous, directly observed therapy, associated with a procedure) and may indicate increasing use of OPAT. In addition, urgent care centers were included in the clinic category and may similarly administer parenteral medications. The rapid expansion of urgent care centers may be another factor driving antibiotic expenditures in this category.
Although data are limited, it has been suggested that the use of OPAT is increasing [32]. Our results indicate that although overall antibiotic expenditures decreased, community expenditures for parenteral formulations increased. Increasing community parenteral formulation expenditures are likely explained by increased prescribing of OPAT. Many of the agents comprising the majority of OPAT expenditures were also the top agents in nonfederal hospitals. This likely indicates continuation of antibiotic therapy initiated in the acute care setting postdischarge. Studies have estimated that 34%–41% of OPAT courses are inappropriate, specifically excessive durations and failure to use effective oral agents [33, 34]. There are likely opportunities to implement antibiotic stewardship interventions at the time of hospital discharge focused on OPAT.
Our results are not without limitations. Our data source captured >90% of all medication expenditures; approximately 10% of expenditures are extrapolated to provide estimates of total US expenditures. However, we would not expect the small proportion of extrapolated estimates to have a major impact on our conclusions. In addition, Veterans Affairs (VA) data were not available for 2 (2014–2015) of the 6 years of the study period. Previous analyses have found that these missing data did not significantly impact conclusions regarding overall medication expenditures [15, 18]. However, for our analyses, the growth observed in the other nonretail sector was likely greater than our results indicate without data from VA facilities. The change in generic availability of a product, medication shortages, and inflation also likely had an impact on our findings. Adjusting results for inflation to 2015 dollars, expenditures decreased by 22.8% (compared with 16.6%). In addition, intravenous drugs are significantly more expensive than oral formulations [35]. Antibiotic expenditures are not an accurate proxy of use by setting, as intravenous antibiotics are typically more expensive than oral antibiotics and are much more commonly used in hospitals.
In other countries with comprehensive prescription data, most (approximately 90%) antibiotic use is in the community [36, 37]. This is similar to our findings using US expenditure data where the majority of antibiotic expenditures were in the community. A recent report describing antibiotic use in medical clinics and emergency rooms in the United States estimated that at least 30% of antibiotics prescribed in community settings are unnecessary [3], highlighting a great need for improvement. The reductions in antibiotic expenditures reported here may also reflect decreases in antibiotic use due to antibiotic stewardship. National population-level data from antibiotic prescriptions dispensed in the community indicate decreases in population-based antibiotic prescription rates in 2011 and 2014 [31, 38]. Thus, this decrease in antibiotic use partially explains decreased expenditures observed in the community from 2010 to 2015 [31, 38]. National stewardship efforts focused on community settings have been increasing in the United States. This includes a national goal to decrease unnecessary antibiotic prescribing, measure outpatient antibiotic use, identify core elements essential for outpatient stewardship, and provide stewardship resources and educational opportunities [3, 38–40].
CONCLUSIONS
Antibiotic expenditures decreased from 2010 through 2015. The majority of antibiotic expenditures were associated with the community. Decreases in community expenditures are consistent with national decreases in outpatient antibiotic use. Increasing expenditures for OPAT may be an indication of limited oral treatment options for infections caused by multidrug-resistant organisms. These results suggest an opportunity for additional cost savings with the increase focus on antibiotic stewardship in all healthcare settings, especially in the community and at the time of hospital discharge.
Supplementary Material
Acknowledgments.
This work used the QuintilesIMS National Health Sales Perspective database, January 2010–December 2015, QuintilesIMS Inc. All rights reserved. A component of the manuscript was presented in poster format at the Infectious Diseases Society of America Annual Meeting in San Diego, California, in October 2015 (Abstract #146).
Footnotes
Potential conflicts of interest. R. J. H. and L. M. M. are employees of QuintilesIMS. G. T. S. has served as a consultant or on advisory boards for AbbVie, Astellas, and CSL Behring for Dr Schumock in the past 3 years, but not for topics involving antimicrobials. All other authors report no potential conflicts. All authors have submitted the ICMJE Form for Disclosure of Potential Conflicts of Interest. Conflicts that the editors consider relevant to the content of the manuscript have been disclosed.
Disclaimer. The statements, findings, conclusions, and views contained and expressed herein are those of the authors and do not necessarily represent the views of the US government, the Department of Veterans Affairs, the Centers for Disease Control and Prevention, or QuintilesIMS Inc or any of its affiliated or subsidiary entities.
Presented in part: Infectious Diseases Society of America Annual Meeting, San Diego, California, October 2015. Poster 146.
Supplementary Data
Supplementary materials are available at Clinical Infectious Diseases online. Consisting of data provided by the authors to benefit the reader, the posted materials are not copyedited and are the sole responsibility of the authors, so questions or comments should be addressed to the corresponding author.
References
- 1.Davey P, Brown E, Charani E, et al. Interventions to improve antibiotic prescribing practices for hospital inpatients. Cochrane Database Syst Rev 2013; 4:CD003543. [DOI] [PubMed] [Google Scholar]
- 2.Filice G, Drekonja D, Greer N, et al. Antimicrobial stewardship programs in inpatient settings: a systematic review. VA-ESP Project #09-009. Washington, DC: Department of Veterans Affairs, 2013. [PubMed] [Google Scholar]
- 3.Fleming-Dutra KE, Hersh AL, Shapiro DJ, et al. Prevalence of inappropriate antibiotic prescriptions among U.S. ambulatory care visits, 2010–2011. JAMA 2016; 315:1864–73. [DOI] [PubMed] [Google Scholar]
- 4.Hecker MT, Aron DC, Patel NP, Lehmann MK, Donskey CJ. Unnecessary use of antimicrobials in hospitalized patients: current patterns of misuse with an emphasis on the antianaerobic spectrum of activity. Arch Intern Med 2003; 163:972–8. [DOI] [PubMed] [Google Scholar]
- 5.Fridkin S, Baggs J, Fagan R, et al. ; Centers for Disease Control and Prevention (CDC). Vital signs: improving antibiotic use among hospitalized patients. MMWR Morb Mortal Wkly Rep 2014; 63:194–200. [PMC free article] [PubMed] [Google Scholar]
- 6.Shehab N, Patel PR, Srinivasan A, Budnitz DS. Emergency department visits for antibiotic-associated adverse events. Clin Infect Dis 2008; 47:735–43. [DOI] [PubMed] [Google Scholar]
- 7.Jacob JT, Gaynes RP. Emerging trends in antibiotic use in US hospitals: quality, quantification and stewardship. Expert Rev Anti Infect Ther 2010; 8:893–902. [DOI] [PubMed] [Google Scholar]
- 8.Costelloe C, Metcalfe C, Lovering A, Mant D, Hay AD. Effect of antibiotic prescribing in primary care on antimicrobial resistance in individual patients: systematic review and meta-analysis. BMJ 2010; 340:c2096. [DOI] [PubMed] [Google Scholar]
- 9.Spellberg B, Guidos R, Gilbert D, et al. ; Infectious Diseases Society of America. The epidemic of antibiotic-resistant infections: a call to action for the medical community from the Infectious Diseases Society of America. Clin Infect Dis 2008; 46:155–64. [DOI] [PubMed] [Google Scholar]
- 10.Centers for Disease Control and Prevention. Antibiotic resistance threats in the United States, 2013. Available at: https://www.cdc.gov/drugresistance/threat-report-2013/. Accessed 1 June 2017.
- 11.Doron S, Nadkarni L, Lyn Price L, et al. A nationwide survey of antimicrobial stewardship practices. Clin Ther 2013; 35:758–65.e20. [DOI] [PubMed] [Google Scholar]
- 12.Dellit TH, Owens RC, McGowan JE Jr, et al. ; Infectious Diseases Society of America; Society for Healthcare Epidemiology of America. Infectious Diseases Society of America and the Society for Healthcare Epidemiology of America guidelines for developing an institutional program to enhance antimicrobial stewardship. Clin Infect Dis 2007; 44:159–77. [DOI] [PubMed] [Google Scholar]
- 13.Pollack LA, Srinivasan A. Core elements of hospital antibiotic stewardship programs from the Centers for Disease Control and Prevention. Clin Infect Dis 2014; 59(suppl 3):S97–100. [DOI] [PMC free article] [PubMed] [Google Scholar]
- 14.President’s Council of Advisors on Science and Technology. Report to the President on combating antibiotic resistance. The White House website. 2015. Available at: https://www.whitehouse.gov/sites/default/files/microsites/ostp/PCAST/pcast_amr_jan2015.pdf. Accessed 1 June 2017.
- 15.Schumock GT, Li EC, Suda KJ, et al. National trends in prescription drug expenditures and projections for 2015. Am J Health Syst Pharm 2015; 72:717–36. [DOI] [PubMed] [Google Scholar]
- 16.Cuckler GA, Sisko AM, Keehan SP, et al. National health expenditure projections, 2012–22: slow growth until coverage expands and economy improves. Health Aff (Millwood) 2013; 32:1820–31. [DOI] [PubMed] [Google Scholar]
- 17.Hoffman JM, Doloresco F, Vermeulen LC, et al. Projecting future drug expenditures—2010. Am J Health Syst Pharm 2010; 67:919–28. [DOI] [PubMed] [Google Scholar]
- 18.Schumock GT, Li EC, Suda KJ, et al. National trends in prescription drug expenditures and projections for 2014. Am J Health Syst Pharm 2014; 71:482–99. [DOI] [PubMed] [Google Scholar]
- 19.Hoffman JM, Li E, Doloresco F, et al. Projecting future drug expenditures in U.S. nonfederal hospitals and clinics—2013. Am J Health Syst Pharm 2013; 70:525–39. [DOI] [PubMed] [Google Scholar]
- 20.Hoffman JM, Li E, Doloresco F, et al. Projecting future drug expenditures—2012. Am J Health Syst Pharm 2012; 69:405–21. [DOI] [PubMed] [Google Scholar]
- 21.Doloresco F, Fominaya C, Schumock GT, et al. Projecting future drug expenditures: 2011. Am J Health Syst Pharm 2011; 68:921–32. [DOI] [PubMed] [Google Scholar]
- 22.Schumock GT, Li EC, Suda KJ, et al. National trends in prescription drug expenditures and projections for 2016. Am J Health Syst Pharm 2016; 73:1058–75. [DOI] [PubMed] [Google Scholar]
- 23.Suda KJ, Hicks LA, Roberts RM, Hunkler RJ, Danziger LH. A national evaluation of antibiotic expenditures by healthcare setting in the United States, 2009. J Antimicrob Chemother 2013; 68:715–8. [DOI] [PubMed] [Google Scholar]
- 24.Boardman C; IMS Health Incorporated. System and method for estimating product distribution using a product specific universe. US Patent No. 7,174,304. 2007.
- 25.Centers for Disease Control and Prevention Health Advisory. Nationwide shortage of doxycycline: resources for providers and recommendations for patient care. 2013. Available at: https://emergency.cdc.gov/han/han00349.asp. Accessed 1 June 2017.
- 26.Quadri F, Mazer-Amirshahi M, Fox ER, et al. Antibacterial drug shortages from 2001 to 2013: implications for clinical practice. Clin Infect Dis 2015; 60:1737–42. [DOI] [PubMed] [Google Scholar]
- 27.Langreth R Rigging charge exposes one reason for inexplicable drug pricing. Bloomberg. 2016. Available at: https://www.bloomberg.com/news/articles/2016-12-16/rigging-charge-exposes-fish-tale-behind-high-antibiotic-prices. Accessed 1 June 2017. [Google Scholar]
- 28.Schoenberg T, McLaughlin D, Pearson S. U.S. generic drug probe seen expanding after guilty pleas. Bloomberg: 2016. Available at: https://www.bloomberg.com/news/articles/2016-12-14/u-s-files-first-charges-in-generic-drug-price-fixingprobe. Accessed 9 September 2017. [Google Scholar]
- 29.Medscape. FDA approves first generic versions of levofloxacin. 2011. Available at: http://www.medscape.com/viewarticle/745007. Accessed 1 June 2017.
- 30.Suda KJ, Hicks LA, Roberts RM, Hunkler RJ, Taylor TH. Trends and seasonal variation in outpatient antibiotic prescription rates in the United States, 2005 to 2010. Antimicrob Agents Chemother 2014; 58:2763–6. [DOI] [PMC free article] [PubMed] [Google Scholar]
- 31.Hicks LA, Bartoces MG, Roberts RM, et al. US outpatient antibiotic prescribing variation according to geography, patient population, and provider specialty in 2011. Clin Infect Dis 2015; 60:1308–16. [DOI] [PubMed] [Google Scholar]
- 32.Gordon SM, Shrestha NK, Rehm SJ. Transitioning antimicrobial stewardship beyond the hospital: the Cleveland Clinic’s community-based parenteral anti-infective therapy (CoPAT) program. J Hosp Med 2011; 6(suppl 1):S24–30. [DOI] [PubMed] [Google Scholar]
- 33.Goldman JL, Richardson T, Newland JG, et al. Outpatient parenteral antimicrobial therapy in pediatric Medicaid enrollees. J Pediatric Infect Dis Soc 2017; 6:65–71. [DOI] [PMC free article] [PubMed] [Google Scholar]
- 34.Spivak ES, Kendall B, Orlando P, et al. Evaluation of outpatient parenteral antimicrobial therapy at a Veterans Affairs hospital. Infect Control Hosp Epidemiol 2015; 36:1103–5. [DOI] [PubMed] [Google Scholar]
- 35.Davey P, Parker S. Cost effectiveness of once-daily oral antimicrobial therapy. J Clin Pharmacol 1992; 32:706–10. [DOI] [PubMed] [Google Scholar]
- 36.European Centre for Disease Prevention and Control. Annual epidemiological report 2014. Antimicrobial resistance and healthcare-associated infections. Stockholm: ECDC, 2014. [Google Scholar]
- 37.Swedish Veterinary Antimicrobial Resistance Monitoring. Swedres-Svarm report summary 2014. Available at: http://www.sva.se/en/antibiotics-/svarm-reports. Accessed 1 June 2017.
- 38.Centers for Disease Control and Prevention. Outpatient antibiotic prescriptions—United States, 2014. Available at: https://www.cdc.gov/getsmart/community/pdfs/annual-reportsummary_2014.pdf. Accessed 1 June 2017.
- 39.Sanchez GV, Fleming-Dutra KE, Roberts RM, Hicks LA. Core elements of outpatient antibiotic stewardship. MMWR Recomm Rep 2016; 65:1–12. [DOI] [PubMed] [Google Scholar]
- 40.Centers for Disease Control and Prevention. Get smart: know when antibiotics work. Available at: https://www.cdc.gov/getsmart/community/programs-measurement/national-activities/antibiotics-work.html. Accessed 23 July 2017.
Associated Data
This section collects any data citations, data availability statements, or supplementary materials included in this article.