

Abstract
Cultural priming studies frequently employ non-validated, stereotypical images. Here, we select images to separately evoke two cultural mindsets: Hispanic and US-American. Spanish-English bilinguals identifying as Hispanic/Latino (N=149) rated 50 images online for their cultural and emotional evocation. Based on relative cultural identification, cultural “delegate” (strongly US-American, strongly Hispanic, balanced bicultural) subsamples’ ratings were averaged to isolate particularly salient images. Image ratings were compared across respondents’ national origins. Ratings of seven selected pairs of content-matched Hispanic and US-American primes were compared across the full sample. High discrimination across cultural mindsets and positive emotion ratings were maintained regardless of various demographic factors. Thus, we provide empirical justification for incorporating these stimuli, individually or as sets, within cultural priming studies among Hispanic/Latino samples.
Keywords: Hispanic/Latino, cultural frame switching, Spanish-English, bilingual, cultural priming
Introduction:
Culture serves as a roadmap to the social world, guiding our interactions, behaviors, and interpretations of the environment. Cross-cultural experiments comparing culturally distinct samples (Son et al., 2010; Soto et al., 2011), have offered critical insight into cultural influences on cognitive and behavioral processes; however, their quasi-experimental nature (i.e. no random assignment, environmental confounds) inhibits drawing causal inferences about culture’s role in the observed effects (Oyserman & Lee, 2008). The theoretical framework of cultural frame switching (CFS) circumvents such limitations by studying culture as networks of associated concepts which dynamically guide cognition (Hong et al., 2000), allowing experimental manipulation of cultural “frames” (“mindsets” throughout this paper) within and across individuals via cultural priming (Aydinli & Bender, 2015; Hong et al., 2000). As CFS research grows in popularity, empirically validated stimuli for priming specific cultures are lacking. Thus, the present study identifies priming images to activate the distinct cultural mindsets of self-described Hispanic and/or Latino residents of the United States (“US” hereafter). Since both cultural mindsets and bicultural identification have been tied to language use (Chen, 2015; Rodríguez-Arauz et al., 2017; Schroeder et al., 2017), we specifically surveyed Spanish-English bilinguals, operationalizing the cultural mindsets of interest as those which participants separately associate with the English- and Spanish-speaking sides of their identity.
CFS research characterizes culture’s dynamic influences on multicultural individuals’ thoughts and behaviors (Aydinli & Bender, 2015). Specific cultural mindsets are activated by exposing multicultural individuals to culturally salient stimuli: e.g. cultural icons (Benet-Martínez et al., 2002; Verkuyten & Pouliasi, 2002), languages (Kemmelmeier & Cheng, 2004; Lechuga, 2008), or stories (Chiao et al., 2010). CFS experiments demonstrate that cultural mindset can causally influence outcomes including biculturals’ attributional styles (Hong et al., 2000; Kreitler & Dyson, 2016), descriptions of known persons and groups (Morris & Mok, 2011), and neural representations of self and other (Chiao et al., 2010; Ng et al., 2010). These studies emphasize culture’s substantial power to shape cognitive processing, not only across societies, but within individuals.
Hispanic/Latino bilinguals represent an ideal population in which to study how cultural mindsets shape cognition. Those categorized as “Hispanic/Latino” represent the largest and fastest growing segment of the US population, comprising nearly two-thirds of US bilinguals (40+ million people; U.S. Census Bureau, 2017). Despite their sizeable presence, compared to CFS studies focused on East-West cultural dichotomies (e.g. Hong et al., 2000; Morris & Mok, 2011; Ng et al., 2010), relatively little CFS research is dedicated to US Hispanics/Latinos. While conglomerating diverse national and cultural identities under this panethnic label has been rightfully scrutinized (e.g. (Jones-Correa & Leal, 1996), a nationally representative survey of 1200+ Hispanic/Latino adults found that a substantial minority (~30%) endorse this panethnic cultural perspective (Taylor et al., 2012). Moreover, they express connection via language, with 82% speaking Spanish and 95% saying Spanish is important for future generations (Taylor et al., 2012). As language manipulations can promote culturally-congruent shifts in behavior and cultural schemas among Spanish-English bilinguals (Lechuga & Wiebe, 2009; Ramírez-Esparza et al., 2008; Rodríguez-Arauz et al., 2017), we define the cultural mindsets of interest in relation to more widely shared associations with the English (“US-American” culture) and Spanish (“Hispanic” culture) languages.
The cultural heterogeneity encompassed by the term “Hispanic/Latino” presents a particular challenge for CFS studies within this population. This cultural diversity has previously been controlled by limiting samples to Mexican-Americans (Kreitler & Dyson, 2016; Lechuga, 2008). However, this approach inherently excludes one-third of US Hispanics/Latinos (~19.2 million people) from CFS research (U.S. Census Bureau, 2017). Recognizing that research targeting other specific bicultural identities (e.g. Colombian-Americans) is often not feasible, we highlight that certain cultural values such as religious engagement, familism (Rivera et al., 2008; Taylor et al., 2012) or simpatía (Holloway et al., 2009; Rodríguez-Arauz et al., 2019) are more frequently endorsed among Hispanics/Latinos than the general US population. While particular images may hold varying degrees of cultural salience depending on one’s national origin, they can still invoke the broader cultural schemas, unifying diverse portions of the Hispanic/Latino population, which are activated by the Spanish language among bilinguals (Rodríguez-Arauz et al., 2017). Furthermore, as strong emotional responses are shown to stimulate associations across concepts in cognitive priming studies (Storbeck & Clore, 2008), emotionally evocative images with general “Hispanic/Latino” salience may successfully activate wider personal associations with the relevant mindset. As the term “Hispanic/Latino” continues to function as one cultural/ethnic category across institutions, we hope that developing primes which are culturally salient across diverse Hispanics/Latinos will encourage their inclusion in CFS studies.
Priming with cultural icons is a common and generally efficient approach in CSF studies. Among Mexican-American bilinguals, language and image priming techniques both produce culturally-congruent alterations in self-construal, acculturation measures, or attribution styles, but image priming accounts for greater variance in these cognitive outcomes than language manipulations (Kreitler & Dyson, 2016; Lechuga, 2008). Hence, many researchers hold language constant while influencing mindset with culturally evocative images (e.g. Chattaraman et al., 2010; Hong et al., 2000; Morris & Mok, 2011). This icon viewing strategy has produced significant CFS effects among Asian American (Benet-Martínez et al., 2002; Morris & Mok, 2011), westernized Hong Kong Chinese (Ng et al., 2010), and Mexican American samples (Kreitler & Dyson, 2016; Lechuga, 2008). We are aware of only one CFS study using culturally iconic images in a broader Hispanic/Latino sample, which revealed cultural priming effects on brand preferences, moderated by acculturation. Specifically, purchasing intentions of “balanced biculturals” showed priming-consistent changes while “mainstream-dominant” and “Hispanic-dominant” individuals’ preferences were less sensitive to cultural priming (Chattaraman et al., 2010).
Despite the pervasiveness of cultural icons in CFS studies, empirical research developing standardized, validated priming sets for Hispanic/Latino samples is needed. One foundational CFS study (Hong et al., 2000) cited prior research for selecting some (not all) of their primes. However, subsequent studies often cite this research as justification for using any cultural icons as primes, without addressing their particular images’ validity or comparability (Kreitler & Dyson, 2016; Verkuyten & Pouliasi, 2002). Other CSF studies simply employ stereotypical images without any explicit rationale (e.g. Lechuga, 2008; Morris & Mok, 2011). Chattaraman et al. (2010) conducted pilot studies to establish efficacy of their cultural primes; however, their images were selected based on “interviews with two triads of Hispanic/Latino students”. While representative of their follow-up sample from the same university, such a small group is hardly characteristic of the diverse US Hispanic/Latino population. Thus, these studies highlight the need for empirical stimulus development incorporating a range of Hispanic/Latino participants.
Here we expand upon the pilot study used to select cultural primes described by Ng and Lai (2009), in which a bicultural sample nominated images across distinct domains (e.g. food, famous characters). We aimed to 1) identify images with high emotional salience and roughly equivalent evocation of “Hispanic” and “US-American” culture, 2) compare rating patterns for those images across a sample of US Hispanics/Latinos with diverse cultural orientations and regional origins, and 3) develop content-matched sets of priming images for each cultural mindset. The goal of these priming sets is to maintain high evocation and cultural distinction regardless of national origin, time in the US, or other culturally-relevant individual differences.
Methods:
Participants:
Survey respondents meeting our demographic criteria within Qualtrics’ database of research participants were emailed links to the online survey; in total, 185 people completed the survey. As the survey was administered in English, bilingualism was assessed with translations (English to Spanish, Spanish to English) and Spanish multiple choice questions containing grammatical structures which are frequently mistranslated by online resources (e.g. Google Translate). All Spanish language questions needed to be answered correctly and translations needed to show sufficient understanding of the sentence content for respondents to be included in the final sample. Additionally, answers were visually inspected for patterned responding and time per question. Respondents who did not demonstrate bilingual fluency, rated all images the same, or responded too quickly to have read the questions (<10 seconds/image) were removed from the final sample (N=33). Additionally, responses from three participants from Spain were removed to allow us to specifically target our stimuli toward biculturals of Latin American ancestry. Respondents provided informed consent before the survey and were compensated after. All procedures were approved by the Institutional Review Board of the home institution.
The present sample includes responses from 149 (116 female) Spanish-English bilinguals ages 18-55 (mean 38.0±9.4 years) living in the US. Power calculations, conducted with G*Power (Erdfelder et al., 1996), revealed that this sample size was sufficient to detect effects of two-tailed paired t-tests of Cohen’s d ≥0.23 with power of 0.80 at α=0.05. All respondents self-identified as Hispanic (N=96) and/or Latino/a (N=85); 32 respondents endorsed both terms. The majority (N=107) identified their race only as White (see Table 1 for full sample). Respondents were primarily born in the US, Puerto Rico, and Mexico, with the remainder originating from various Latin American nations (Table 2). This distribution is moderately representative of the US Hispanic/Latino population, with Puerto Ricans and Mexicans being the largest immigrant groups (Figure S1). Socioeconomic data was not collected.
Table 1:
Ethnic and Racial Identification of respondents
| Ethnic Identification | N | %a |
|---|---|---|
| Hispanic | 96 | 64.4% |
| Latino | 86 | 57.1% |
| Racial Identification | ||
| American Indian | 5 | 3.4% |
| Asian | 2 | 1.3% |
| Native Hawaiian or Pacific Islander | 2 | 1.3% |
| Black | 5 | 3.4% |
| White | 112 | 75.2% |
| Not Reported | 5 | 3.4% |
| Other | 25 | 16.8% |
| Mixed | 10 | 6.7% |
| “Hispanic” or “Latino” | 6 | 4.0% |
| Specific Nationality | 7 | 4.7% |
Percentages sum to more than 100% because respondents could select all ethnic and racial groups with which they identified.
Table 2:
National origin and ancestry of all respondents
| Grouped Category | Nation | By Birth | By Ancestrya | ||
|---|---|---|---|---|---|
| N | % | Nb | % | ||
| United States | United States | 50 | 33.6% | ---- | ------- |
| Puerto Rico | Puerto Rico | 32 | 21.5% | 37 | 24.8% |
| Mexico | Mexico | 23 | 15.4% | 36 | 24.2% |
| MIXED | ---------------- | ----- | ------- | 19 | 12.8% |
| South America | Argentina | 6 | 4.0% | 7 | 4.7% |
| Brazil | 0 | 0% | 1 | 0.7% | |
| Chile | 1 | 0.7% | 1.5 | 1.0% | |
| Colombia | 8 | 5.4% | 10.5 | 7.0% | |
| Ecuador | 2 | 1.3% | 2 | 1.3% | |
| Peru | 2 | 1.3% | 2 | 1.3% | |
| Venezuela | 5 | 3.4% | 7 | 4.7% | |
| TOTAL | 24 | 16.1% | 30 | 20.1% | |
| Other | Costa Rica | 1 | 0.7% | 2 | 1.3% |
| Cuba | 4 | 2.7% | 5 | 3.4% | |
| Dominican Republic | 6 | 4.0% | 7 | 4.7% | |
| El Salvador | 4 | 2.7% | 6 | 4.0% | |
| Guatemala | 0 | 0% | 1 | 0.7% | |
| Honduras | 2 | 1.3% | 3 | 2.0% | |
| Nicaragua | 1 | 0.7% | 1 | 0.7% | |
| Panama | 2 | 1.3% | 2 | 1.3% | |
| TOTAL | 20 | 13.4% | 27 | 18.1% | |
Those respondents born in the US were placed into a specific ancestry category if both parents were born in one region or all grandparents were born in one region. Those with parents or grandparents from different regions were placed in the “mixed” category.
Decimals represent respondents whose parents were from two countries within the same region (i.e. one respondent born in the US to one Colombian and one Chilean parent was placed in the South American ancestry group)
Initial Image Selection:
Licenses for all images used in this survey (except one) were acquired from Shutterstock. Search terms for ostensibly Hispanic images and images themselves were selected based on recommendations of representative symbols provided by 13 bilingual informants from various Latin American countries: Argentina, Chile, Colombia, Cuba, Dominican Republic, Mexico, Peru, and Venezuela. Final search terms and images were restricted to recommendations independently repeated across informants. Since the popular South American comic book character “Condorito” was not available from Shutterstock, the survey included a photo taken by one of the authors (MG) in Valparaiso, Chile. Given the demographic diversity we attempted to represent among Hispanic images, these stimuli were selected first. Ostensibly US-American images were chosen to match content domains of Hispanic images (e.g. historical figures, food) while remaining evocative of US-American culture. Shutterstock license numbers, citations, descriptive titles, and general content domains for all images seen by respondents are available via Open Science Framework (Gianola et al., 2020) (https://mfr.osf.io/render?url=https://osf.io/s6ruk/?direct%26mode=render%26action=download%26mode=render).
Online Survey Procedure:
After consenting, respondents completed four sets of questions: 1) demographic information, 2) language usage and Spanish fluency check, 3) image rating (the majority of the survey), and 4) general responses to the survey.
In the demographics section, respondents provided their age, gender, national origin and that of their parents and grandparents, etc. During the language usage section, respondents estimated the percent of each day spent using English, Spanish, and other languages, then rated their preference for multiple terms used to describe themselves (e.g. “Latino/a”, “Hispanic American”, “US-American”, etc.). The terms “Hispanic” and “US-American”, selected by a plurality of respondents as their preferred identifiers (Figure S2), are used throughout this article to refer to cultural mindsets associated with Spanish and English, respectively. However, each respondent’s highest rated ‘US-American’ and ‘Hispanic’1 terms were displayed when referring to each culture; hence respondents rated images in relation to cultural terms they identify with. Respondents then completed translation and fluency verification questions assessing bilingual competence.
Before beginning the image rating, respondents read statements specifically outlining the groups and concepts referred to by ‘US-American’ and ‘Hispanic’ culture. These descriptions emphasized that references to ‘Hispanic’ culture related to Spanish-speaking people from the Americas and their descendants, while ‘US-American’ culture referred to English-speaking people of European ancestry within the US (Figure S3).
During the majority of the survey, respondents rated one image at a time based on specific characteristics: 1) how well the image represented their ‘US-American’ cultural identity (“0: Not at all”; “100: Extremely well”), 2) how well it represented their ‘Hispanic’ cultural identity (“0: Not at all”; “100: Extremely well”), 3) the strength of their emotional response to the image (“0: Extremely weak”; “100: Extremely strong”), 4) how positive or negative their emotions were regarding the image (“−50: Extremely negative”; “50: Extremely positive”), and 5) the cultural group with which they generally associate the image (categorical selection: ‘Hispanic’, ‘US-American’, neither, both). This process was repeated for 50 total images, 25 ostensibly depicting each culture. Questions 1-4 characterize each image’s evocation of an individual’s self-schema for the relevant culture (Rodríguez-Arauz et al., 2017), while question 5 asks whether the image fits wider societal associations with the target culture.
After rating all images, respondents were asked if, as a whole, the images they saw in the survey were representative of each culture (two separate questions), and whether “‘Hispanics’/’US-Americans’ can be thought of as having a single culture” (separate questions; “strongly disagree” to “strongly agree”). Finally, respondents were thanked for their participation and compensated.
Aim 1: Cultural Prime Identification
Data were quality screened via inspection of free response and translation questions, time spent per question, and patterned responding (e.g. marking 0’s for every image) in R (R Core Team, 2017). Respondents’ representation ratings for each image were subtracted (target culture minus non-target culture rating) to create one “cultural differentiation score” per image per subject (−100: represents non-target culture extremely well while not representing target at all; 100: represents target culture extremely well while not representing non-target at all). Responses to emotional strength and valence questions were multiplied and rescaled to create one “total emotion score” per image per subject (0: no emotional response to 100: strongly positive emotional response). Unless otherwise noted, all images discussed were rated with positive valence; higher “total emotion scores” therefore reflect greater positive emotional responses.
Target and non-target culture representation ratings were compared for each image with paired t-tests; all but two images (H20, H22) showed significantly higher target vs non-target culture ratings. We then averaged ratings of 1) target culture representation 2) non-target culture representation, 3) cultural differentiation, 4) total emotion, and 5) general cultural categorization across the full sample, producing mean scores for all 50 images. Images consistently rated as more personally evocative of the target culture (i.e. average cultural differentiation scores ≥35) and categorized as depicting only the target culture by a clear majority of respondents (≥60%) were flagged as “potential primes”. As negative affect can inhibit semantic priming (Storbeck & Clore, 2008), we removed two Hispanic images with negative emotional valence and the two remaining US-American images with the lowest emotion scores. This process resulted in 17 US-American and 13 Hispanic potential primes which were compared across subsamples.
Aim 2: Rating Comparisons Across Subsamples
We sought to confirm that “potential primes” were considered representative by individuals who interact regularly with the depicted culture. Current language exposure, time in host country, and affirmation of ethnic labels have all shown relevant relationships with cultural identification (Blackledge & Pavlenko, 2001; Duan & Vu, 2000; Kiang et al., 2011; Schroeder et al., 2017). Thus, from our available data, we combined three factors to create a proxy for respondents’ proximity to Hispanic or US-American culture: 1) relative daily language usage: 0—100% Spanish usage, 1—100% English usage; 2) proportion of life spent in the US: 0—no time, 1—native born; and 3) relative endorsement of terms distinct to each culture: 0—complete endorsement of Hispanic terms and no endorsement of US-American terms, 1—complete endorsement of US-American terms and no endorsement of Hispanic terms. These variables were calculated as follows:
%English Use / (%English Use + %Spanish Use)
Time in US / Age
[(Endorsement of “American” + “US-American”) – (Endorsement of “Hispanic” + “Latino/a”) + 200] / 4002
These factors were weighted (2.25, 1.75 and 1.00 respectively) and combined to calculate each respondent’s “cultural index”, ranging from 0 (more Hispanic) to 5 (more US-American). These relative weights were based on these variables’ effect sizes on cultural identity estimated from prior studies (e.g. Duan & Vu, 2000; Schroeder et al., 2017). Since the relationship between ethnic label endorsement and cultural identity can be influenced by external factors including language proficiency (Kiang et al., 2011), this factor’s weight was reduced in favor of language usage. Respondents with the 50 lowest and 50 highest cultural indices were chosen as “delegates” representing Hispanic and US-American culture, respectively. The remaining 49 respondents served as “balanced bicultural delegates”. Ratings on potential primes were averaged across delegate sets for the relevant culture and compared against the full sample, to assist in identifying images seen as evocative across a range of cultural identifications.
Additionally, respondents were grouped based on their birth region: US, Puerto Rico, Mexico, South America, Other. As continuous image ratings were not normally distributed, metrics for each potential prime were compared across birth groups via Kruskal-Wallis tests (non-parametric ANOVA alternative). Categorization of the culture generally depicted by each image were compared across groups with chi-square tests. As certain options (e.g. neither, non-target) showed low selection frequencies, these categorizations were grouped as selection of the target culture or not (i.e. neither, both, or non-target).
Aim 3: Priming Set Development and Characterization:
From the potential primes selected in Aim 1, we chose subsets with domain matched content for each cultural mindset. Expecting that greater cultural identification reflects greater knowledge of and preference for symbols of that culture (Chattaraman et al., 2010; Kang & Kim, 2012), we considered images which target culture delegates rated representative of that culture (70+ out of 100) and well distinguished from the non-target culture (≥45 differentiation score). Additionally, images needed to demonstrate high target culture representation and total emotion ratings among balanced biculturals (i.e. those who regularly interact with both cultural mindsets) and across birth groups. Eight Hispanic images and thirteen US-American images fit these criteria. From these, seven Hispanic and seven US-American cultural priming images (“primes” hereafter) with roughly matching content were selected to comprise the final stimulus set (Figure 1).
Figure 1:

Final selected cultural primes to represent a) Hispanic and b) US-American culture. Images are arranged with content-matched pairs in the same relative positions in a) and b)
Across each content-matched image pair, separate paired samples t-tests were conducted comparing the full sample’s ratings of 1) target culture representation 2) non-target culture representation, 3) cultural differentiation, and 4) total emotion. Respondents’ categorizations of the culture generally depicted by each prime were compared using χ2 tests. Additionally, each respondent’s ratings for the seven images within each culture were averaged to make similar comparisons across the US-American and Hispanic primes as a whole.
The same primary metrics were compared across respondent subsamples (e.g. gender, national origin) to determine if ratings varied systematically across demographics. Welch two sample t-tests were used to compare ratings across genders and between immigrant and US-born respondents. Due to non-normal rating distributions, Kruskal-Wallis tests were conducted across groups defined by other indicators: region of birth and ancestry (as in Table 2), time in the US (grouped in 10 year increments or native born), and respondents’ endorsement of statements about ‘Hispanics’/’US-Americans’ “having a single culture”. These tests helped determine the applicability of the final stimulus set across diverse Hispanic/Latino populations.
Results:
Aim 1: Identifying Potential Primes
Figure 2 depicts the process of selecting potential primes; images eliminated at each stage are in grey with retained images in color. While all but two images (H23, H20) showed significantly higher target vs non-target culture representation (paired t-tests, all ps<.001), US-American images as a whole exhibited greater differences between these ratings (Figure 2a). A clear majority of respondents categorized most remaining images as generally depicting only the target culture. Those who did not select the target culture most frequently said the image depicted “both” cultures, with no more than 4% ever selecting the non-target culture. Emotion ratings tended to be consistent across remaining images with the exception of two Hispanic images showing negative valence (H17, H22). This process ultimately resulted in 13 Hispanic and 17 US-American images highlighted as “potential primes”. Our bicultural Hispanic/Latino respondents consistently rated these images as evocative and unambiguous representations of the target culture.
Figure 2:

Process of selecting “Potential Primes”. Ratings are averaged across the full sample of respondents. a) First images which were not consistently rated as considerably (≥35 cultural differentiation) more representative of the target vs non-target culture were eliminated (4 US-American and 6 Hispanic images). b) Next images which were not consistently categorized (≥60%) as depicting only the target culture were eliminated (2 US-American and 4 Hispanic images). c) Finally, two images with negative emotional valence were eliminated from the Hispanic set, and the two images with the lowest emotion scores were removed from the US-American set. Error bars represent standard error of the mean.
Aim 2: Comparing Potential Primes Across Cultural and Regional Groupings
We defined ideal rating patterns for delegate subsamples as target culture representation ≥70, non-target culture representation ≤35, cultural differentiation ≥45, total emotion ≥65, and general cultural categorization of ≥60%. Considering full sample, target culture and balanced bicultural delegate ratings, we found that eight US-American and seven Hispanic potential primes met these more stringent criteria (marked in Table S1). Potential primes not meeting these criteria had at most two metrics which displayed less than ideal ratings, generally being just below the cutoff (see Table S1 for average ratings of all potential primes across full sample, target culture delegates, and balanced bicultural delegates). Thus, all potential primes show fairly consistent evocation among both respondents with greater contact with the target culture and those regularly interacting with both cultures.
To assess the consistency with which highly rated images were viewed as culturally and emotionally evocative, ratings were compared across birth groups. Kruskall-Wallis and χ2 tests on metrics of interest revealed six Hispanic and ten US-American potential primes with no significant variation in ratings across the five birth groups (see Table S2 for mean ratings and statistical comparisons across groups). These consistently rated images cover most of the primary content domains (e.g. food, historical figures, characters), while lacking a US-American flag image and a Hispanic iconic location. Opening consideration to potential primes which showed significant variation across birth groups in only a single metric permits inclusion of more content domains for both cultural mindsets, comprising 9 Hispanic and 15 US-American images (Table S2).
In total, five Hispanic (H2, H7, H14, H19, H21) and four US-American images (A17, A22, A23, A25) met the strictest cultural delegate and birth group defined selection criteria. Allowing a single metric to show less than ideal ratings within delegate subsamples and/or significant differences across birth groups allows an additional five US-American (A6, A9, A12, A16, A21) and one Hispanic image (H5) to be considered for inclusion in CSF studies which include Hispanic/Latino participants from a wide array of cultural backgrounds.
Aim 3a: Characterization of Selected Priming Set
Recognizing that single images are rarely used in isolation for CFS studies, we characterized average ratings across sets of content-matched primes rated highly by both target culture and balanced bicultural delegates. Similarities and differences in perception of these content-matched primes were assessed with paired samples t-tests comparing metrics of interest (i.e. target and non-target culture representation, cultural differentiation, total emotion) across the full sample (Table 3). While significant rating differences within each pair (except H14—A9) emerged, the largest difference in any metric did not exceed 25 points (100-point scale), with a majority of metrics (19 of 28) showing differentials below 8 points.
Table 3:
Paired sample t-tests for metrics of interest within each content-matched pair of primes
| Matched Priming Image Pair | Rating Compared | Hispanic Prime (Mean±SEM) | US-American Prime (Mean±SEM) | Mean Differencea | p value* | Cohen’s da,b |
|---|---|---|---|---|---|---|
| Rice and Beans (H2)— Picnic Food (A4) | Target Culture† | 79.3±2.2 | 83.4±1.9 | 4.06 | .08 | 0.14 [−0.09, 0.37] |
| Non-Target Culture | 28.0±2.4 | 35.6±2.8 | 7.53 | .002 | 0.25 [0.02, 0.48] | |
| Cultural Differentiation† | 51.3±3.1 | 47.9±3.5 | −1.40 | .67 | −0.03 [−0.26, 0.19] | |
| Total Emotion | 73.4±1.7 | 69.0±1.6 | −4.41 | .02 | −0.20 [−0.42, 0.03] | |
| Tamales (H3)— Fried Chicken (A3) | Target Culture | 74.6±2.6 | 81.1±1.9 | 6.53 | .02 | 0.20 [−0.03, 0.43] |
| Non-Target Culture | 20.4±2.2 | 35.1±2.7 | 14.69 | <.001 | 0.41 [0.18, 0.64] | |
| Cultural Differentiation† | 54.2±3.1 | 46.1±3.0 | −6.74 | .07 | −0.15 [−0.38, 0.08] | |
| Total Emotion | 71.1±1.6 | 66.4±1.7 | −4.76 | .006 | −0.23 [−0.46, 0.00] | |
| Latin America Flag Map (H7) —US Flags in Field (A6) | Target Culture | 72.1±2.8 | 87.5±1.9 | 15.40 | <.001 | 0.40 [0.17, 0.63] |
| Non-Target Culture† | 24.3±2.6 | 24.7±2.7 | 0.45 | .88 | 0.01 [−0.22, 0.24] | |
| Cultural Differentiation | 47.8±3.3 | 62.7±3.2 | 16.68 | <.001 | 0.35 [0.12, 0.58] | |
| Total Emotion | 69.1±1.6 | 73.3±1.8 | 4.26 | .03 | 0.19 [−0.04, 0.41] | |
| Virgin Mary Statue (H14) —Jefferson Statue (A9) | Target Culture† | 76.6±2.5 | 74.3±2.5 | −2.24 | .50 | −0.06 [−0.28, 0.17] |
| Non-Target Culture† | 23.1±2.4 | 18.8±2.1 | −4.32 | .12 | −0.13 [−0.36, 0.10] | |
| Cultural Differentiation† | 53.5±3.2 | 55.6±3.1 | 2.97 | .49 | 0.06 [−0.17, 0.29] | |
| Total Emotion† | 69.5±1.7 | 72.6±1.6 | 3.06 | .08 | −0.15 [−0.08, 0.37] | |
| Machu Picchu (H16)—Mount Rushmore (A16) | Target Culture | 64.1±3.1 | 85.6±2.0 | 21.56 | <.001 | 0.56 [0.32, 0.79] |
| Non-Target Culture† | 17.6±2.2 | 16.0±2.2 | −1.58 | .53 | −0.05 [−0.28, 0.18] | |
| Cultural Differentiation | 46.5±3.4 | 69.6±2.8 | 23.16 | <.001 | 0.56 [0.33, 0.80] | |
| Total Emotion† | 68.8±1.6 | 67.5±1.6 | −1.33 | .48 | −0.06 [−0.29, 0.17] | |
| Barranquilla Parade (H19) —Marching Band (A13) | Target Culture† | 73.2±2.7 | 71.8±2.3 | −1.37 | .62 | −0.04 [−0.27, 0.19] |
| Non-Target Culture | 16.3±2.1 | 29.2±2.5 | 12.92 | <.001 | 0.42 [0.19, 0.65] | |
| Cultural Differentiation | 56.9±3.1 | 42.6±3.1 | −12.36 | .001 | −0.28 [−0.51, −0.05] | |
| Total Emotion | 69.5±1.5 | 65.0±1.3 | −4.52 | .003 | −0.25 [−0.48, −0.02] | |
| El Chavo del Ocho (H21)—Bugs Bunny (A12) | Target Culture† | 83.9±2.2 | 83.5±2.0 | −0.40 | .87 | −0.01 [−0.24, 0.21] |
| Non-Target Culture | 12.8±2.0 | 32.7±2.7 | 19.94 | <.001 | 0.54 [0.31, 0.77] | |
| Cultural Differentiation | 71.1±3.0 | 50.8±3.1 | −18.79 | <.001 | −0.41 [−0.64, −0.18] | |
| Total Emotion† | 74.3±1.7 | 72.7±1.6 | −1.57 | .40 | −0.07 [−0.30, 0.16] |
148 degrees of freedom for all tests.
Metrics which showed no significant variation between matched primes.
Negative values represent higher ratings for the Hispanic prime.
Numbers in brackets represent 95% confidence interval.
p values are not corrected for multiple comparisons, representing a more conservative test when highlighting non-significant results.
To determine if primes were unambiguously associated with their target culture, respondents’ categorizations of the culture they generally associate with each prime were compared (Figure 3a). All primes were categorized as generally depicting the target culture by at least 60% of respondents; no more than 5% of respondents categorized any prime as depicting the non-target culture. One content-matched pair (H2 and A4) showed no variation in the proportion of respondents grouping them in each cultural category (i.e. target, non-target, neither, both; χ2(3)=0.29, p=.96, Cramer’s V=0.03); all remaining pairs showed significant variability in respondents’ categorizations (all ps<.01; Table 4).
Figure 3:

General cultural categorization by priming image and averaged across primes within target cultures. a) Respondents’ categorization of the culture they generally associate with each Hispanic (left) and US-American (right) prime. The Y-axis displays the percent of respondents who placed the prime into each cultural category. Primes are ordered in each graph such that content-matched pairs appear in the same position. b) Cultural categorizations averaged across the seven selected Hispanic (left) and US-American (right) primes. *p<.01 χ2 test with 3 degrees of freedom comparing proportions of respondents grouping content-matched primes (e.g. H7 compared to A6) into each category
Table 4:
Chi-squared comparison of the proportion of respondents categorizing each content-matched pair of primes as generally representing ‘Hispanic’ Culture, ‘US-American’ Culture, “Neither”, or “Both”
| Matched Prime Pair | X2 | p value | Cramer’s V | 95% Confidence Interval |
|---|---|---|---|---|
| H2 — A4 | 0.29 | .96 | 0.03 | [0.00, 0.05] |
| H3 — A3 | 17.26 | .001 | 0.24 | [0.11, 0.34] |
| H7 — A6 | 16.94 | .001 | 0.24 | [0.10, 0.34] |
| H14 — A9 | 15.63 | .001 | 0.23 | [0.09, 0.33] |
| H16 — A16 | 18.63 | <.001 | 0.25 | [0.12, 0.35] |
| H19 — A13 | 44.20 | <.001 | 0.39 | [0.26, 0.49] |
| H21 — A12 | 44.53 | <.001 | 0.39 | [0.26, 0.49] |
When making these comparisons, categorizations of ‘Hispanic’ and ‘US-American’ were recoded as “Target” and “non-Target”. All tests with 3 degrees of freedom
We then compared respondents’ ratings averaged across the seven primes within each target culture to determine if, overall, the Hispanic and US-American primes are comparable within each tested metric (cultural differentiation, representation, emotion). Figure 4 displays average ratings for each metric across the seven primes for each target culture. All together, the primes for the two cultural mindsets exhibited comparable cultural differentiation (t(148)=0.13, p=.90, d= 0.01, [−0.22, 0.24]) and total emotion scores (t(148)=1.35, p=.18, d=0.11, [−0.12, 0.34]), meaning they were rated equally emotionally evocative and able to dissociate the target from non-target culture. Compared to Hispanic primes, US-American primes were rated higher on average in representing both the target (t(148)=3.55, p<.001, d= 0.29, [0.06, 0.52]) and non-target culture (t(148)=4.61, p<.001, d= 0.38, [0.15, 0.61]). While significant, these differences represent small effects (ds< 0.40).
Figure 4:
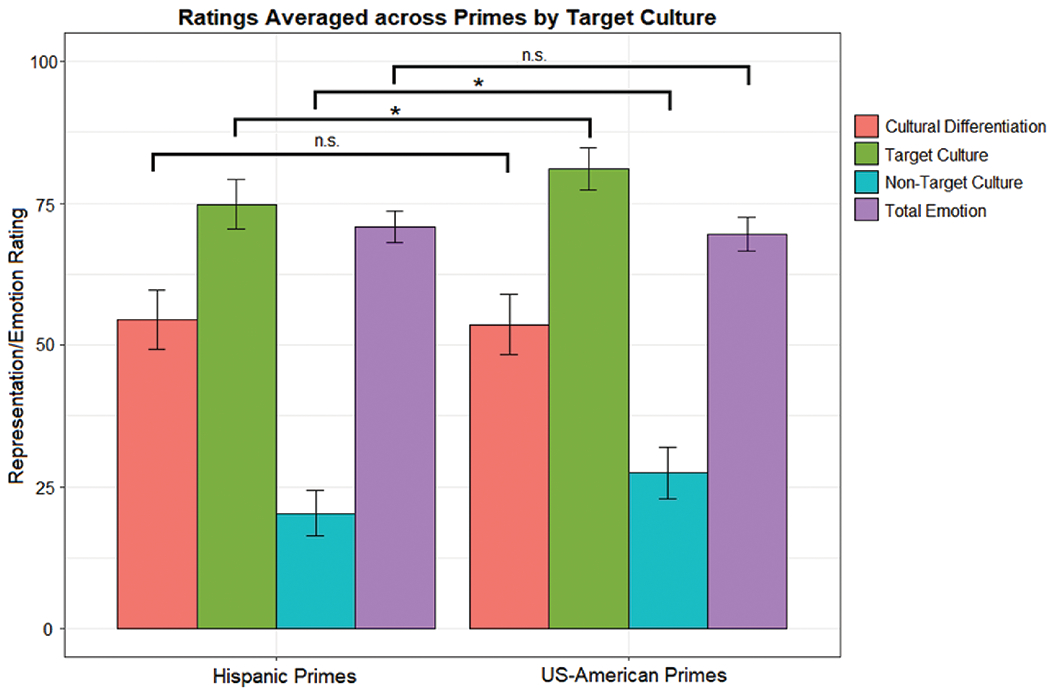
Average ratings across primes for each cultural mindset. Cultural representation and emotion ratings across the seven primes for each target culture were first averaged within individual respondents. The distributions of these average ratings across the full sample are plotted. Error bars denote standard error of the mean. *p<.01 paired samples t-test with 148 degrees of freedom, n.s.- non-significant
Figure 3b displays respondents’ general cultural categorization averaged across each group of primes, showing significant variation between the US-American and Hispanic primes (χ2(3)=42.29, p<.001, V=0.14, [0.10, 0.18]). Overall, Hispanic primes were categorized as generally representing the target culture (80% of respondents) more frequently than US-American primes (70%). This difference reflects that US-American primes were categorized as associated with “both” cultures (23%) more often than Hispanic primes (12%).
Aim 3b: Priming Set Comparisons Across Demographics
We tested whether ratings averaged over selected primes were consistent across various respondent subgroups. Given our primarily female sample, we first demonstrated that no tested metrics (i.e. culture representation, cultural differentiation, and emotion) varied significantly between males and females. Non-target culture ratings for Hispanic primes showed marginal variation (t(41)=1.86, p=.07, d=0.45 [0.06, 0.84]), with males rating Hispanic primes nine points (out of 100) more representative of US-American culture than females on average. Outside of this result, males’ and females’ average ratings of Hispanic (Welch two-sample t-tests, all ps>.35, all ds<0.20) and US-American primes (all ps>.25, all ds<0.30) did not vary significantly.
Similar results emerged when comparing ratings across respondents of different national origins. No significant differences in average representation, differentiation, and emotion ratings appeared between US-born and immigrant respondents for either Hispanic (all ps>.20, ds<0.25) or US-American primes (all ps>.35, ds<0.15). As this represented a fairly coarse comparison, we then tested for differences across respondents grouped by birth region: US, Mexico, Puerto Rico, South America, or Other. Kruskal-Wallis rank sum tests indicated that respondents’ birth group did not significantly affect average ratings on any tested metric for either Hispanic (all ps>.10, all ε2≤0.05) or US-American primes (all ps>.09, all ε2≤0.05; Figure 5).
Figure 5:
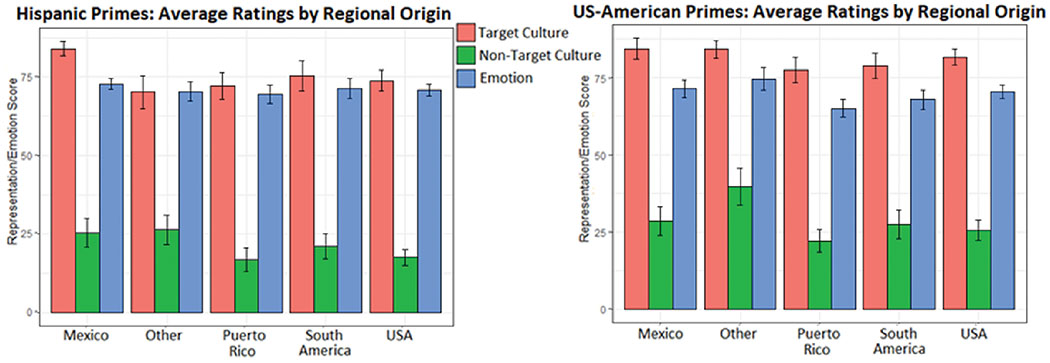
Ratings averaged across the seven Hispanic (left) and US-American (right) primes for respondents grouped by regional origin. Error bars denote standard error of the mean
The 50 US-born respondents were then divided based on their parents’ and grandparents’ national origin, resulting in five ancestry groups: Mexico, Puerto Rico, South America, Other, and Mixed (Table 1). Kruskal-Wallis tests demonstrated no relationship between ancestry and average cultural representation, differentiation, and emotion ratings for both Hispanic (all ps>.45, all ε2<0.03) and US-American primes (all ps≥.35, all ε2≤0.03).
As time living in the US was collected categorically, respondents were placed into four similarly sized groups: 0 to 10 years (N=34), 10 to 20 years (N=31), and more than 20 years (N=84), with the latter group divided between US-born (N=44) and immigrant respondents (N=40). Non-target culture representation ratings for Hispanic primes (i.e. “how representative is this image of your US-American culture?”) showed significant variation across time spent in the US (Kruskal-Wallis test, χ2(3)= 8.26, p=.04, ε2=0.06) such that immigrants having lived in the US 0-10 years or 20+ years tended to rate these primes 5-10 (out of 100) points higher than the remaining groups. All other tests for the effect of time in the US on average prime ratings were non-significant for both Hispanic and US-American primes (all ps>.30, all ε2≤0.02). Similar results arose when grouping respondents by 5 year increments.
As identification with panethnic labels varies widely across Hispanic/Latino populations (Taylor et al., 2012), we finally characterized how respondents’ belief in a panethnic culture affected ratings for these primes. We tested whether respondents’ responses to the statements “‘Hispanics’/’US-Americans’ can be thought of as having a single culture” influenced their average ratings of the selected primes. Figure 6a shows that respondents were split on their endorsement of these concepts, with greater disagreement concerning a singular ‘Hispanic’ culture. Across metrics, respondents’ average ratings for US-American primes did not vary as a function of their belief in a single ‘US-American’ culture (Kruskal-Wallis tests, all ps>.30, all ε2<0.06). Similarly, average cultural differentiation and non-target (i.e. US-American) representation ratings for Hispanic primes did not vary across respondents’ endorsement of a single ‘Hispanic’ culture (Kruskal-Wallis tests, χ2(6)= 9.93, p= 0.12, ε2=0.07; χ2(6)= 10.94, p= 0.09, ε2=0.07, respectively). However, average Hispanic representation and total emotion ratings for Hispanic primes varied significantly across responses to this question (Kruskal-Wallis χ2(6)= 15.92, p= 0.01, ε2=0.11; χ2(6)= 17.62, p= 0.01, ε2=0.12, respectively). Surprisingly, these ratings for Hispanic primes did not increase linearly with greater endorsement of a single Hispanic culture. Rather, the greatest rating discrepancies emerged among those who “somewhat disagree”, as opposed to those who “strongly disagree” with a single ‘Hispanic’ culture (Figure 6b).
Figure 6:

a) Distribution of respondents’ endorsement of a single Hispanic (left) and US-American (right) culture. b) Respondents’ target culture representation ratings for Hispanic (left) and US-American (right) primes grouped by endorsement of a single Hispanic (left) or US-American (right) culture. Each point represents a respondent’s average rating of the seven primes associated with each cultural mindset. Similar graphs for additional tested metrics are available in the supplement (Figure S4)
Discussion:
Despite a growing number of studies manipulating cultural mindsets using iconic images, little work exists justifying or validating such “cultural primes”. Further, cultural frame switching (CFS) studies within Hispanic/Latino populations are frequently limited to Mexican Americans. Here we addressed these gaps in the literature by presenting empirical justification for the cultural and emotional salience of a set of “potential primes”. Across the most lenient selection criteria, we present a pool of 13 Hispanic and 17 US-American images which can be chosen based on their content and rating properties depending on the needs of individual CFS researchers (i.e. sample makeup and priming methodology). Subsets of these images are also highlighted as showing consistent rating properties across cultural groupings defined by both contact with the relevant cultures and regional origin. Thus we hope to encourage deeper consideration of the images selected to prime cultural mindsets and greater inclusion of broader portions of the Hispanic/Latino population in CFS research. Descriptive titles, general content domains, Shutterstock license numbers, citations, and relevant rating properties for all images included in this study are available via Open Science Framework (Gianola et al., 2020) (https://mfr.osf.io/render?url=https://osf.io/s6ruk/?direct%26mode=render%26action=download%26mode=render).
Similar to Ng and Lai (2009), culturally salient images were initially identified with help from bilingual informants from across Latin America; however, we incorporated more rigorous rating criteria for the final selection of cultural primes. A large set of images associated with Hispanic and US-American culture were matched across content domains (e.g. food, historical figures). Rather than assuming each image effectively represents the target culture, as in other CFS studies (Kreitler & Dyson, 2016; Lechuga, 2008; Ng et al., 2010), we then had Hispanic/Latino bilinguals rate each image on various dimensions to select primes shown to maintain cultural and emotional salience across individuals. Furthermore, within our prime selection procedure, we considered ratings from distinct sets of cultural “delegates”, believed to more frequently engage with either their Hispanic or US-American situated identities (Blackledge & Pavlenko, 2001; Clément & Noels, 1992), or to be fairly “balanced” between the two. As “Hispanic and mainstream dominant” biculturals may have greater knowledge of and prefer culturally salient information targeted toward their dominant culture (Chattaraman et al., 2010; Kang & Kim, 2012), this process allowed us to choose primes which individuals who regularly adopt the associated cultural mindset found meaningful. This method also prevented any individual respondent form heavily influencing the selection of both Hispanic and US-American primes.
Selected Hispanic and US-American potential primes all exhibit high ratings for representing the target culture and evoking positive emotion. Across all potential primes, personal and general mean target culture representation and emotion ratings were consistently above 60 (100 point scales) and cultural differentiation was at least 40 and generally above 50 points. As the primary objective of cultural priming is to activate one cultural mindset while disengaging another (Aydinli & Bender, 2015), these consistently high representation and differentiation scores are crucial to effectively activating the targeted cultural mindset. Given that arousing positive emotions has been shown to broaden memory for both centrally focused and peripheral information (Yegiyan & Yonelinas, 2011), the high positive emotion ratings of these stimuli may promote recollection of the broader cultural associations tied to the image content.
Hoping to increase replicability in CFS studies, we aggregated potential primes with satisfactory rating properties to form a pre-made stimulus set intended to elicit cultural priming effects among varied Hispanic/Latino samples. Our final set of seven primes for each cultural mindset (Hispanic and US-American) are content-matched, show high and consistent emotional and cultural evocation, and are equally able to differentiate the target from non-target culture. The cultural and emotional evocation of this priming set was maintained across regional origins, ancestry, and genders. Additionally, the primes’ ability to represent the target culture above the non-target remained consistent across respondents’ time in the US and endorsement of panethnic ‘Hispanic’ or ‘US-American’ cultures (associated with the Spanish and English languages, respectively). Our findings provide practical evidence that this stimulus set should effectively evoke and differentiate Hispanic and US-American cultural mindsets among a wider diversity of Hispanics/Latinos than are currently included in CSF studies.
The content-matched pairs of primes are generally comparable in regards to our tested metrics. While there was significant rating variation between content-matched pairs, these differences never reached large effect sizes (estimates of Cohen’s ds<0.60), with the majority remaining small (ds<0.25). Emotion ratings showed the lowest variability of any metric across paired primes. As cultural priming can alter emotional responsivity (Grossmann et al., 2012), cultural primes matched for emotional strength could clarify how emotional responses interact with cultural associations to influence various cognitive processes. All primes were categorized as representing the target culture by a clear majority (60+%) of respondents. As most of the remaining respondents tended to rate the primes as representing “both” cultures, there was minimal classification within the non-target culture. Such characterizations are not entirely unexpected, as an integrative style of biculturalism reflects tendencies to incorporate both cultures into various activities and perspectives (Benet-Martínez, 2012). Whereas most image pairs differed significantly in their categorical grouping (generally depicting Hispanic, US-American, neither, or both cultures), primes H2 (rice and beans) and A4 (picnic food) were statistically equivalent in cultural categorization, and showed generally low rating differences. Similarly, although differing in their categorical groupings, primes H14 (statue of Virgin Mary) and A9 (statue of Thomas Jefferson) did not differ significantly in any other tested metric (i.e. target, non-target representation, cultural differentiation, and emotion). Thus, these two priming pairs appear to be the most comparable of the set. Alternatively, primes H16 (Machu Picchu) and A16 (Mount Rushmore) displayed relatively large differences in target culture representation and cultural differentiation ratings compared to the remaining pairs. H16 was the most frequently categorized as representing “neither” culture (15%). In total, however, relative differences across matched pairs tended to cancel out when considering the full stimulus set grouped by target culture.
Ratings averaged across Hispanic and US-American cultural groupings promote confidence that this priming set should evoke target culture associated mindsets with limited elicitation of the non-target mindset. On average, the selected primes were endorsed as highly (70+ on 100-point scale) personally representative of the target culture and categorized as generally associated with the target culture by 70% (US-American) or 80% (Hispanic primes) of respondents. As effective cultural priming requires evocation of semantic content already in memory (Oyserman & Lee, 2007), these ratings imply that cultural associations with the content of these primes are present among most individuals. Additionally, the grouped primes were equally able to differentiate the target from non-target culture and evoke positive emotional responses, the former being unaffected by respondents’ relative endorsement of a panethnic ‘Hispanic’ culture. Since CFS studies often lack neutral or unprimed conditions (e.g.(Chiao et al., 2010; Lechuga, 2008), equivalence across Hispanic and US-American primes safeguards against differences between conditions resulting from differential evocation of priming sets; or, to the degree that such differences exist (e.g. target culture ratings), they can at least be controlled for. Similar rating patterns were maintained across genders, national origins, and ancestry, with only minor variation related to time in the US, suggesting these stimuli should effectively prime each cultural mindset across a more representative swath of the culturally diverse “Hispanic/Latino” population.
While average cultural differentiation scores for the grouped primes were consistent across demographics, modest but significant rating differences between Hispanic and US-American primes warrant consideration. Compared to Hispanic primes, US-American primes were rated more personally representative of both the target and non-target culture and more often categorized as generally depicting both cultures. Our sample, comprised of US residents, may frequently be exposed to US-American icons in both Hispanic (e.g. familial) and non-Hispanic (e.g. work) social contexts, relating to acculturative mixing (i.e. integration) among immigrant communities (Benet-Martínez, 2012; Foner, 2012). This would help to account for higher non-target ratings among US-American primes. Conducting the survey in English may also explain lower target culture ratings for Hispanic primes, as language context can shift views about culture-relevant norms among Mexican-Americans (Lechuga & Wiebe, 2009), and the cultural mindsets were framed to respondents in terms of language associations. Moreover, Hispanic primes were likely less personally representative of the target culture due to greater variability in depicted national identities. That is, while all US-American primes represent one nation, certain Hispanic primes (e.g. Machu Picchu) may be more relevant to individuals from specific regions (e.g. South America). This breadth of cultural depictions is in line with heterogeneous beliefs and practices and variability in endorsement of panethnic cultural perspectives across Hispanic/Latino communities (Senices, 2005; Taylor et al., 2012). Regionally specific Hispanic primes (e.g. H16) were generally rated less representative by respondents originating outside of relevant areas, reducing average target culture ratings. We sought to account for such image-level variability by including internationally recognized content from various national contexts among the Hispanic primes. This strategy allowed Hispanic primes to show stable average personal representation ratings across national backgrounds and to be more frequently categorized as generally depicting the target culture than US-American primes. Hence, despite slightly lower target culture ratings, the Hispanic primes remain strongly associated with the targeted mindset across our sample.
The significant relationship between respondents’ endorsement of a single ‘Hispanic’ culture and average target culture and emotion ratings for Hispanic primes merits examination. Broadly, the lowest emotion and Hispanic culture representation ratings came from respondents who “somewhat disagree” that “‘Hispanics’ can be thought of as having a single culture”. This result may reflect a tendency for certain individuals to avoid rating at the extremes of scales concerning Hispanic culture (i.e. mid-point responding), as different response styles can produce appreciable differences on surveys (Diamantopoulos et al., 2006). However, generally lower ratings for respondents who “disagree” in any way with the statement implies that lower panethnic identification may slightly reduce the Hispanic primes emotional and cultural evocation. As we observed no relationship between endorsement of a single ‘Hispanic’ culture and average differentiation scores of Hispanic primes, we suggest this priming set should remain generally effective in inducing a relatively more Hispanic/Spanish-associated mindset, irrespective of bicultural participants’ beliefs about Hispanic panethnicity. However, recording participants’ responses to such a cultural homogeneity question would be an efficient way to control for effects on priming efficacy.
As cultural priming is meant to activate prototypes of broader networks of cultural associations (Hong et al., 2000), we believe our language-based cultural delineation and inclusion of multinational images is conceptually tenable. Image priming of the heritage culture has previously been shown to interfere with second language production among Chinese immigrants (Zhang et al., 2013), and language itself can prime culture-relevant norms (Lechuga & Wiebe, 2009), suggesting a reciprocal connection between cultural priming and language use. Thus, while a particular image best representing one Hispanic culture, e.g. Mexican, may not be as evocative to a bicultural Cuban-American, the image can still bring to mind concepts associated with Mexican culture, including the Spanish language. This would in turn draw focus away from the US-American cultural mindset. In this way, ratings averaged across primes remained generally stable across sample subgroups (e.g. national origin, gender, time in US, etc.). Hence, the Hispanic primes appear to tap overarching cultural characteristics, such as religious tradition and food, which often bring diverse Latin cultures into closer association with each other compared to US-American culture (Marin & Marin, 1991). This cultural proximity might be compared to “Indian-American culture”, which conglomerates people from diverse regions, speaking distinct languages, with different local foods and traditions while nonetheless representing a meaningful cultural grouping (Dave et al., 2000). We posit that the multinational variety of our Hispanic primes may encourage bicultural individuals to connect the depicted national cultures by engaging a personal network of “Hispanic” mental associations tied to the Spanish language.
Limitations:
These results should be interpreted in light of the particular makeup of our sample. Specifically, our respondents were mostly female and represented a greater proportion of immigrants than present within the US Hispanic/Latino population (U.S. Census Bureau, 2017). This gender ratio is similar to the sample reported by Chattaraman and collaborators (70% female) in their online cultural priming study of Hispanic Americans (2010). Similar proportions of males and females were maintained within our delegate subsamples and across grouped national origins. Among immigrant respondents, we did not have representation from all Latin American nations; our sample includes a relative under-representation of Mexicans and over-representation of Puerto Ricans compared to the US Hispanic/Latino population (Figure S1). Nearly half (22 of 50) of Hispanic delegates were Puerto Rican while a majority (39 of 50) of US-American delegates were US-born. Although the demographic distribution within our sample could have biased image selection, comparisons across genders and regional origins revealed no significant differences between groups.
We also note that we operationalized the targeted cultural mindsets in terms of language usage among a bilingual sample. While Hispanics/Latinos are the largest population of bilinguals in the US (U.S. Census Bureau, 2017), showing relatively high rates of bilingualism (Taylor et al., 2012), not all bicultural Hispanics/Latinos are bilingual. However, monolingual Hispanics/Latinos may still identify as bicultural (e.g. (Romero & Roberts, 2003) and thus be subject to cultural priming effects. Although we posit that our potential primes should make effective tools for a variety of bicultural individuals, we advise additional caution for CFS researchers interested in using these images to study monolingual samples, especially given that second language competence can moderate relationships between cultural identity and cognitive outcomes (e.g. stress; (Clément et al., 2001).
We stress here that the creation of this stimulus set is not an indication that all or even most Spanish-speaking Hispanics/Latinos possess a homogenous cultural mindset associated with the Spanish language. Nor do we negate the regional diversity present within US-American culture. We do not suggest that all Hispanics/Latinos will find these images evocative. Even within our sample, certain respondents rated given primes fairly low. Rather, on average these images remain generally evocative to a wide set of individuals. By using images rated to represent the individual’s cultural mindset and to be generally related to the appropriate culture, we expect these images can solicit the associated cultural schemas (Rodríguez-Arauz et al., 2017). We emphasize that this is not in itself a cultural priming study, and we cannot say with certainty that these images will alter cultural mindsets. However, we provide more evidence toward that belief than present for primes used in numerous CFS studies (e.g. (Lechuga, 2008; Morris & Mok, 2011). These potential primes and the final stimulus set serve as tools to expand the pool of research participants in which cultural effects on behavior and cognition can be studied. We hope to boost CFS research outside East-West cultural paradigms, and specifically encourage studies including Hispanic/Latino samples not exclusively comprised of Mexican-Americans. Given that both governmental and private organizations consistently categorize Hispanics/Latinos as a single ethnicity (Taylor et al., 2012), we offer these tools to maximally evoke and dissociate personally relevant cultural mindsets across a wider range of bicultural individuals.
Future Directions:
Multiple research avenues should be pursued to characterize the efficacy of these stimuli for cultural priming of Hispanics/Latinos. The present study should be replicated with respondents from a greater diversity of national origins as well as with surveys in Spanish to assure that potential primes maintain high ratings. The final stimulus set requires validation for inducing cultural priming effects across Hispanic/Latino research participants. Prior CFS studies suggest that Hispanic cultural priming should produce more external attributions, positive affect (Kreitler & Dyson, 2016), and affiliation with Hispanic culture (Lechuga, 2008) compared to US-American priming. Researchers planning to study specific national or regional groups of Hispanics/Latinos could select particular priming images based on ratings from the relevant group in Table S2. As various potential primes showed rating variability across birth groups, and levels of “Bicultural Identity Integration” can influence responses to cultural primes (Benet-Martínez et al., 2002; Mok & Morris, 2013), both factors should be recorded as potential moderators of priming effects when validating the images studied here. These cultural primes may further be used in combination with language manipulations to dissociate linguistic- from culture-based influences on cognition. Such investigations will offer deeper insight into the aspects of cognition influenced by cultural processes and the strength of such effects across diverse groups within the “Hispanic/Latino” population.
Conclusion:
Here we highlight a range of images with empirically demonstrated cultural and emotional salience, previously lacking in cultural frame switching literature. We characterize specific content-matched priming sets designed to activate Hispanic and US-American cultural associations among an assortment of Hispanic/Latino US residents. The cultural mindsets were operationalized in terms of language usage, maintaining relevance among a broader diversity of Hispanics/Latinos. We believe the existence of these potential primes and content-matched priming sets will stimulate cultural frame switching research outside of East-West cultural paradigms. Subsequent cultural priming investigations using these stimuli within the growing Hispanic/Latino population will help clarify the cultural forces which shape cognition.
Supplementary Material
Footnotes
When these terms appear in ‘single quotes’, they are standing in place of the respondent’s highest rated cultural term which they saw displayed
These numbers produced a metric on a 0 to 1 scale
References:
- Aydinli A, & Bender M (2015). Cultural priming as a tool to understand multiculturalism and culture. Online Readings in Psychology and Culture, 2(1), 13. [Google Scholar]
- Benet-Martínez V (2012). Multiculturalism: Cultural, social, and personality processes. The Oxford handbook of personality and social psychology, 623–648. [Google Scholar]
- Benet-Martínez V, Leu J, Lee F, & Morris MW (2002). Negotiating biculturalism: cultural frame switching in biculturals with oppositional versus compatible cultural identities. Journal of Cross-Cultural Psychology, 33(5), 492–516. [Google Scholar]
- Blackledge A, & Pavlenko A (2001). Negotiation of identities in multilingual contexts. In: SAGE Publications Sage UK: London, England. [Google Scholar]
- Chattaraman V, Lennon SJ, & Rudd NA (2010). Social identity salience: Effects on identity‐based brand choices of Hispanic consumers. Psychology & Marketing, 27(3), 263–284. [Google Scholar]
- Chen SX (2015). Toward a social psychology of bilingualism and biculturalism. Asian Journal of Social Psychology, 18(1), 1–11. [Google Scholar]
- Chiao JY, Harada T, Komeda H, Li Z, Mano Y, Saito D, … Iidaka T. (2010). Dynamic cultural influences on neural representations of the self. Journal of cognitive neuroscience, 22(1), 1–11. [DOI] [PubMed] [Google Scholar]
- Clément R, & Noels KA (1992). Towards a situated approach to ethnolinguistic identity: The effects of status on individuals and groups. Journal of Language and Social Psychology, 11(4), 203–232. [Google Scholar]
- Clément R, Noels KA, & Deneault B (2001). Interethnic contact, identity, and psychological adjustment: The mediating and moderating roles of communication. Journal of Social Issues, 57(3), 559–577. [Google Scholar]
- Dave S, Dhingra P, Maira S, Mazumdar P, Shankar LD, Singh J, & Srikanth R (2000). De-Privileging Positions: Indian Americans, South Asian Americans, and the Politics of Asian American Studies. Journal of Asian American Studies, 3(1), 67–100. [Google Scholar]
- Diamantopoulos A, Reynolds NL, & Simintiras AC (2006). The impact of response styles on the stability of cross-national comparisons. Journal of Business Research, 59(8), 925–935. [Google Scholar]
- Duan C, & Vu P (2000). Acculturation of Vietnamese students living in or away from Vietnamese communities. Journal of Multicultural Counseling and Development, 28(4), 225–242. [Google Scholar]
- Erdfelder E, Faul F, & Buchner A (1996). GPOWER: A general power analysis program. Behavior research methods, instruments, & computers, 28(1), 1–11. [Google Scholar]
- Foner N (2012). The immigrant family: Cultural legacies and cultural changes. In The new immigration (pp. 171–180): Routledge. [PubMed] [Google Scholar]
- Gianola M, Yepes B, & Losin ER (2020). Image Descriptions and Ratings. doi: 10.17605/OSF.IO/XUHNM [DOI] [Google Scholar]
- Grossmann I, Ellsworth PC, & Hong Y. y. (2012). Culture, attention, and emotion. Journal of Experimental Psychology: General, 141(1), 31. [DOI] [PubMed] [Google Scholar]
- Holloway RA, Waldrip AM, & Ickes W (2009). Evidence that a simpático self-schema accounts for differences in the self-concepts and social behavior of Latinos versus Whites (and Blacks). Journal of personality and social psychology, 96(5), 1012. [DOI] [PubMed] [Google Scholar]
- Hong Y. y., Morris MW, Chiu C. y., & Benet-Martinez V (2000). Multicultural minds: A dynamic constructivist approach to culture and cognition. American Psychologist, 55(7), 709. [DOI] [PubMed] [Google Scholar]
- Jones-Correa M, & Leal DL (1996). Becoming” Hispanic”: Secondary panethnic identification among Latin American-origin populations in the United States. Hispanic Journal of Behavioral Sciences, 18(2), 214–254. [Google Scholar]
- Kang H-S, & Kim I. s. (2012). Perceived and actual competence and ethnic identity in heritage language learning: A case of Korean-American college students. International Journal of Bilingual Education and Bilingualism, 15(3), 279–294. [Google Scholar]
- Kemmelmeier M, & Cheng BY-M (2004). Language and self-construal priming: A replication and extension in a Hong Kong sample. Journal of Cross-Cultural Psychology, 35(6), 705–712. [Google Scholar]
- Kiang L, Perreira KM, & Fuligni AJ (2011). Ethnic label use in adolescents from traditional and non-traditional immigrant communities. Journal of youth and adolescence, 40(6), 719–729. [DOI] [PMC free article] [PubMed] [Google Scholar]
- Kreitler CM, & Dyson KS (2016). Cultural Frame Switching and Emotion Among Mexican Americans. Journal of Latinos and Education, 15(2), 91–96. [Google Scholar]
- Lechuga J (2008). Is acculturation a dynamic construct? The influence of method of priming culture on acculturation. Hispanic Journal of Behavioral Sciences, 30(3), 324–339. [Google Scholar]
- Lechuga J, & Wiebe JS (2009). Can language prime culture in Hispanics? The differential impact of self‐construals in predicting intention to use a condom. International Journal of Psychology, 44(6), 468–476. [DOI] [PMC free article] [PubMed] [Google Scholar]
- Marin G, & Marin BV (1991). Research with Hispanic populations: Sage Publications, Inc. [Google Scholar]
- Mok A, & Morris MW (2013). Bicultural self-defense in consumer contexts: Self-protection motives are the basis for contrast versus assimilation to cultural cues. Journal of Consumer Psychology, 23(2), 175–188. [Google Scholar]
- Morris MW, & Mok A (2011). Isolating effects of cultural schemas: Cultural priming shifts Asian-Americans’ biases in social description and memory. Journal of Experimental Social Psychology, 47(1), 117–126. [Google Scholar]
- Ng SH, Han S, Mao L, & Lai JC (2010). Dynamic bicultural brains: fMRI study of their flexible neural representation of self and significant others in response to culture primes. Asian Journal of Social Psychology, 13(2), 83–91. [Google Scholar]
- Ng SH, & Lai JC (2009). Effects of culture priming on the social connectedness of the bicultural self: A self-reference effect approach. Journal of Cross-Cultural Psychology, 40(2), 170–186. [Google Scholar]
- Oyserman D, & Lee SW-S (2007). Priming “culture”. Handbook of cultural psychology, 255–279. [Google Scholar]
- Oyserman D, & Lee SW (2008). Does culture influence what and how we think? Effects of priming individualism and collectivism. Psychological bulletin, 134(2), 311. [DOI] [PubMed] [Google Scholar]
- R Core Team. (2017). R: A Language and Environment for Statistical Computing. R Foundation for Statistical Computing, Vienna, Austria. [Google Scholar]
- Ramírez-Esparza N, Gosling SD, & Pennebaker JW (2008). Paradox lost: Unraveling the puzzle of Simpatía. Journal of Cross-Cultural Psychology, 39(6), 703–715. [Google Scholar]
- Rivera FI, Guarnaccia PJ, Mulvaney-Day N, Lin JY, Torres M, & Alegria M (2008). Family cohesion and its relationship to psychological distress among Latino groups. Hispanic Journal of Behavioral Sciences, 30(3), 357–378. [DOI] [PMC free article] [PubMed] [Google Scholar]
- Rodríguez-Arauz G, Ramírez-Esparza N, García-Sierra A, Ikizer EG, & Fernández-Gómez MJ (2019). You go before me, please: Behavioral politeness and interdependent self as markers of Simpatía in Latinas. Cultural Diversity and Ethnic Minority Psychology, 25(3), 379. [DOI] [PubMed] [Google Scholar]
- Rodríguez-Arauz G, Ramírez-Esparza N, Pérez-Brena N, & Boyd RL (2017). Hablo Inglés y Español: Cultural self-schemas as a function of language. Frontiers in psychology, 8, 885. [DOI] [PMC free article] [PubMed] [Google Scholar]
- Romero AJ, & Roberts RE (2003). Stress within a bicultural context for adolescents of Mexican descent. Cultural Diversity and Ethnic Minority Psychology, 9(2), 171. [DOI] [PubMed] [Google Scholar]
- Schroeder SR, Lam TQ, & Marian V (2017). Linguistic predictors of cultural identification in bilinguals. Applied linguistics, 38(4), 463–488. [DOI] [PMC free article] [PubMed] [Google Scholar]
- Senices J (2005). The complexity behind the Hispanic identity. Journal of Applied Rehabilitation Counseling, 36(2), 20. [Google Scholar]
- Son J, Reimer B, Mehler B, Pohlmeyer A, Godfrey K, Orszulak J, … Coughlin JF. (2010). Age and cross-cultural comparison of drivers’ cognitive workload and performance in simulated urban driving. International Journal of Automotive Technology, 11(4), 533–539. [Google Scholar]
- Soto JA, Perez CR, Kim Y-H, Lee EA, & Minnick MR (2011). Is expressive suppression always associated with poorer psychological functioning? A cross-cultural comparison between European Americans and Hong Kong Chinese. Emotion, 11(6), 1450. [DOI] [PubMed] [Google Scholar]
- Storbeck J, & Clore GL (2008). The affective regulation of cognitive priming. Emotion, 8(2), 208. [DOI] [PMC free article] [PubMed] [Google Scholar]
- Taylor P, Lopez MH, Martínez JH, & Velasco G (2012). When labels don’t fit: Hispanics and their views of identity. Washington, DC: Pew Hispanic Center. [Google Scholar]
- U.S. Census Bureau. (2017). Profile America Facts For Features: Hispanic Heritage Month 2017. (CB17-FF.17). [Google Scholar]
- Verkuyten M, & Pouliasi K (2002). Biculturalism among older children: Cultural frame switching, attributions, self-identification, and attitudes. Journal of Cross-Cultural Psychology, 33(6), 596–609. [Google Scholar]
- Yegiyan NS, & Yonelinas AP (2011). Encoding details: Positive emotion leads to memory broadening. Cognition & Emotion, 25(7), 1255–1262. [DOI] [PubMed] [Google Scholar]
- Zhang S, Morris MW, Cheng C-Y, & Yap AJ (2013). Heritage-culture images disrupt immigrants’ second-language processing through triggering first-language interference. Proceedings of the National Academy of Sciences, 110(28), 11272–11277. [DOI] [PMC free article] [PubMed] [Google Scholar]
Associated Data
This section collects any data citations, data availability statements, or supplementary materials included in this article.