Visual Abstract
Keywords: Hodgkin lymphoma, segmentation methods, 18F-FDG PET/CT, outcome prediction, radiomics
Abstract
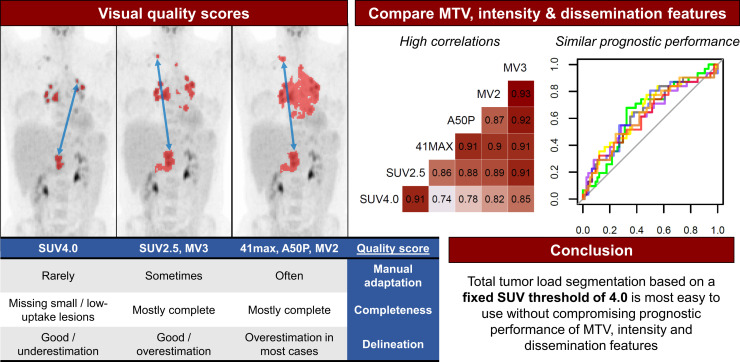
Consensus about a standard segmentation method to derive metabolic tumor volume (MTV) in classical Hodgkin lymphoma (cHL) is lacking, and it is unknown how different segmentation methods influence quantitative PET features. Therefore, we aimed to evaluate the delineation and completeness of lesion selection and the need for manual adaptation with different segmentation methods, and to assess the influence of segmentation methods on the prognostic value of MTV, intensity, and dissemination radiomics features in cHL patients. Methods: We analyzed a total of 105 18F-FDG PET/CT scans from patients with newly diagnosed (n = 35) and relapsed/refractory (n = 70) cHL with 6 segmentation methods: 2 fixed thresholds on SUV4.0 and SUV2.5, 2 relative methods of 41% of SUVmax (41max) and a contrast-corrected 50% of SUVpeak (A50P), and 2 combination majority vote (MV) methods (MV2, MV3). Segmentation quality was assessed by 2 reviewers on the basis of predefined quality criteria: completeness of selection, the need for manual adaptation, and delineation of lesion borders. Correlations and prognostic performance of resulting radiomics features were compared among the methods. Results: SUV4.0 required the least manual adaptation but tended to underestimate MTV and often missed small lesions with low 18F-FDG uptake. SUV2.5 most frequently included all lesions but required minor manual adaptations and generally overestimated MTV. In contrast, few lesions were missed when using 41max, A50P, MV2, and MV3, but these segmentation methods required extensive manual adaptation and overestimated MTV in most cases. MTV and dissemination features significantly differed among the methods. However, correlations among methods were high for MTV and most intensity and dissemination features. There were no significant differences in prognostic performance for all features among the methods. Conclusion: A high correlation existed between MTV, intensity, and most dissemination features derived with the different segmentation methods, and the prognostic performance is similar. Despite frequently missing small lesions with low 18F-FDG avidity, segmentation with a fixed threshold of SUV4.0 required the least manual adaptation, which is critical for future research and implementation in clinical practice. However, the importance of small, low 18F-FDG–avidity lesions should be addressed in a larger cohort of cHL patients.
The 18F-FDG PET/CT scan is standard of care for staging and response evaluation in the treatment of classical Hodgkin lymphoma (cHL) (1). Optimizing baseline risk stratification contributes to the implementation of individualized treatment strategies aiming to lower toxicity in patients with favorable prognostic characteristics and identification of patients with unfavorable prognostic characteristics early for treatment with other therapies (2–4). The use of quantitative PET features to improve risk stratification could be implemented in clinical practice if workflows are optimized.
Several studies have shown that metabolic tumor volume (MTV) is a potential prognostic marker in newly diagnosed (ND) and relapsed/refractory (R/R)-cHL (4–11). However, there are different methods for assessing MTV, and there is no consensus which method performs best in cHL patients in terms of prognostic performance, ease of use, and interobserver variability (12). MTV assessment is especially challenging in disseminated diseases such as lymphoma. cHL is a heterogeneous disease that is typically localized in the mediastinal and paraaortic regions, mainly affecting young patients who frequently show high physiologic 18F-FDG uptake in brown fat and muscles (1). These regions with high physiologic 18F-FDG uptake impede accurate delineation of tumor lesions nearby. Therefore, it is important to evaluate different segmentation methods specifically for cHL.
Although manual segmentation is the current standard for determining MTV, it is time-consuming and prone to interobserver variability (12). Semiautomatic segmentation includes algorithms that select regions with high 18F-FDG uptake above the threshold of a certain SUV. Segmentation of the MTV can be performed by either predefining regions of interest in which lesions will be automatically selected or by starting with automatic segmentation and deleting regions with high physiologic 18F-FDG uptake (e.g., brain, liver, kidneys) thereafter. Although the segmentation method applied can significantly impact the MTV, it is unknown how each method affects other quantitative PET radiomics features, such as patient-level dissemination parameters (13–17). Besides, no comparative studies have been performed that address representativeness of the segmented MTV with the visual interpretation of the MTV in cHL patients.
The aim of our research was to evaluate the delineation and completeness of lesion selection, and the need for manual adaptation with 6 different semiautomatic segmentation methods, and to assess the influence of the segmentation method on the prognostic value of MTV, intensity, and dissemination radiomics features in scans of cHL patients.
MATERIALS AND METHODS
Study Population
PET/CT scans from ND-cHL patients were collected from study cohorts of the Amsterdam UMC (n = 35) (2,18). PET/CT scans of patients with RR-cHL were collected from 3 clinical trials conducted in Amsterdam UMC, The Netherlands (n = 47) and Memorial Sloan Kettering Cancer Center, New York (n = 23) (2–4). All patients had biopsy-proven cHL, and the PET/CT scan was obtained before the start of therapy. All patients provided written informed consent for participation in the clinical trials (NCT02280993, NCT00255723, NCT01508312) or biobank cohort (18) of which the study protocols were approved by Institutional Review Boards and Ethics Committees of the centers that conducted the trials. For secondary use of data for this analysis, a waiver was obtained from the Ethics Committee.
18F-FDG PET/CT Scans and Quality Control
The PET/CT systems used to acquire the scans were EANM Research GmbH (EARL, Europe)– or American College of Radiology (ACR, United States)–accredited (19). PET/CT scans were deidentified at the participating centers and centrally collected. PET scans that did not meet the following 4 criteria, described by European Association of Nuclear Medicine guidelines (19), were excluded from analysis: plasma glucose < 11 mmol/L; reconstruction of attenuation-corrected PET according to guidelines described by EARL or ACR; total image activity (MBq) between 50% and 80% of the total injected 18F-FDG activity or liver SUVmean between 1.3 and 3.0; and essential PET acquisition data and clinical data available (19).
Segmentation of the Volume of Interest (VOI)
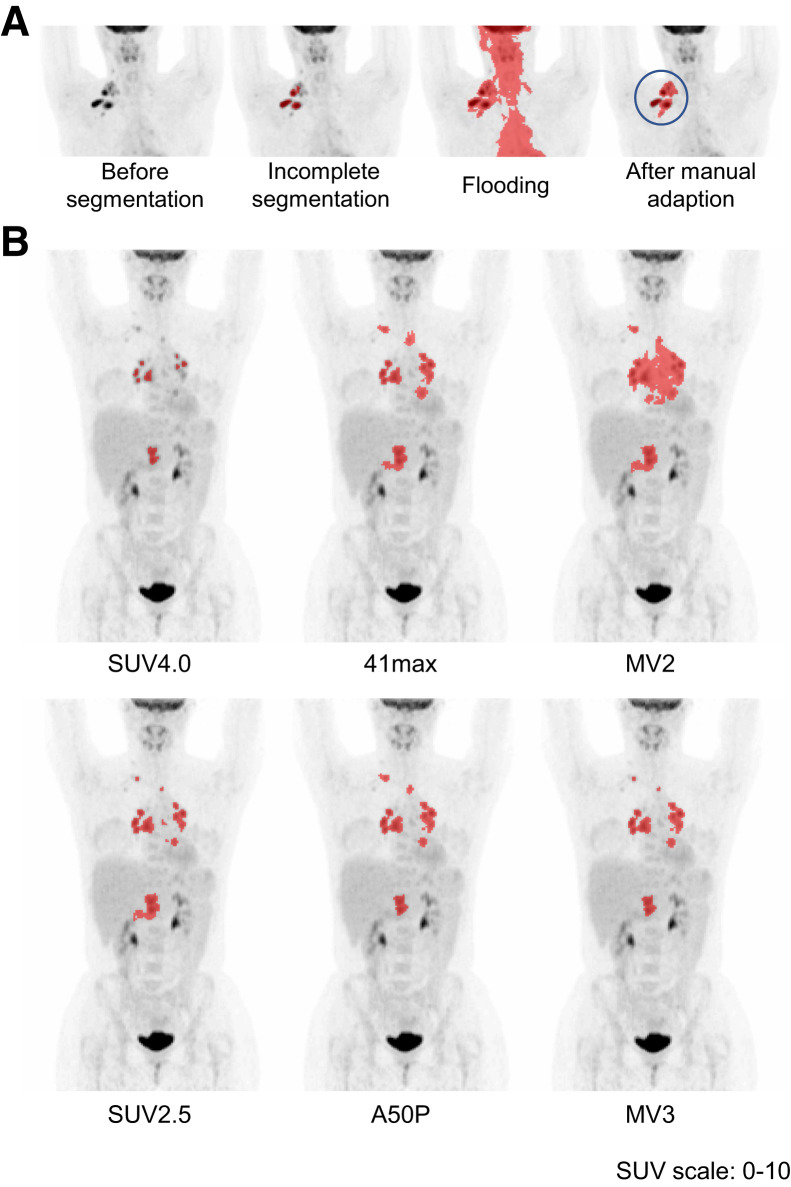
Attenuation-corrected PET scans were analyzed using the ACCURATE tool (20). Six different semiautomatic methods were used for each scan to select the VOI: 2 fixed thresholds of SUV4.0 and SUV2.5, 2 relative thresholds of 41% of SUVmax (41max) and a contrast-corrected 50% of SUVpeak (A50P), and 2 majority vote (MV) methods selecting voxels that are chosen with ≥2 (MV2) and ≥3 (MV3) of the previously mentioned fixed or relative methods, respectively. The VOI was delineated by automatic preselection of 18F-FDG–avid structures using the 6 different segmentation methods and a volume threshold of ≥3 mL. Nontumor regions were deleted and lymphoma lesions < 3 mL were added with single mouse clicks. If tumor regions were adjacent to nontumor 18F-FDG–avid regions (e.g., heart, liver, bladder), nontumor regions were either removed manually or tumor segmentation was restricted by placing a border or mask, which prevented selection of lesions outside the border (Fig. 1A). Only focal extranodal and splenic lesions were included in the VOI. A global increase in 18F-FDG uptake of the spleen or bone marrow was not included in the VOI. Delineations were performed under supervision of a nuclear medicine physician.
FIGURE 1.
Examples of semiautomatic segmentation. (A) Minimal-intensity projection (MIP) of the PET scan before segmentation; automatic selection with the 41max method missed multiple lesions; adding missing lesions resulted in flooding into the heart, tonsils, and brain; manual adaptation by placing a border around the volume of interest before segmentation resulted in complete selection. (B) Segmentation with SUV4.0 was scored as “missing minor lesions” and “representative delineation.” Segmentation with SUV2.5, 41max, A50P, MV2, and MV3 were scored as “complete segmentation” with “overestimation of delineation.” Segmentation with 41max flooded into the heart and required minor manual adaptation. Segmentation with MV2 flooded into the heart and liver and required major manual adaptations.
Quality Scores of Representativeness of Segmentations Compared with Visual Judgment
The quality of the segmentation by the 6 different methods was assessed using 3 quality score (QS) criteria (Table 1): completeness of selection of the VOI (i.e., were all tumor-lesions selected); requirement of manual adaptation after semiautomatic segmentation (i.e., manual removal of nontumor regions); and delineation quality of the VOI (i.e., does the VOI border reflect the visual interpretation of the 18F-FDG–avid tumor area on the PET scan?).
TABLE 1.
Definitions of Quality Scores for Visual Assessment of Segmentation Quality
| Quality score | Level | Definition |
|---|---|---|
| Completeness of selection | Complete | All visible tumor lesions are selected. |
| Missing minor lesions | Missing lesions are < 3 mL and within the selected VOI region (e.g., considered not to influence the Dmax). | |
| Missing major lesions | Lesions are missing that are either ≥ 3 mL or outside the selected VOI region (e.g., considered to influence the Dmax). | |
| Manual adaptation | No adaptation | No manual adaptation is required. Adding lesions with single mouse clicks is not considered manual adaptation. |
| Minor adaptation | Manual adaptation is required to obtain a representative selection of the VOI by removing a maximum of 1 nontumor region. | |
| Major adaptation | Extensive manual adaptation is required by removing > 1 nontumor region. | |
| Delineation | Representative | Delineation of VOI borders is representative of the visual interpretation of the tumor. |
| Underestimation | Delineation of VOI borders is underestimated. | |
| Overestimation | Delineation of VOI borders is overestimated. |
Two reviewers performed the QS assessment for each of the 6 segmentations for all scans, masked to patient outcome. Completeness of selection and delineation QS were assessed independently, followed by a consensus meeting in which the reviewers reached a consensus on all discrepancy scores and assigned a final QS to each segmentation. The manual adaptation QS was assessed in consensus between the reviewers during review of the segmentation of scans. An example of the QS assessment by the 6 segmentation methods is included in Figure 1B.
Radiomics Feature Extraction
RaCat software (developed by Professor Ronald Boellaard; Amsterdam UMC) was used to extract 18 patient-level dissemination features from the complete MTV at patient level (21). Dissemination features included several novel features addressing interlesional heterogeneity based on distance, volume, SUVmax, and SUVpeak (the 1 mL with the highest SUV within the VOI). In addition, MTV, SUVmax, SUVpeak, SUVmean, and total lesion glycolysis were extracted from the VOI. An overview of all features and its definitions are provided in Supplemental Table 1 (supplemental materials are available at http://jnm.snmjournals.org).
Statistical Analysis
QS of segmentations were analyzed descriptively and compared using χ2 tests for the whole cohort and separately for ND-cHL and RR-cHL patients. MTV, intensity, and dissemination radiomics features were compared between the ND-cHL and RR-cHL cohorts using the Wilcoxon rank sum test for nonparametric data. Further analyses were performed on the whole cohort. Correlations of MTV, intensity, and dissemination radiomics features among the 6 different segmentation methods were assessed using Spearman rank coefficients correlation. Receiver-operating-characteristics analysis was used to calculate the area under the curve (AUC) for each feature per segmentation method on the whole cohort. An event was defined as the occurrence of progressive disease within 3 y, and patients who died without progression were excluded. AUC curves were compared using a paired t test as described by DeLong et al. (22).
Statistical analysis was performed using R software (version 4.0.3; R Core Team). A P value of < 0.05 was considered statistically significant.
RESULTS
Patient Characteristics
A total of 105 PET/CT scans of patients with ND-cHL (n = 35) and RR-cHL (n = 70) were included in the analysis (Supplemental Table 2). A comparison of radiomics features between ND-cHL and RR-cHL showed no significant differences for most features, except for MTV, SUVpeak, and Dvol (the maximum difference in volume between lesions), which were all higher in ND patients than in RR patients (Supplemental Table 3).
Quality Scores of Segmentations
Agreement of QS assessment between the 2 reviewers was high (91% for segmentation quality and 82% for delineation quality).
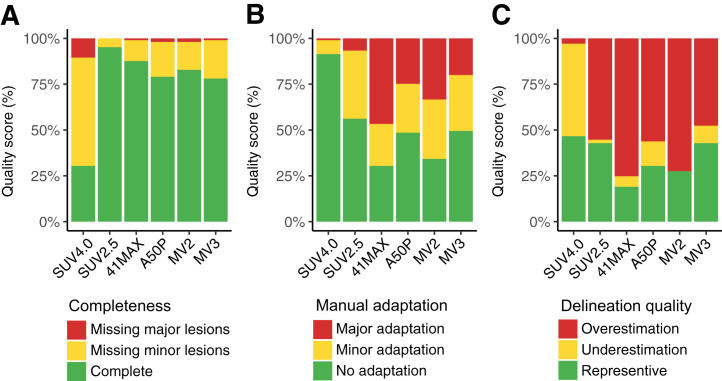
Segmentation resulted in complete selection of all lesions in most cases (Fig. 2A; Supplemental Table 4). SUV2.5 showed the highest rate of complete selection, followed by 41max, MV2, A50P, and MV3, while SUV4.0 frequently missed minor (59%) and major (10%) lesions. When the SUV4.0 method was used, 91% of scans could be segmented without any manual adaptation (Fig. 2B). The SUV2.5 method required minor adaptations in 37% of scans and 7% major adaptations. When the 41max and MV2 methods were used, only 30% and 34% of scans could be segmented without manual adaptation, and in 47% and 33% of cases, major manual adaptations were required, respectively. When A50P and MV3 were used, about 50% of scans did not require manual adaptation. None of the methods resulted in a high percentage of representative delineation of tumor borders (Fig. 2C). SUV4.0, SUV2.5, and MV3 resulted in representative delineation in about 50% of cases, whereas SUV4.0 tended to underestimate the MTV and SUV2.5 and MV3 tended to overestimate the MTV in the remaining cases. The 41max, A50P, and MV2 methods resulted in representative delineation in less than 30% and usually overestimated the MTV.
FIGURE 2.
Quality scores (QS) of segmentation methods. (A) Completeness of selection. (B) Manual adaptations required for representative segmentation. (C) Delineation of tumor borders.
No significant differences were observed for QS between ND and RR patients, except for completeness of selection in which complete selection rates were higher in RR patients than in ND patients with 41max, A50P, or MV3 (Supplemental Fig. 1).
Comparison of Features
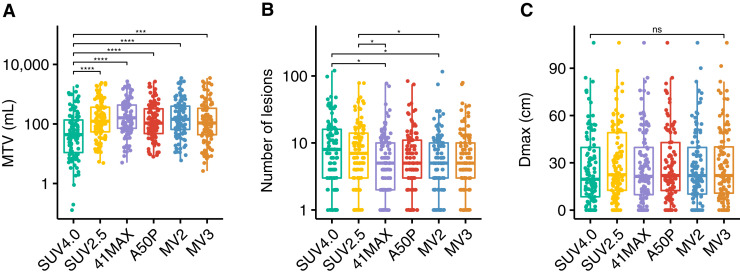
MTV differed significantly among the segmentation methods. The median MTV per method ranged between 44 and 143 mL (Fig. 3; Supplemental Table 5). SUV4.0 resulted in a significantly lower MTV than all other segmentation methods (P < 0.001). The number of lesions was significantly lower with 41max and MV2 than with SUV4.0 and SUV2.5 segmentation methods (P < 0.05). Dmax (the maximum distance between 2 lesions) was not significantly different among the segmentation methods.
FIGURE 3.
Radiomics features derived with 6 different semiautomatic segmentation methods. (A) MTV in mL. (B) Number of lesions. (C) Dmax in cm. *P < 0.05. ***P < 0.001. ****P < 0.0001. ns = not significant.
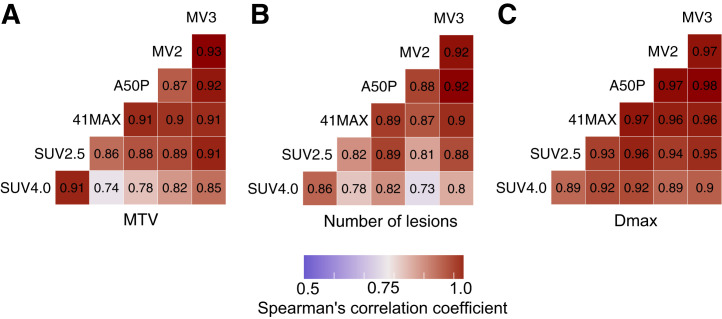
MTV, the number of lesions, and Dmax showed high correlations among most methods (Fig. 4; Supplemental Table 6). For MTV and the number of lesions, the highest correlations were observed between the 2 fixed methods (SUV4.0 and SUV2.5), and between the relative and MV methods, with lower correlations between the fixed and relative or MV methods. SUVmax and SUVpeak had identical median values and were strongly correlated (R = 1) across all methods. Dissemination features addressing differences in volume or SUVpeak among lesions showed lower correlations between SUV4.0 and the other 5 segmentation methods (Supplemental Table 6).
FIGURE 4.
Spearman rank correlation coefficients for radiomics features among different segmentation methods. (A) MTV. (B) Number of lesions. (C) Dmax. All correlations assessed had a P value of <0.01.
To assess the effect of incomplete selection of lesions, several features derived with SUV4.0 were plotted against SUV2.5 (Supplemental Fig. 2). Scans that missed major lesions with SUV4.0 did not show large deviations in the correlation between SUV4.0 and SUV2.5 when compared with scans that had complete selection or missed only minor lesions.
Prognostic Performance per Method
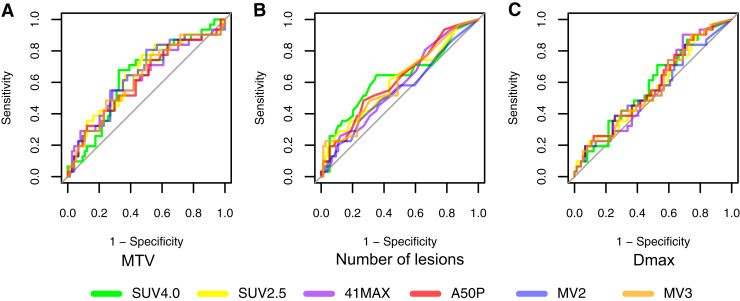
Except for MV2, the AUC of the receiver-operating characteristics did not differ significantly among the segmentation methods for all features assessed (Fig. 5; Supplemental Table 7). The highest AUCs were observed for MTV (range, 0.62–0.65), total lesion glycolysis (range, 0.63–0.65), number of lesions (range, 0.55–0.63), spread in volume (VolSpread) (range, 0.58–0.65), and the difference in SUVpeak between the hottest lesion and all other lesions (DSUVpeakSumHot) (range, 0.56–0.63). Of all methods MV2 showed the lowest AUC for the various features (median AUC of all variables, 0.55). The other 5 methods showed comparable median AUCs, with the highest median AUC of all variables of 0.62 for SUV4.0.
FIGURE 5.
Prognostic performance of radiomics features per method assessed by area under the curve of receiver operating characteristics analysis. (A) MTV. (B) Number of lesions. (C) Dmax.
DISCUSSION
MTV has shown prognostic value in cHL, but the use of different segmentation methods hampers direct comparisons between studies (4–10). This is especially true if a cutoff for MTV is used to divide patients in low- and high-risk groups, since absolute MTV values significantly differ between methods. Harmonization of MTV assessment enables the evaluation of MTV as a prognostic marker in cHL in a multicohort setting. The same holds for other quantitative PET features including dissemination features.
We evaluated the completeness of lesion selection, need for manual adaptations, and delineation quality of 6 semiautomatic segmentation methods to assess MTV and dissemination features in 105 cHL patients. Segmentation with SUV4.0 required the least manual adaptations because this method, in contrast to other methods, rarely floods into regions with high physiologic 18F-FDG uptake. SUV2.5 often required minor adaptations, but seldomly major adaptations. Although segmentation using SUV4.0 frequently did not include all lesions (missing those with a SUV < 4.0), these lesions were often small and scans with major lesions missing did not cause significant deviations in the correlation between SUV4.0 and SUV2.5, which was the most complete method. Additionally, the prognostic performance between all methods was similar, and SUV4.0 and SUV2.5 showed the highest AUCs for most variables.
The results of our evaluation suggest that small lesions with low SUV uptake, that are frequently not included with SUV4.0, probably do not contain critical prognostic information, which could be partly explained by the low contribution to total MTV of small lesions. However, small lesions could still influence dissemination features, of which the prognostic value needs to be established in a larger set of patients with more progression events. Additionally, small low-uptake lesions are potentially of higher importance in response assessment, thus, SUV4.0 may be less suitable for quantitative interim PET analyses in cHL (1).
All segmentation methods, except SUV4.0, frequently overestimated the MTV assessed by visual interpretation. This overestimation may be less relevant when using only patient-level features, as correlations among methods are high; however, lesion-based radiomics analysis involving texture features may be adversely affected by oversegmentation, that is, by selection of voxels that are not part of the tumor (23). Methods that tended to overestimate the MTV also showed a lower number of lesions, because lesions close to each other were frequently clustered into 1 lesion, as illustrated in Figure 1. This explains the discrepancy that SUV4.0 often misses small or low-uptake lesions but still shows the highest number of lesions (Fig. 3).
In a recent comparison of 6 segmentation methods in diffuse large B-cell lymphoma (DLBCL), a fixed threshold of SUV4.0 was considered the best method to derive MTV (24). Similar to our findings, MTV significantly differed among the methods, but the prognostic performance was comparable. Interestingly, method performance in DLBCL at interim PET has been shown to depend on the lesional SUVmax, in which lesions with SUVmax < 10 were delineated most successfully using MV3, whereas SUV4.0 was most successful in lesions with SUVmax > 10 (25). Correlations for MTV were significantly higher in our cohort than previously described for DLBCL, possible because our correlations were assessed after manual adaptation (24,25). Additionally, and contrary to our findings, the 41max, A50P, and MV3 methods yielded lower exact MTV values than SUV4.0 in baseline DLBCL, showing that performance of different methods can be disease-dependent. In our cohort, 41max resulted in the highest MTV, which can be explained by the lower SUV in our cHL cohort (median SUVmax, 11.3), compared with DLBCL patients (median SUVmax 22.6) (26). Because SUVmax is a patient-level feature, and cHL shows heterogeneous 18F-FDG uptake, other lesions within a patient may have a much lower SUVmax, resulting in overestimation of the MTV and flooding with relative methods such as 41max.
Methods based on relative thresholds (e.g., 41max and A50P) are less suitable for assessing MTV in diseases with heterogeneous 18F-FDG uptake, such as cHL, because a high lesional SUVmax may exclude the lower avid voxels of the lesion, causing undersegmentation. A low lesional SUVmax, however, results in a low threshold, leading to flooding into regions with physiologic 18F-FDG uptake. The MV methods could not overcome this disadvantage of the relative methods. MV2 frequently uses voxels that are being selected with 41max and A50P, and although MV3 needs a third method this did not result in better segmentation than methods with a fixed threshold.
Although the 41max method is recommended for MTV segmentation and has been used in several lymphoma studies, this method requires extensive manual adaptation, which is time-consuming and more susceptible to interobserver variation (13,15,19). Additionally, the recommendation for 41max is based on solid malignancies rather than disseminated diseases such as cHL, and 41max has not been compared directly to a fixed threshold of SUV4.0 (27–29). Therefore, this recommendation should be reconsidered for cHL.
CONCLUSION
For PET/CT segmentation in cHL, we showed a high correlation among MTV and most intensity and dissemination features derived with different segmentation methods, except for dissemination features addressing differences in volume and SUVmax/peak. The prognostic performance of all features is comparable among the methods. The SUV4.0 method required the least manual adaptation, which is critical for future research and implementation in clinical practice. Although segmentation with SUV4.0 often missed small lesions with low18F-FDG avidity, which may in particular affect dissemination features such as the Dmax, this seemed not to influence the prognostic performance of most features, including Dmax. However, to be conclusive about recommending SUV4.0 for cHL segmentation, the prognostic importance of small lesions with low uptake should be evaluated in a larger cohort of cHL patients with more progression events.
DISCLOSURE
This work was financially supported by SHOW (Dutch Foundation of hematooncologic research, a nonprofit donation fund of Amsterdam UMC). There is no financial support for this work that could have influenced the outcomes described in the article. Ronald Boellaard is a scientific advisor and chair of the EARL accreditation program. Marie José Kersten is a consultant for BMS/Celgene, Kite/Gilead, Miltenyi Biotech, Novartis, and Takeda and has received honoraria from Kite/Gilead, Novartis, and Roche as well as research funding from Kite/Gilead, Takeda. Craig H. Moskowitz is an advisor for and received research funding from Celgene, Genentech, Merck, and Seattle Genetics. Alison J. Moskowitz is a consultant for Takeda, Imbrium Therapeutics, Janpix, Merck, and Seattle Genetics and has received research funding from Incyte, Merck, Seattle Genetics, ADC Therapeutics, Beigene, Miragen, and Bristol-Myers Squibb. Josée M. Zijlstra has received research funding from Takeda.
ACKNOWLEDGMENTS
We thank the patients and collaborating investigators who kindly supplied their data.
KEY POINTS
QUESTION: Which segmentation method provides the best delineation and completeness of lesion selection with the least manual adaptation in scans of cHL patients, and what is the influence of the segmentation method on the prognostic value of MTV, intensity, and dissemination radiomics features?
PERTINENT FINDINGS: Segmentation with a fixed threshold of SUV4.0 required the least manual adaptation, with SUV2.5 resulting in the most complete selection of all lesions. The prognostic performance of features was comparable per segmentation method, and there was a high correlation for MTV and intensity features, but not for all dissemination features, assessed with the different methods.
IMPLICATIONS FOR PATIENT CARE: Semiautomated estimation of MTV, intensity, and dissemination radiomics features in cHL patients is feasible using a method with a fixed threshold.
REFERENCES
- 1. Cheson BD, Fisher RI, Barrington SF, et al. Recommendations for initial evaluation, staging, and response assessment of Hodgkin and non-Hodgkin lymphoma: the Lugano classification. J Clin Oncol. 2014;32:3059–3068. [DOI] [PMC free article] [PubMed] [Google Scholar]
- 2. Kersten MJ, Driessen J, Zijlstra JM, et al. Combining brentuximab vedotin with dexamethasone, high-dose cytarabine and cisplatin as salvage treatment in relapsed or refractory Hodgkin lymphoma: the phase II HOVON/LLPC Transplant BRaVE study. Haematologica. 2021;106:1129–1137. [DOI] [PMC free article] [PubMed] [Google Scholar]
- 3. Moskowitz CH, Matasar MJ, Zelenetz AD, et al. Normalization of pre-ASCT, FDG-PET imaging with second-line, non-cross-resistant, chemotherapy programs improves event-free survival in patients with Hodgkin lymphoma. Blood. 2012;119:1665–1670. [DOI] [PMC free article] [PubMed] [Google Scholar]
- 4. Moskowitz AJ, Schoder H, Gavane S, et al. Prognostic significance of baseline metabolic tumor volume in relapsed and refractory Hodgkin lymphoma. Blood. 2017;130:2196–2203. [DOI] [PMC free article] [PubMed] [Google Scholar]
- 5. Albano D, Mazzoletti A, Spallino M, et al. Prognostic role of baseline 18F-FDG PET/CT metabolic parameters in elderly HL: a two-center experience in 123 patients. Ann Hematol. 2020;99:1321–1330. [DOI] [PubMed] [Google Scholar]
- 6. Milgrom SA, Elhalawani H, Lee J, et al. A PET radiomics model to predict refractory mediastinal Hodgkin lymphoma. Sci Rep. 2019;9:1322. [DOI] [PMC free article] [PubMed] [Google Scholar]
- 7. Rogasch JMM, Hundsdoerfer P, Hofheinz F, et al. Pretherapeutic FDG-PET total metabolic tumor volume predicts response to induction therapy in pediatric Hodgkin’s lymphoma. BMC Cancer. 2018;18:521. [DOI] [PMC free article] [PubMed] [Google Scholar]
- 8. Cottereau AS, Versari A, Loft A, et al. Prognostic value of baseline metabolic tumor volume in early-stage Hodgkin lymphoma in the standard arm of the H10 trial. Blood. 2018;131:1456–1463. [DOI] [PubMed] [Google Scholar]
- 9. Procházka V, Gawande RS, Cayci Z, et al. Positron emission tomography-based assessment of metabolic tumor volume predicts survival after autologous hematopoietic cell transplantation for Hodgkin lymphoma. Biol Blood Marrow Transplant. 2018;24:64–70. [DOI] [PMC free article] [PubMed] [Google Scholar]
- 10. Song MK, Chung JS, Lee JJ, et al. Metabolic tumor volume by positron emission tomography/computed tomography as a clinical parameter to determine therapeutic modality for early stage Hodgkin’s lymphoma. Cancer Sci. 2013;104:1656–1661. [DOI] [PMC free article] [PubMed] [Google Scholar]
- 11. Mettler J, Muller H, Voltin CA, et al. Metabolic tumour volume for response prediction in advanced-stage Hodgkin lymphoma. J Nucl Med. 2018;60:207–211. [DOI] [PMC free article] [PubMed] [Google Scholar]
- 12. Barrington SF, Meignan M. Time to prepare for risk adaptation in lymphoma by standardizing measurement of metabolic tumor burden. J Nucl Med. 2019;60:1096–1102. [DOI] [PMC free article] [PubMed] [Google Scholar]
- 13. Tutino F, Puccini G, Linguanti F, et al. Baseline metabolic tumor volume calculation using different SUV thresholding methods in Hodgkin lymphoma patients: interobserver agreement and reproducibility across software platforms. Nucl Med Commun. 2021;42:284–291. [DOI] [PubMed] [Google Scholar]
- 14. Martín-Saladich Q, Reynés-Llompart G, Sabaté-Llobera A, Palomar-Muñoz A, Domingo-Domènech E, Cortés-Romera M. Comparison of different automatic methods for the delineation of the total metabolic tumor volume in I-II stage Hodgkin Lymphoma. Sci Rep. 2020;10:12590. [DOI] [PMC free article] [PubMed] [Google Scholar]
- 15. Camacho MR, Etchebehere E, Tardelli N, et al. Validation of a multifocal segmentation method for measuring metabolic tumor volume in Hodgkin lymphoma. J Nucl Med Technol. 2020;48:30–35. [DOI] [PubMed] [Google Scholar]
- 16. Kanoun S, Tal I, Berriolo-Riedinger A, et al. Influence of software tool and methodological aspects of total metabolic tumor volume calculation on baseline [18F]FDG PET to predict survival in Hodgkin lymphoma. PLoS One. 2015;10:e0140830. [DOI] [PMC free article] [PubMed] [Google Scholar]
- 17. Weisman AJ, Kim J, Lee I, et al. Automated quantification of baseline imaging PET metrics on FDG PET/CT images of pediatric Hodgkin lymphoma patients. EJNMMI Phys. 2020;7:76. [DOI] [PMC free article] [PubMed] [Google Scholar]
- 18. Drees EEE, Roemer MGM, Groenewegen NJ, et al. Extracellular vesicle miRNA predict FDG-PET status in patients with classical Hodgkin Lymphoma. J Extracell Vesicles. 2021;10:e12121. [DOI] [PMC free article] [PubMed] [Google Scholar]
- 19. Boellaard R, Delgado-Bolton R, Oyen WJ, et al. FDG PET/CT: EANM procedure guidelines for tumour imaging: version 2.0. Eur J Nucl Med Mol Imaging. 2015;42:328–354. [DOI] [PMC free article] [PubMed] [Google Scholar]
- 20. Boellaard R. Quantitative oncology molecular analysis suite: ACCURATE. J Nucl Med. 2018;59(suppl 1):1753. [Google Scholar]
- 21. Pfaehler E, Zwanenburg A, de Jong JR, Boellaard R. RaCaT: an open source and easy to use radiomics calculator tool. PLoS One. 2019;14:e0212223. [DOI] [PMC free article] [PubMed] [Google Scholar]
- 22. DeLong ER, DeLong DM, Clarke-Pearson DL. Comparing the areas under two or more correlated receiver operating characteristic curves: a nonparametric approach. Biometrics. 1988;44:837–845. [PubMed] [Google Scholar]
- 23. Pfaehler E, Beukinga RJ, de Jong JR, et al. Repeatability of 18F-FDG PET radiomic features: a phantom study to explore sensitivity to image reconstruction settings, noise, and delineation method. Med Phys. 2019;46:665–678. [DOI] [PMC free article] [PubMed] [Google Scholar]
- 24. Barrington SF, Zwezerijnen B, de Vet HCW, et al. Automated segmentation of baseline metabolic total tumor burden in diffuse large B-cell lymphoma: which method is most successful? a study on behalf of the PETRA consortium. J Nucl Med. 2021;62:332–337. [DOI] [PMC free article] [PubMed] [Google Scholar]
- 25. Zwezerijnen GJ, Eertink JJ, Burggraaff CN, et al. Interobserver agreement in automated metabolic tumor volume measurements of Deauville score 4 and 5 lesions at interim 18F-FDG PET in DLBCL. J Nucl Med. 2021;62:1531–1536. [DOI] [PMC free article] [PubMed] [Google Scholar]
- 26. Eertink JJ, van de Brug T, Wiegers SE, et al. 18F-FDG PET baseline radiomics features improve the prediction of treatment outcome in diffuse large B-cell lymphoma. Eur J Nucl Med Mol Imaging. 2022;49:932–942. [DOI] [PMC free article] [PubMed] [Google Scholar]
- 27. Frings V, de Langen AJ, Smit EF, et al. Repeatability of metabolically active volume measurements with 18F-FDG and 18F-FLT PET in non-small cell lung cancer. J Nucl Med. 2010;51:1870–1877. [DOI] [PubMed] [Google Scholar]
- 28. Krak NC, Boellaard R, Hoekstra OS, Twisk JW, Hoekstra CJ, Lammertsma AA. Effects of ROI definition and reconstruction method on quantitative outcome and applicability in a response monitoring trial. Eur J Nucl Med Mol Imaging. 2005;32:294–301. [DOI] [PubMed] [Google Scholar]
- 29. Boellaard R, Krak NC, Hoekstra OS, Lammertsma AA. Effects of noise, image resolution, and ROI definition on the accuracy of standard uptake values: a simulation study. J Nucl Med. 2004;45:1519–1527. [PubMed] [Google Scholar]


