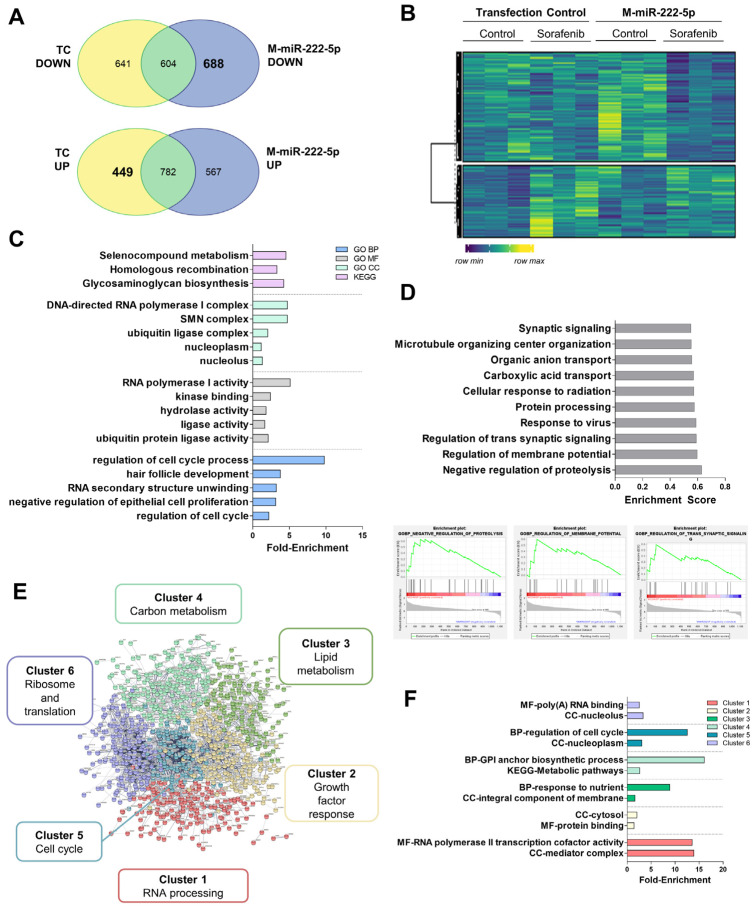
Figure 7.
RNA-sequencing data of miR-222-5p overexpression in HepG2 cells showed altered cell cycle and metabolic control. (A) Venn diagrams showing mRNAs regulated upon miR-222-5p mimics (M-miR-222-5p) compared to the transfection control (TC). (B) Heatmap of genes regulated by miR-222-5p. (C) Fold-enrichment values of the top five most significantly enriched GO BP, MF, CC, and KEGG pathways. (D) Top 10 significant hallmarks of GSEA downregulated after M-miR-222-5p. Plots were provided for the three most enriched terms. (E) Diagram showing clustering of the STRING analysis. (F) Fold-enrichment values of the top two most significantly enriched terms either in the GO BP, MF, CC, or KEGG pathways in each STRING cluster. Experiments were carried out as three independent replicates.

