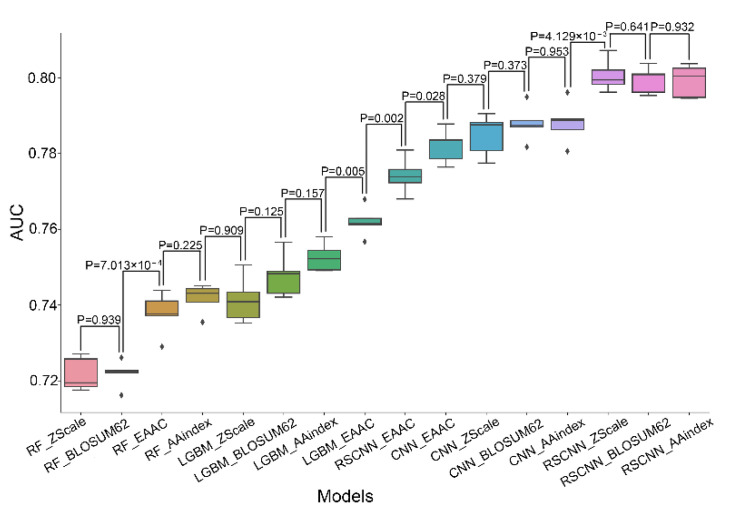
Figure 4.
AUC values of different classifiers in terms of five-fold cross-validation. The classifiers are displayed in ascending order of AUC values. The statistical differences between the neighboring classifiers were calculated using paired Student t-test. The name for each model is a combination of the names of the involved algorithm and the encoding feature.

