Figure 2.
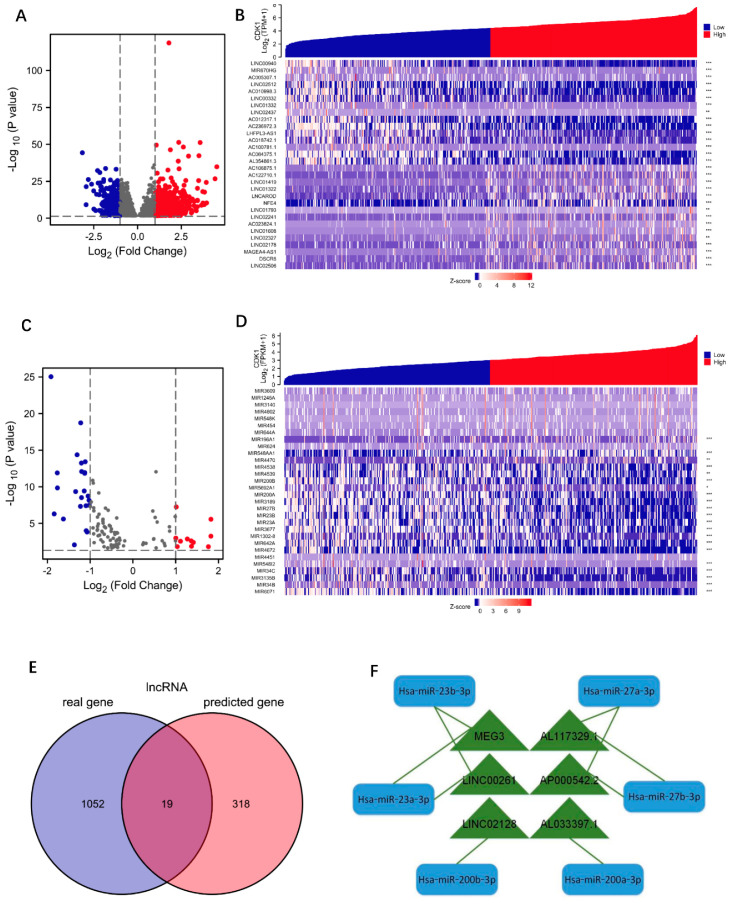
Exploration of CDK1-associated DEGs. (A) The volcano plots describe DElncRNAs. log2 foldchange > 1 or log2 foldchange < −1, * p < 0.05. (B) CDK1-associated co-expression heatmap with the top 30 DElncRNAs. Significance markers: ** p < 0.01; *** p < 0.001. (C) The volcano plots describe DEmiRNAs. log2 foldchange > 1 or log2 foldchange < −1, * p < 0.05. (D) CDK1-associated co-expression heatmap with the top 30 DEmiRNAs. Significance markers: ** p < 0.01; *** p < 0.001. (E) The lncRNAs related to CDK1 are represented by Venn diagram. (F) CDK1-associated lncRNA-miRNA regulatory network.

