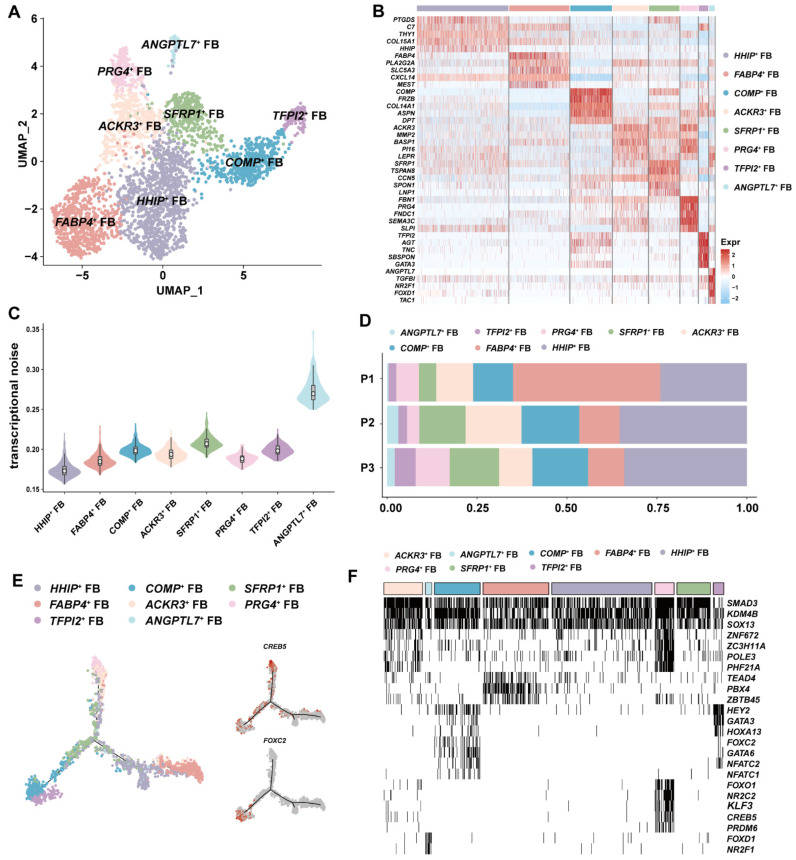
Figure 3.
Fibroblast heterogeneity in human GSVs. (A) The UMAP plot showing all FB cell subsets. (B) Heatmap showing the signature genes for each FB subset. (C) Transcriptional noise analysis showing that ANGPTL7+ FBs had the most variable expression patterns, reflecting a highly heterogenous nature in gene expression. (D) Cell ratio comparison identifying that ANGPTL7+ FBs were enriched in patient P2. (E) Pseudo-time analysis revealing that the connection of FB cell subsets was line with their spatial distribution. CREB5 regulated valvular FB development and FOXC2 impacted on lymphatic FB. (F) Identification of cell-subset-specific regulon by SCENIC. The regulons of SMAD3, KDM4B and SOX13 were universally switched on in all FB subsets.

