

Abstract
Background:
The clinical effect of photodynamic therapy (PDT) may be correlated with the degree of dysplasia of cancer tissues. The aim of this study was to compare the effects of cisplatin, silver nanoparticles (AgNps), and photodynamic therapy (PDT) using methylene blue (MB) photosensitizer on Head and Neck squamous cell carcinoma - cell line (HNSCC), Hep-2, through genes expression.
Methods:
Hep-2 cells were divided into four groups: group I as control and without any treatment, group II and III were treated by cisplatin and AgNps, respectively, and group IV were incubated with MB for four minutes followed by PDT using laser irradiation at 650 nm for 8 minutes. The resulting toxicity was assessed in cell lines using MTT cytotoxicity assay. Further, apoptosis and the response to treatment was examined via RT-qPCR.
Results:
MB-PDT inhibited the proliferation of Hep-2 cells. Following PDT, compared with AgNps cells and via MTT assay, a highly significant decrease was observed in cell proliferation in Cancer cells treated with AgNps and MB- PDT groups compared to cancer group cells and cancer cells treated with Cisplatin (p value< 0.001). Mechanistically, both the mRNA and protein expression levels of Bcl-2, Caspase-3, Cyclin-D, HIF-1, IL-8, MAPK-38, and ROS were found to be down regulated in Hep-2 cell line after MB-PDT.
Discussion
MB-PDT effectively killed Hep-2 cells in vitro, however, under the same conditions, the susceptibilities of the cell line to cisplatin, AgNps, and MB-PDT were different. Further studies are necessary to confirm whether this difference is present in clinical oral cancer lesions.
Key Words: Head and Neck squamous cell carcinoma (HNSCC) , silver nanoparticles (AgNps), photodynamic therapy (PDT), Methylene Blue (MB), Photosensitizer (PS)
Introduction
Light was first used 4000 years ago in ancient Egypt to treat vitiligo, but in the present century clinical usage of anticancer photodynamic therapy (PDT) began since 1970s (1). The basic of photodynamic therapy depends on the stimulation of a non-toxic compound called photosensitizer (PS) by specific light to generate reactive oxygen species (ROS) that can kill the cells (2, 3).
Methylene blue (MB) presents an excellent penetration in the cellular membrane due to the capacity of its benzene ring to concentrate in the cell organelle and double-stranded DNA. It has photochemical properties that produce an excellent quantum yield, hydrophilicity and low- cost effectiveness (4). Head and neck cancer (HNC) are the sixth most common cancer worldwide, accounting for> 350,000 deaths annually (5). HNCs are mostly squamous cell neoplasms that originate from the epithelial lining of the upper aerodigestive tract and are commonly referred to as head and neck squamous cell carcinoma (HNSCC) (6). While HNSCC is curable when diagnosed early, the prognosis is very poor when diagnosed at an advanced stage (7). Commonly used human cancer models include cancer cell lines and primary patient-derived tumor xenografts. Cancer cell lines are derived from primary patient tissue and have contributed tremendously to cancer research (8). Identification of the molecular changes' characteristic of epithelial dysplasia development and progression provides great insights into the mechanism of head and neck carcinogenesis (9). Cancer treatment options have rapidly expanded owing to the introduction of tumor-targeted therapy. The application of surgery is limited since there are many factors to consider when choosing a therapy for tumors in the oral cavity and maxillofacial region. Photodynamic therapy (PDT) has shown efficacy and is one of the current treatment options for patients with HNSCC. Multiple retrospective studies have investigated the relative benefits of PDT, and these reports have supported the benefit, safety, and efficacy of PDT in patients with oral cancer conditions (10). A systematic meta-analysis of cohort studies assessing the clinical effect of PDT in early-stage HNSCC patients showed no statistically significant difference in the complete response and recurrence between PDT and surgery (11). Despite successful treatment of oral cancer, the differences in sensitivity of HNSCC cells to PDT are rarely mentioned. The biological complexity of oral cancerous lesions (HNSCC) has increased the difficulty of designing a therapeutic regimen. Selection of the appropriate treatment programs should be based on the different responses to therapy among cells. Here, the present study examined the differential susceptibility of Hep-2 cells to cisplatin, AgNps and MB-PDT.
Materials and Methods
Cell line and Cell culture
The present study was done in the Medical Biochemistry and Molecular Biology Department (Tissue culture unit) of the Faculty of Medicine, Cairo University, Egypt. Squamous cell carcinoma cell line (Hep-2) was purchased from Cell Culture Department- VACSERA- EGYPT. HEP-2 cells (laryngeal carcinoma) were imported from the “American Type Culture Collection (ATCC)” in the form of frozen vials, with the passage number “43”. Origin species: Homosapiens (Human). Morphology: epithelial-like cells. Hep-2 cell line was grown in a sterile tissue 50 cm3 flask in complete medium containing Dulbecco’s modified Eagle’s medium (DMEM) supplemented with 10% fetal bovine serum (FBS) and antibiotics (100 U/ml penicillin and 100 mg/ml streptomycin), as described previously (12,13). The cells were incubated in 5% CO2 at 37 °C.
Cell culture groups and treatment
Wells of tissue culture plates were equally divided into four groups as follows:
Group I: Hep-2 without any therapy, serves as a control group, group II: as Hep-2 was treated with cisplatin, while group III: Hep-2 was treated with AgNps, and group IV Hep-2 treated by PDT.
Therapy with cisplatin
The cells were treated with 2.5 µg/ml of cisplatin (Mylan S.A.S, France).
Therapy with AgNps
Silver nanoparticles; (Nanostreams Egypt: NS0011) of 10 nm size, Polyvinylpyrrolidone (pvp) stabilized, and spherical in shape. The liquid form (100 ppm conc.) was prepared according to manufacturer instructions by adding 100 ml of distilled water for each 10 mg of the powder supplied.
Therapy with PDT
MB-PDT involved exposing cultured cells treated with a photosensitizer to laser irradiation. Hep-2 cells were incubated with 160 uM MB (Sigma-Aldrich) for 4 min and then irradiation by 650 nm diode laser ((PIOON S1, China) for 8 min. The de-tailed in vitro illumination system characteristics and data have been reported previously (14).
Laser irradiation
The culture dishes were wrapped with in the dark paper sheets with a hole of a diameter corresponding to the diameter of the laser spot area of the handpiece to avoid energy dispersion.
Cells were irradiated with diode laser (PIOON S1, China) in continuous wave mode parameters: 100 mW, wavelength of 650 nm, spot area of 0.5cm2. Cells were irradiated with laser probe fixed perpendicular to each plate and irradiation was carried in dark conditions. The cells distributed as there was empty wells between seeded wells cells to minimize unintentional dispersion of light between wells during laser application (15). So, laser applied directly on bottom of each well to decrease effect of laser scattering and over-exposure, wells surrounded each tested well were kept empty and black paper used as a box with circle hole just for the well (16).
Microscopic examination of cultured cancer cells
Hep-2 cell culture in different groups were examined under an inverted microscope (Leica®, Germany)
Cell proliferation 3-[4,5-dimethylthiazol-2-yl]-2,5-diphenyl tetrazolium bromide (MTT) assay.
The Hep-2 cells were cultivated in three 96-well tissue culture plates containing 103 cells/ml per well. The cells were incubated for 24 h before adding the drugs. The optimal cell number for cell viability assays was determined in preliminary experiments. At the end of the incubation period, the medium was removed, and the different lines of treatments were applied to wells for 24 h. Following 24 h, 20 µL of MTT (5 mg/mL) were added to cells and incubated for a further 4 h at 37 °C. The medium was removed and 100 µL formazan was added to each well. After 10 min of shaking, the absorbance values were measured at a range from 490 to 630 nm using an ELISA reader (Dynatech MRX 5000; Dynex, Chantilly, VA). MTT and formazan were obtained from TACSTM TREVIGEN1 8405 Hegerman Ct. Gaithersburg, supplied ready for use.
For studied genes expression
Hep-2 cells were cultivated in three 24 well tissue culture plates containing 105 cells/ml per well. The material of this study was divided into four groups of Hep-2 cell line regarding the different lines of treatment as follow the HepG-2 cells were divided into four groups.
RNA extraction
Total RNA was extracted from cultivated cells of all studied groups with RNA easy Mini Kit (Qiagen) according to the manufacturer's instructions. quantitation and purity assessment for RNA samples were done using the Nano Drop® (ND)-1000 spectrophotometer (Nano Drop Technologies, Inc. Wilmington, USA). The extracted RNA then stored at -80 °C until use.
Real-time quantitative PCR (qPCR)
SensiFAST™ SYBR® Hi-ROX One-Step Kit, catalog no.PI-50217 V had been formulated for highly reproducible first-strand cDNA synthesis and subsequent real-time PCR in a single tube in a 48-well plate using the Step One instrument (Applied Biosystem, USA). Normalization for variation in the expression of each target gene was performed referring to the mean critical threshold (CT) values of glyceraldehyde 3-phosphate dehydrogenase (GAPDH) housekeeping gene expression by the ΔΔCt method. Primers sequence for Bcl-2, Caspase-3, Cyclin-D1, HIF-1 were listed in Table 1.
Table 1.
Details about the base sequences of the primers used.
| Gene | Name | Direction and Primer sequence (5′-3′) |
|---|---|---|
| Bcl-2 | B-cell lymphoma 2 | Forward F: 5 -GGAGGGCACTT CC TGAG-3 |
| Reverse: 5 -GCCTGGCATCACGACT-3 | ||
| Caspase-3 | Nuclear factor E2-related factor 2 | Forward: 5′- CTCGGTCTGGTACAGATGTCGATG-3′ |
| Reverse: 5′- GGTTAACCCGGGTAAGAATGTGCA -3′ | ||
| Cyclin-D1 | Forward: 5′- GCACAGCTGTAGTGGGGTTCTAGGC | |
| Reverse: 5′- CAGGCGCAAAGGACATGCACACGGC | ||
| HIF-1 | Hypoxia-inducible factor | Forward: 5′ GGTTCACTTTTTCAAGCAGTAGG |
| Reverse: 5′- TGGTAATCCACTTTCATCCATTG | ||
| GAPDH(Internal Control) | Glyceraldehyde 3-phosphate dehydrogenase | Forward: 5'-CACCCTGTTGCTGTAGCCATATTC-3' |
| Reverse: 5'GACATCAAGAAGGTGGTGAAGCAG-3' |
Assessment of IL-8, MAP kinase and ROS by ELISA
The protein level of IL-8 (RayBio® Human IL-8 ELISA Kit, Parkway, US) MAP kinase ( LSBio,MAPK ELISA Kit, Washington, US) and (ROS ELISA Kit. Catalog no. BYEK2822) Chongqing Biospes Co., Ltd. were measured in the collected media. The spectrophotometric absorbance was assessed at 450 nm in accordance with the manufacturer’s instructions. The results were expressed as pg/mL.
Statistical analysis
The data are presented as mean±standard deviation of mean and one-way analysis of variance with Tukey's post hoc test for multiple groups of data using GraphPad Prism version7 (GraphPad Software, Inc., La Jolla, CA, USA). Where P value was set as (p< 0.05) to indicate a statistically significant difference.
Results
Microscopic pictures of different cultured cancer cells
Microscopic pictures showed significant decrease between cells treated with PDT in comparison with cells treated with Cisplatin, AgNps and control (Fig. 1).
Fig. 1.

Microscopic pictures of cultured cancer cells; A, Control cancer cells, B, Cells treated by Cisplatin, C, Cells treated by AgNps, and D, Cells treated by PDT.
MTT assay results
After treatment by 24 hours, Cell proliferation was determined. There is a significant decrease in cell proliferation in Cancer cells treated with Cisplatin (0.1±0.01), Cancer cells treated with AgNps (0.07±0.03) and Cancer cells treated with PDT (0.04±0.01) groups compared to cancer group (0.12±0.01). (p value <0.001).
Fig. 2.

Cell proliferation mean levels among different studied groups. Data were expressed as mean±SD, p value< 0.05 was significant. (*) denotes significant difference versus cancer group, (#) denotes significant difference versus Hep-2 + Cisplatin group, ($) denotes significant difference versus Hep-2 +AgNps group.
PCR results
Anti-apoptotic and apoptotic effects of different lines of treatment
Bcl-2 mRNA expression showed that There is a significant decrease in Cancer cells treated with Cisplatin (0.29±0.04), Cancer cells treated with AgNps (0.56±0.04) groups compared to cancer group (1.05±0.28). (p value< 0.001), but there is non-significant decrease between Cancer cells treated with PDT (0.85±0.22) and control group. (p value> 0.05).
Bcl-2 mRNA expression also showed significant increase between cells treated with AgNps and PDT in comparison with cells treated with Cisplatin. And there is significant increase in PDT comparing with AgNps (Fig. 3A).
Fig. 3.
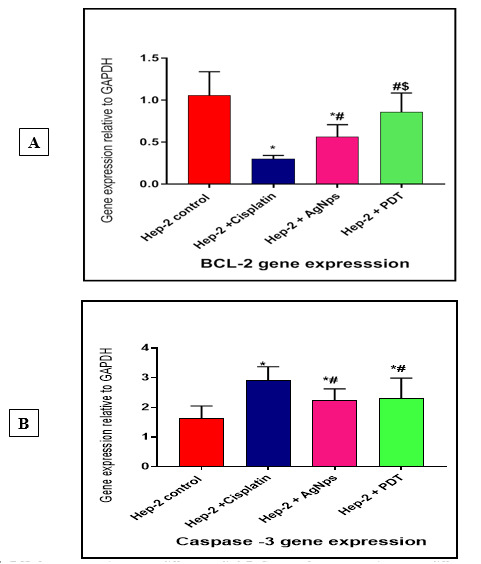
A, BCL-2 gene expression among different studied. B, Caspase -3 gene expression among different studied. Data were expressed as mean±SD, p value< 0.05 was significant. (*) denotes significant difference versus cancer group, (#) denotes significant difference versus Hep-2 + Cisplatin group, ($) denotes significant difference versus Hep-2 +AgNps group.
Caspase-3 mRNA expression showed that there is a significant elavation in Cancer cells treated with Cisplatin (2.93±0.45), Cancer cells treated with AgNps (2.23±0.39) and Cancer cells treated with PDT (2.29±0.69) compared to cancer group (1.63±0.41). (p value< 0.001).
Caspase-3 mRNA expression also showed significant elavation between cells treated with PDT in comparison with cells treated with Cisplatin and AgNps, but there is non-significant increase between Cancer cells treated with cisplatin and AgNps. (p value> 0.05) (Fig. 3B).
Cyclin D1 mRNA expression
Cyclin D1 mRNA expression showed that there is a significant decrease in cancer cells treated with Cisplatin (0.68 + 0.15), cancer cells treated with AgNps (1.62+ 0.6) and cancer cells treated with PDT (1.64+ 0.62) compared to cancer group (3.25 + 0.84). (p value <0.001).
CyclinD1 mRNA expression also showed significant decrease between cells treated with PDT in comparison with cells treated with Cisplatin and AgNps. But there is non-significant difference between cancer cells treated with Cisplatin and AgNps (p value > 0.05) (Fig. 4).
Fig. 4.

Cyclin D1 gene expression: mean levels among different studied groups. Data were expressed as Mean ± SD, p value <0.05 was significant. (*) denotes significant difference versus cancer group., (#) denotes significant difference versus Hep-2 + Cisplatin group, ($) Denotes significant difference versus Hep-2 + AgNps group.
HIF-1 mRNA expression mRNA expression
HIF-1 mRNA expression showed that there is a significant increase in cancer cells treated with Cisplatin (3.67+0.57), cancer cells treated with AgNps (2.405+0.53) and significant decrease in cancer cells treated with PDT (1.113+0.42) compared to cancer group (2.243+ 0.53). (p value< 0.001).
HIF-1 mRNA expression also showed significant decrease between cells treated with PDT in comparison with cells treated with Cisplatin and AgNps. But there is non-significant difference between cancer cells treated with Cisplatin and AgNps (p value> 0.05) (Fig. 5).
Fig. 5.

HIF-1gene expression: mean levels among different studied groups. Data were expressed as mean±SD, p value< 0.05 was significant. (*) denotes significant difference versus cancer group, (#) denotes significant difference versus Hep-2 + Cisplatin group, ($) denotes significant difference versus Hep-2 +AgNps group.
MAP kinase and IL-8 proteins expression in different studied groups
MAP kinase protein expression showed that there is a significant decrease in cancer cells treated with Cisplatin (384.8+157.9), cancer cells treated with AgNps (342.3+52.63) and cancer cells treated with PDT (208.8+77.71) compared to cancer group (627.5+100.9) (p value< 0.001).
MAP kinase protein expression also showed significant decrease between cells treated with PDT in comparison with cells treated with Cisplatin and AgNps (p value< 0.001). But there is non-significant difference between cancer cells treated with Cisplatin and AgNps (p value> 0.05) (Fig. 6A).
Fig. 6.
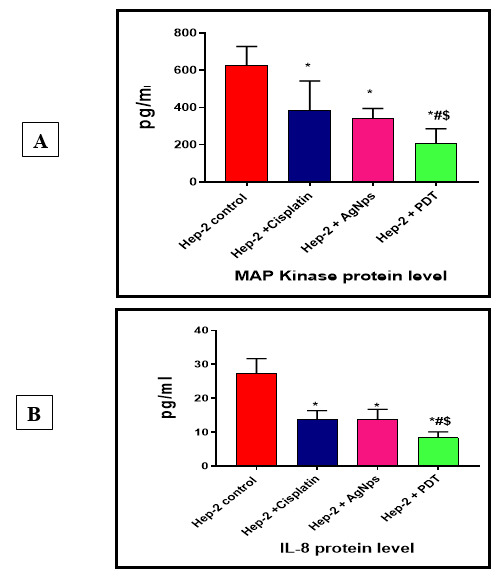
A, MAP Kinase protein level and B, IL-8 protein levels among different studied groups. Data were expressed as Mean±SD, p value< 0.05 was significant, (*) denotes significant difference versus cancer group, (#) denotes significant difference versus Hep-2 + Cisplatin group, ($) denotes significant difference versus Hep-2 +AgNps group.
IL-8 protein expression showed that there is a significant decrease in cancer cells treated with Cisplatin (13.83+2.56), cancer cells treated with AgNps (13.7+3.06) and cancer cells treated with PDT (8.35+1.76) compared to cancer group (27.2+4.44). (p value< 0.001).
IL-8 protein expression also showed significant decrease between cells treated with PDT in comparison with cells treated with Cisplatin and AgNps (p value< 0.001), but there is non-significant difference between cancer cells treated with Cisplatin and AgNps (p value> 0.05), (Fig. 6B).
ROS expression in different studied groups
ROS expression showed that there is a significant decrease in cancer cells treated with Cisplatin (5.2+0.25), cancer cells treated with AgNps (3.8+0.15) and cancer cells treated with PDT (6.3+0.5) compared to cancer group (7.4+0.084). (p value< 0.0001). ROS expression also showed significant decrease between cells treated with PDT and AgNps in comparison with cells treated with Cisplatin. (p value< 0.0001), and there is significant decreased between cancer cells treated with PDT and AgNps (p value> 0.0001) (Fig. 7).
Fig. 7.

Ros level among different study groups. Data were expressed as Mean±SD, p value< 0.05 was significant. (*) denotes significant difference versus cancer group, (#) Denotes significant difference versus Hep-2 + Cisplatin group, ($) Denotes significant difference versus Hep-2 +AgNps group.
Discussion
Currently, HNSCC is highly associated with poor prognosis and high recurrence rate, despite advances that have been made in diagnostic and therapeutic strategies such as surgery, chemotherapy, and radiotherapy (17). In addition, massive resection, and high dose chemotherapy of progressive and recurrent HNSCC tumors often give rise to clinical complications, particularly in older patients. Therefore, novel therapeutic agents and more advanced clinical management strategies are required to improve both the disease outcome and the quality of life of patients with HNSCC (17).
Cancer disease characterized by unlimited proliferation of cells depends on angiogenesis which is an important factor for proliferating and spreading of cancer cells. The process of tumorigenesis and rate of tumor progression depends on the balance between proliferation and apoptosis of the cancer cells (18).
The present study provided evidence for the higher apoptotic role of PDT, AgNps than Cisplatin in Hep-2 cell line. Also, there is increase in Bcl-2mRNA expression between cells treated with AgNps and PDT in comparison with cells treated with Cisplatin, these results were confirmed with caspase-3 mRNA expression that showed significant elevation between cells treated with PDT in comparison with cells treated with Cisplatin and AgNps, but there was non-significant increase between Cancer cells treated with cisplatin and AgNPs. This is agreement with other study showed that AgNPs induced cell death through caspase-3 activation. It is well established that the accumulation of reactive oxygen species induces and control apoptosis. The ability of AgNPs to generate such species led to phosphatidylserine externalization, DNA and nuclear fragmentation, mitochondria dysfunction, and caspase activity in cancer cells (19-21), In addition to PDT generate reactive oxygen species, which allow greater cancer cell destruction (22).
Photodynamic therapy (PDT) is a non-invasive method used light, oxygen, and a photosensitive compound known as photosensitizer (PS) (23). The PS methylene blue molecules produced destruction of the unwanted cells via apoptosis and necrosis through PDT (24). In this study, PDT with MB and 650 nm diode laser has an effective impact on HNSCC cell lines. Interestingly, MB alone with the use of a laser source bring a toxic effect on the HNSCC cell lines. In other tumor entities, studies demonstrated the effectiveness of MB-PDT as cancer treatment modality. For melanoma MB-PDT was suggested to be a cheap and efficient method to decrease the volume of malignant melanoma not eligible for surgery. In mice, MB-PDT showed a decrease of 99% in tumor volume and 75% in tumor weight compared with untreated mice (p< 0.05) (25). Previous studies are reporting MB-PDT to induce apoptosis in human lung adenocarcinoma cells. The study group found MB to sensitize A549 cells, adeno-carcinomic human alveolar basal epithelial cells to PDT-induced apoptosis (26).
According to the present study results, marked oxidative stress damage was detected in cancer cell line groups. ROS expression showed significant increase between cells treated with PDT and AgNps in comparison with cells treated with Cisplatin and there was highly significant increase between cancer cells treated with PDT and AgNps.
This was manifested by induction of oxidative stress in different cell lines reported that apoptosis is the major cell death mechanism in the cellular response to PDT, which is associated with characteristic morphological and biochemical modifications (27).
Furthermore, AgNPs can enter the cells and translocate into the mitochondria, nucleus, and redox active organelles that result in the formation of ROS. In many tumor and non-tumor cell lines, ROS affect membrane destruction, mitochondrial damage, oxidative stress-related mRNA and DNA damage, and eventual cell death by apoptosis (28).
However, Cis-diamminedichloroplatinum (II) (cisplatin) is a platinum-based chemotherapy agent commonly used in combination with other drugs in the treatment of several types of human cancers, including HNSCC. Cisplatin induces apoptosis by multiple mechanisms including the induction of DNA damage, which overwhelms the cancer cell’s DNA repair mechanisms. However, repeated treatment cycles often lead to acquired platinum-based chemoresistance of cancer cells. This results in the use of higher doses of the drug, which can cause sever toxicities (29-30).
Miao et al. (2019) demonstrated that the members of MAPKs are as key kinases in regulating apoptosis and inflammation. MAPK regulates its downstream transcription factor nuclear factor-kappa B (NF-κB), and subsequently enhances the expression of cytokines. Blocking the MAPK pathway can inhibit the production of pro-inflammatory cytokines, and then reduce apoptosis of normal epithelium but facilitate apoptosis of damaged inflammatory cells (31).
Cisplatin has been shown to cause activation of extracellular signal-regulated kinase (ERK) in several cell types although there are controversies whether activation of ERK prevents or contributes to cisplatin induced cell death (32). Importantly, we showed a significant decrease in MAP kinase protein expression between Hep-2 cells treated with PDT in comparison with cells treated with Cisplatin and AgNPs, but there were non-significant differences between Cancer cells treated with Cisplatin and AgNPs. Among pro-inflammatory cytokines, IL-8, part chemokine family that was originally classified as neutrophil chemoattractant play an important role in cancer invasion, angiogenesis, and metastasis (33). Linkov et al (34) and Hoffmann et al (35) showed an elevated in IL-8 concentration in patients with HNSCC, although with limited statistical significance. Similarly, Gokhale et al (36) demonstrated that IL-8 was not increased in patients with a new diagnosis of HNSCC but was increased in patients with disease recurrence or metastatic HNSCC. In the present study we showed the effect of Cisplatin, AgNPs and PDT on the production of inflammatory cytokines in Hep-2 cell line. IL-8 protein expression showed significant decrease between cells treated with PDT in comparison with cells treated with Cisplatin and AgNPs, but there is non-significant difference between Cancer cells treated with Cisplatin and AgNPs.
The HIF-α level is often up-regulated in the hypoxic microenvironment of solid tumors, which contributes to cancer treatment failure (37). Many studies have proven that free radical species and ROS up-regulate HIF-1α level (38). To date, various strategies have been proposed to modify the tumor microenvironment (TME) and improved the tumor’s oxygen level to improve the outcome of radiotherapy, chemotherapy, and immunotherapy. AgNPs attenuate HIF-1α and HIF-2α accumulation and suppress the transcriptional activity of HIF-α, very likely by increasing the endogenous oxygen. Other study demonstrated that AgNPs inhibit HIF-1 function by attenuating its protein accumulation and downstream target expression, which provides new insight into the mechanism of cytotoxicity and angiogenesis induced by AgNPs (39).
PDT-induced tissue hypoxia as a result of vascular damage and photochemical oxygen consumption limits the efficacy of this modality (40). This may largely be due to hypoxia induced angiogenesis via hypoxia-inducible factor-1α (HIF-1α), a major transcription factor involved in angiogenesis, hematopoiesis and anaerobic energy metabolism. In our study, HIF-1α mRNA expression showed a significant decrease between cells treated with MB-PDT in comparison with cells treated with Cisplatin and AgNPs, even though, there is a non-significant difference between cancer cells treated with Cisplatin and AgNPs.
Cyclin D1 is a vital regulator of cell cycle progression and proto-oncogenes and regulates G1 to S phase progression in many different cell types and functions as a transcriptional regulator by regulating the activity of many transcription factors. In mammalian cells, DNA damage-causing agents, environmental stress, and viral infection seem to induce the ubiquitin-dependent degradation of cyclin D1 (41).
PDT and AgNPs treatment had an extensive effect on the expression of genes coding for proteins involved in regulation and maintenance of the cell cycle. The results of the current study indicated that Cyclin D1 mRNA expression showed significant decrease between cells treated with PDT in comparison with cells treated with Cisplatin and AgNPs. But there is non-significant difference between Cancer cells treated with Cisplatin and AgNPs while, the previous study noticeable that down-regulation of cyclin D1 after 24 h of exposure to AgNPs, whereas treatment with Ag+had no effect on the cell cycle (42). Previous study suggests that therapeutic agents have been observed to induce cyclin D1 degradation in human breast carcinoma cell lines (43-45).
MB-PDT effectively killed Hep-2 cells in vitro, however, under the same conditions, the susceptibilities of the cell line to cisplatin, AgNps and MB-PDT were different. Further studies are necessary to confirm whether this difference is present in clinical oral cancer lesions.
Acknowledgements
This research did not receive any specific grant from funding agencies in the public, commercial, or not-for-profit sectors.
The authors declare that there are no conflicts of interest.
References
- 1.Shi H, Peter J. Sadler. How promising is phototherapy for cancer?. British Journal of Cancer. 2020;123:871–873. doi: 10.1038/s41416-020-0926-3. [DOI] [PMC free article] [PubMed] [Google Scholar]
- 2.Tampa M, Sarbu M-I, Matei C, Mitran C-I, Mitran M-I, Caruntu C, et al. Photodynamic therapy: a hot topic in dermato-oncology. Oncol Lett. 2019;17(5):4085–4093. doi: 10.3892/ol.2019.9939. [DOI] [PMC free article] [PubMed] [Google Scholar]
- 3.Shi X, Zhang CY, Gao J, Wang Z. Recent advances in photodynamic therapy for cancer and infectious diseases. Wiley Interdiscip Rev Nanomed Nanobiotechnol. 2019;11(5):e1560. doi: 10.1002/wnan.1560. [DOI] [PMC free article] [PubMed] [Google Scholar]
- 4.Jiashing Yu, Chih-Chia H, Po-Yang Ch. Development of therapeutic Au–methylene blue nanoparticles for targeted photodynamic therapy of cervical cancer cells. ACS Appl Mater Interfaces. 2014;7(1):432–41. doi: 10.1021/am5064298. [DOI] [PubMed] [Google Scholar]
- 5.Ferlay J, Soerjomataram I, Dikshit R, Eser S, Mathers C, Rebelo M. Cancer incidence and mortality worldwide: sources, methods, and major patterns in GLOBOCAN 2012. Int J Cancer. 2015;136(5):E359–86. doi: 10.1002/ijc.29210. [DOI] [PubMed] [Google Scholar]
- 6.Warnakulasuriya S. Global epidemiology of oral and oropharyngeal cancer. Oral Oncol. 2009;45(4-5):309–316. doi: 10.1016/j.oraloncology.2008.06.002. [DOI] [PubMed] [Google Scholar]
- 7.Méry B, Rancoule Ch, Guy J, Espenel S, Wozny A, Battiston-Montagne P, et al. Preclinical models in HNSCC: a comprehensive review. Oral Oncol. 2017;65:51–56. doi: 10.1016/j.oraloncology.2016.12.010. [DOI] [PubMed] [Google Scholar]
- 8.Drost J, Clevers H. Organoids in cancer research. nature reviews cancer. 2018;18:407–418. doi: 10.1038/s41568-018-0007-6. [DOI] [PubMed] [Google Scholar]
- 9.Jerjes W, Upile T, Hamdoon Z, Mosse Ch, Akram S, Hopper C. Photodynamic therapy outcome for oral dysplasia. Lasers Surg Med. 2011;43(3):192–9. doi: 10.1002/lsm.21036. [DOI] [PubMed] [Google Scholar]
- 10.Cerrati E W, Nguyen SA, Farrar JD, Lentsch EJ. The efficacy of photodynamic therapy in the treatment of oral squamous cell carcinoma: a meta-analysis. Ear Nose Throat J. 2015;94(2):72–9. doi: 10.1177/014556131509400208. [DOI] [PubMed] [Google Scholar]
- 11.Nakaoka T, Ota A, Ono T, Karnan S, Konishi H, Furuhashi A, et al. Combined arsenic trioxide-cisplatin treatment enhances apoptosis in oral squamous cell carcinoma cells. Cell Oncol (Dordr). 2014;37(2):119–29. doi: 10.1007/s13402-014-0167-7. [DOI] [PubMed] [Google Scholar]
- 12.Abdelgawad Latifa Mohamed, Abd El-hamed Manar Mohy, Sabry Dina, Abdelgwad Marwa. Efficacy of Photobiomodulation and Metformin on Diabetic Cell Line of Human Periodontal Ligament Stem Cells through Keap1/Nrf2/Ho-1 Pathway. Rep Biochem Mol Biol. 2021;10(1):30–40. doi: 10.52547/rbmb.10.1.30. [DOI] [PMC free article] [PubMed] [Google Scholar]
- 13.Karamzadeh R, Eslaminejad MB, Aflatoonian R. Isolation, characterization and comparative differentiation of human dental pulp stem cells derived from permanent teeth by using two different methods. . J Vis Exp. 2012;69:4372. doi: 10.3791/4372. [DOI] [PMC free article] [PubMed] [Google Scholar]
- 14.Kofler B, Romani A, Pritz Ch, Steinbichler TB, Hans Schartinger V, Riechelmann H, et al. Photodynamic Effect of Methylene Blue and Low-Level Laser Radiation in Head and Neck Squamous Cell Carcinoma Cell. Int J Mol Sci. 2019;19(4):1107. doi: 10.3390/ijms19041107. [DOI] [PMC free article] [PubMed] [Google Scholar]
- 15.Schartinger V H, Galvan O, Riechelmann H, Dudas J. Differential responses of fibroblasts, non-neoplastic epithelial cells, and oral carcinoma cells to low-level laser therapy. Support Care Cancer. 2012;20(3):523–9. doi: 10.1007/s00520-011-1113-0. [DOI] [PubMed] [Google Scholar]
- 16.Ferreira LS, Diniz IMA, Maranduba CMS, Miyagi SPH, Rodrigues MFSD, Moura-Netto C, Marques MM. Short-term evaluation of photobiomodulation therapy on the proliferation and undifferentiated status of dental pulp stem cells. Lasers Med Sci. 2019;34(4):659–666. doi: 10.1007/s10103-018-2637-z. [DOI] [PubMed] [Google Scholar]
- 17.Zhang N, Wu ZM, McGowan E, Shi J, Hong ZB, Ding CW, et al. Arsenic trioxide and cisplatin synergism increase cytotoxicity in human ovarian cancer cells: therapeutic potential for ovarian cancer. Cancer Sci. 2009;100(12):2459–64. doi: 10.1111/j.1349-7006.2009.01340.x. [DOI] [PMC free article] [PubMed] [Google Scholar]
- 18.Fitzmaurice C, Allen C, Barber RM, Barregard L, Bhutta ZA, Brenner H, et al. Global, regional, and national cancer incidence, mortality, years of life lost, years lived with disability, and disability-adjusted life-years for 32 cancer groups, 1990 to 2015: a systematic analysis for the Global Burden of Disease Study. JAMA Oncol. 2017;3(4):524–548. doi: 10.1001/jamaoncol.2016.5688. [DOI] [PMC free article] [PubMed] [Google Scholar]
- 19.Rosarin FS, Arulmozhi V, Nagarajan S, Mirunalini S. Antiproliferative effect of silver nanoparticles synthesized using amla on Hep2 cell line. Asian Pac J Trop Med. 2013;6(1):1–10. doi: 10.1016/S1995-7645(12)60193-X. [DOI] [PubMed] [Google Scholar]
- 20.Sur I, Altunbek M, Kahraman M, Culha M. The influence of the sur¬face chemistry of silver nanoparticles on cell death. Nanotechnology. 2012;23(37):375102. doi: 10.1088/0957-4484/23/37/375102. [DOI] [PubMed] [Google Scholar]
- 21.Hwang IS, Lee J, Hwang J, KJ Kim, DG Lee. Silver nanoparticles induce apoptotic cell death in Candida albicans through the increase of hydroxyl radicals. FEBS J. 2012;279(7):1327–38. doi: 10.1111/j.1742-4658.2012.08527.x. [DOI] [PubMed] [Google Scholar]
- 22.Murakami T, Nakatsuji H, Inada M, Matoba Y, Umeyama T, Tsujimoto M, et al. Photodynamic and photo¬thermal effects of semiconducting and metallic-enriched single-walled carbon nanotubes. J Am Chem Soc. 2012;134(43):17862–5. doi: 10.1021/ja3079972. [DOI] [PubMed] [Google Scholar]
- 23.Kwiatkowski S, Knap B, Przystupski D, Saczko J, Kędzierska E, Knap-Czop K, et al. Photodynamic therapy mechanisms photosensitizers and combinations. Biomed Pharmacother. 2018;106:1098–1107. doi: 10.1016/j.biopha.2018.07.049. [DOI] [PubMed] [Google Scholar]
- 24.Dos Santos AF, De Almeida DRQ, Terra LF, Baptista MS, Labriola L. Photodynamic therapy in cancer treatment—an update review. J Cancer Metastasis Treatment. 2019;5(25) [Google Scholar]
- 25.Wagner M, Suarez ER, Theodoro TR, Machado F, Gama MF, Tardivo JP, et al. Methylene blue photodynamic therapy in malignant melanoma decreases expression of proliferating cell nuclear antigen and heparanases. Clin Exp Dermatol. 2012;37(5):527–33. doi: 10.1111/j.1365-2230.2011.04291.x. [DOI] [PubMed] [Google Scholar]
- 26.Lim EJ, Oak CH, Heo J, Kim YH. Methylene blue-mediated photodynamic therapy enhances apoptosis in lung cancer cells. Oncol. Rep. 2012;30(2):856–62. doi: 10.3892/or.2013.2494. [DOI] [PubMed] [Google Scholar]
- 27.Dougherty TJ, Gomer CJ, Henderson BW, Jori G, Kessel D, Korbelik M, et al. Photodynamic therapy. J Natl Cancer Inst. 1998;90(12):889–905. doi: 10.1093/jnci/90.12.889. [DOI] [PMC free article] [PubMed] [Google Scholar]
- 28.Chairuangkitti P, Lawanprasert S, Roytrakul S, Aueviriyavit S, Phummiratch D, Kulthong K, et al. Silver nanoparticles induce toxicity in A549 cells via ROS-dependent and ROS-independent pathways. Toxicol In Vitro. 2013;27(1):330–8. doi: 10.1016/j.tiv.2012.08.021. [DOI] [PubMed] [Google Scholar]
- 29.Galluzzi L, Senovilla L, Vitale I, Michels J, Martins I, Kepp O, et al. Molecular mechanisms of cisplatin resistance. Oncogene. 2012;31(15):1869–83. doi: 10.1038/onc.2011.384. [DOI] [PubMed] [Google Scholar]
- 30.Zhu J, Carozzi VA, Reed N, Mi R, Marmiroli P, Cavaletti G, et al. Ethoxyquin provides neuroprotection against cisplatin-induced neurotoxicity. Sci Rep. 2016;6:28861. doi: 10.1038/srep28861. [DOI] [PMC free article] [PubMed] [Google Scholar]
- 31.Miao XP, Sun XN, Li QS, Cui LJ, Wang XY, Zhuang GF, et al. Pectic polysaccharides extracted from Rauvolfia verticillata (Lour.) Baill. var. hainanensis Tsiang ameliorate ulcerative colitis via regulating the MAPK s and NF-κB pathways in dendritic cells. Clin Exp Pharmacol Physiol. 2019;46(1):48–55. doi: 10.1111/1440-1681.13026. [DOI] [PubMed] [Google Scholar]
- 32.Tang MK, Zhou HY, Yam JW, Wong AS. c-Met overexpression contributes to the acquired apoptotic resistance of non-adherent ovarian cancer cells through a cross talk mediated by phosphatidylinositol 3-kinase and extracellular signal-regulated kinase 1/2. Neoplasia. 2010;12(2):128–38. doi: 10.1593/neo.91438. [DOI] [PMC free article] [PubMed] [Google Scholar]
- 33.Maccalli C, Parmiani G, Ferrone S. Immunomodulating and Immuno resistance Properties of Cancer-Initiating Cells: Implications for the Clinical Success of Immunotherapy. Immunol Invest. 2017;46(3):221–238. doi: 10.1080/08820139.2017.1280051. [DOI] [PubMed] [Google Scholar]
- 34.Linkov F, Lisovich A, Yurkovetsky Z, Marrangoni A, Velikokhatnaya L, Nolenet B. Early detection of head and neck cancer. development of a novel screening tool using multiplexed immunobead-based biomarker profiling. Cancer Epidemiol Biomarkers Prev. 2007;16(1):102–7. doi: 10.1158/1055-9965.EPI-06-0602. [DOI] [PubMed] [Google Scholar]
- 35.Hoffmann TK, Sonkoly E, Homey B, Scheckenbach K, Gwosdz Ch, Bas M, et al. Aberrant cytokine expression in serum of patients with adenoid cystic carcinoma and squamous cell carcinoma of the head and neck. Head Neck. 2007;29(5):472–8. doi: 10.1002/hed.20533. [DOI] [PubMed] [Google Scholar]
- 36.Gokhale AS, Haddad RI, Cavacini LA, Wirth L, Weeks L, Hallar M, et al. Serum concentrations of interleukin-8, vascular endothelial growth factor, and epidermal growth factor receptor in patients with squamous cell cancer of the head and neck. Oral Oncol. 2005;41(1):70–6. doi: 10.1016/j.oraloncology.2004.06.005. [DOI] [PubMed] [Google Scholar]
- 37.Moon EJ, Sonveaux P, Porporato PE, Danhier P, Gallez B, Batinic-Haberle I, et al. NADPH oxidase-mediated reactive oxygen species production activates hypoxia-inducible factor-1 (HIF-1) via the ERK pathway after hyperthermia treatment. Proc Natl Acad Sci U S A. 2010;107(47):20477–82. doi: 10.1073/pnas.1006646107. [DOI] [PMC free article] [PubMed] [Google Scholar]
- 38.Michiels C, Tellier C, Feron O. Cycling hypoxia: A key feature of the tumor microenvironment. Biochim Biophys Acta. 2016;1866(1):76–86. doi: 10.1016/j.bbcan.2016.06.004. [DOI] [PubMed] [Google Scholar]
- 39.Tieshan Y, Yao Q, Cao F, Liu Q, Liu B, Wang X. Silver nanoparticles inhibit the function of hypoxia-inducible factor-1 and target genes: insight into the cytotoxicity and antiangiogenesis. Int J Nanomedicine. 2016;11:6679–6692. doi: 10.2147/IJN.S109695. [DOI] [PMC free article] [PubMed] [Google Scholar]
- 40.Chouaib S, Noman MZ, Kosmatopoulos K, Curran MA. Hypoxic stress: Obstacles and opportunities for innovative immunotherapy of cancer. Oncogene. 2016;36(4):439–445. doi: 10.1038/onc.2016.225. [DOI] [PMC free article] [PubMed] [Google Scholar]
- 41.Zhenyu Ji, Yang G, Shahzidi S, Tkacz- Stachowska K, Suo Zh, Nesland JM, Peng Q. Induction of hypoxia-inducible factor-1α overexpression by cobalt chloride enhances cellular resistance to photodynamic therapy. Cancer Letters. 2006;244(2):182–9. doi: 10.1016/j.canlet.2005.12.010. [DOI] [PubMed] [Google Scholar]
- 42.Alao JP. The regulation of cyclin D1 degradation: roles in cancer development and the potential for therapeutic invention. Mol Cancer. 2007;6:24. doi: 10.1186/1476-4598-6-24. [DOI] [PMC free article] [PubMed] [Google Scholar]
- 43.Alao JP, Lam EW, Ali S, Buluwela L, Bordogna W, Lockey P, et al. Histone deacetylase inhibitor trichostatin A represses estrogen receptor α-dependent transcription and promotes proteasomal degradation of cyclin D1 in human breast carcinoma cell lines. Clin Cancer Res. 2004;10(23):8094–104. doi: 10.1158/1078-0432.CCR-04-1023. [DOI] [PubMed] [Google Scholar]
- 44.Shahabinejad M, Zare R, Asadi Z, Mohajertehran F. LAMP3 (CD208) Expression in Squamous Cell Carcinoma and Epithelial Dysplasia of the Oral Cavity and Clinicopathological Characteristics of Unfavorable Prognosis. Rep Biochem Mol Biol. 2021;9(4):373–378. doi: 10.52547/rbmb.9.4.373. [DOI] [PMC free article] [PubMed] [Google Scholar]
- 45.El-Sayed Ibrahim N, Morsy H, Abdelgwad M. The Comparative Effect of Nisin and Thioridazine as Potential Anticancer Agents on Hepatocellular Carcinoma. Rep Biochem Mol Biol. 2021;9(4):452–462. doi: 10.52547/rbmb.9.4.452. [DOI] [PMC free article] [PubMed] [Google Scholar]