Abstract
Silk and elastin are exemplary protein materials that exhibit exceptional material properties. Silk is uniquely strong, surpassing engineering materials such as Kevlar and steel, while elastin has exquisite flexibility and can reversibly fold into a more structured form at high temperatures when many other proteins would unfold and denature. This phenomenon in elastin is termed the inverse temperature transition. It is a reversible, controllable process that motivates applications in drug delivery, shape change materials, and biomimetic devices. Silk-elastin-like protein polymers (SELPs), which combine repeating B. mori silk and elastin blocks, have been introduced as biologically-inspired materials that combine the distinctive properties of the component parts to achieve strong and extensible, tunable biomaterials. Here, we considered a single SELP sequence to examine temperature transition effects at the molecular scale. SELP molecular models were created using Replica Exchange Molecular Dynamics, an accelerated sampling method, and confirmed in experiment by comparing secondary structure distributions. A molecular collapse of the SELP molecule was observed with increased temperature in both molecular simulation and experiment. Temperature-specific differences were observed in the mechanical properties and the unfolding pathways of the polypeptide. Using the Bell-Evans model, we analyzed the free energy landscape associated with molecular unfolding at temperatures below and above the transition temperature range (Tt) of the polypeptide. We found that at physiological pulling rates, the energy barrier to unfold SELPs was counterintuitively higher above Tt. Our findings offer a foundational perspective on the molecular scale mechanisms of temperature-induced phase transition in SELPs, and suggest a novel approach to combine simulation and experiment to study materials for multifunctional biomimetic applications.
Keywords: elastin, B. mori silk, protein polymers, silk-elastin like protein polymers (SELPs), inverse temperature transition, steered molecular dynamics (SMD), Bell-Evans model
Graphical Abstract
Introduction
Interest in responsive, tunable, nature-inspired biomaterials has seen a tremendous rise in recent years. In particular, silk-elastin-like protein polymers (SELPs) have gained attention as bio-inspired composites for their biocompatibility, degradability and stimuli-responsive tunability 1–5. In the past two decades, genetically engineered SELPs were shown to be quite versatile. SELPs can be processed in a variety of ways: as nanoparticles, films, nanofibers, thin coatings, hydrogels and scaffolds, providing a diverse set of structures for material applications 3–4, 6–10. These applications include biosensors, tissue engineering, targeted drug delivery release systems, gene therapy and nanocarriers 11–15, among others.
SELPs are composed of alternating silk-like and elastin-like domains, combining the properties of the component parts. Silk-like domains (GAGAGS) mimic the Bombyx mori silkworm silk sequence. They assemble into tightly packed structures and provide stability and mechanical resilience. Elastin-like pentapeptide domains (GXGVP) are representative of the elastin protein sequence and exhibit an inverse temperature transition, modulated by changing the second X residue of the pentapeptide. SELPs combine the mechanical strength, resilience and self-assembling properties inherent to silk together with tunable mechanics derived from the elastin domains, which in physiological conditions exhibit reversible sensitivity to stimuli, including temperature, pH, ionic strength, electric fields, and enzymes 5. By combining silk-like and elastin-like domains, SELPs achieve useful mechanical properties and discrete tunability.
Though a number of studies have considered the self-assembly, morphological diversity and biomedical applications of SELPs, a precise understanding of SELP behavior at the molecular scale is still missing. It is well known that elastin-like peptides (ELPs) undergo a temperature-modulated reversible phase transition, which is governed by environmental factors and the chemistry of the elastin sequence, in particular the X residue 16–29. Below the transition temperature, ELPs are soluble in aqueous solution. Above transition temperature, ELPs undergo a structural transition to a contracted, aggregated state. Several simulation and experimental studies have addressed the molecular scale transitions of elastin-like peptides 21, 30–35. Likewise, silk protein has been scrutinized through a series of molecular models 36–38. In the present study we derive inspiration from silk and elastin models to create the first SELP molecular model. We use the model to identify thermally-stimulated structural transitions and temperature effects on molecular unfolding pathways and mechanical signatures. We combine molecular modeling and experiments based on a recombinantly synthesized SELP sequence to probe the molecular scale temperature transition effects and single-molecule mechanical responses to thermal stimulation of the sequence [(GVGVP)4(GYGVP)(GVGVP)3(GAGAGS)]14.
In this work we use steered molecular dynamics (SMD) to apply an external force on SELP molecules at two different temperatures, below and above the transition temperature range. Using SMD, we can probe the mechanical functions at the single molecule scale and observe the unfolding process. We employ the Bell-Evans model to study the free energy associated with the molecular unfolding pathway at different temperatures in order to differentiate between thermal effects and temperature-induced structural changes that cause mechanical variation in SELPs. A mechanism to understand temperature-dependent mechanics is proposed.
Materials and Methods
Molecular Simulation Setup
The SELP sequence was constructed from elastin and silk blocks, where the elastin block is GXGVP and the silk block is GAGAGS, in single amino acid letter code. X is an interchangeable amino acid responsible for shifting the transition temperature of elastin. Elastin has a highly repetitive sequence and the GXGVP pentapeptide repeat unit is traditionally used as a representative elastin-like polymer. The GAGAGS block is representative of B. mori silk. Eight elastin blocks and one silk block were used to construct the sequence studied here. The polypeptide is a 14-mer alternating silk-elastin chain, having the sequence [(GVGVP)4(GYGVP)(GVGVP)3(GAGAGS)]14. Identical sequences are considered in simulation and experiment.
Extended straight chain conformations of the sequence were built using CHARMM version 35b1 39. The structure was first relaxed to ensure no steric clashes using energy minimization through the steepest descent algorithm. This initial structure was used for input into Replica Exchange Molecular Dynamics (REMD) simulation in implicit solvent.
Replica Exchange Molecular Dynamics in Implicit Solvent
Following sequence construction, Replica Exchange Molecular Dynamics 40 simulations were carried out in the canonical ensemble. Replica Exchange integrates Monte Carlo exchanges into a classical molecular dynamics simulation scheme, thereby improving sampling. Identical systems were simulated through a range of temperatures. High temperatures allow for wide conformational space sampling, avoiding local free energy minima, while frequent exchanges ensure wide sampling across the temperature range.
The exchange probability p between two replicas i and j, with temperatures Ti and Tj, and energies Ei and Ej, respectively, is40:
| (1) |
where
| (2) |
Twenty-four temperature replicas were created and exponentially distributed in the temperature range 280 to 480 K (7 to 207°C). A total of 120,000 exchanges were attempted every 0.5 ps to allow for system relaxation and the protein structure’s full equilibration is ensured before the end of this long REMD simulation. A 2 fs time step was used. The exchange acceptance rate between replicas was sufficient for adequate sampling to take place at around 15%. An ensemble of structures from the last 1000 exchanges at the lowest temperature replica was analyzed. Clusters based on mutual similarity by root mean square deviation (3Å) were created with the K-means clustering algorithm in the MMTSB tool set 41. The lowest-energy representative structure in the most populated cluster was selected. Simulations were carried out with the CHARMM19 all-atom energy function with the EEF1 force field with a Gaussian effective solvent energy function 39, 42. Visualization of protein structures was performed with Visual Molecular Dynamics 43.
Replica Exchange Molecular Dynamics in Explicit Solvent
After the first set of implicit solvent REMD simulations, the representative structure was placed into an explicit water box to continue structural refinement. Simulation in implicit solvent greatly speeds up the computational time required and serves as an acceptable first approximation for structural prediction. We conducted further refinement using a more precise explicit solvent model to correct for local structural approximations. An accurate description of the solvent is required for consideration of structural transition effects. It has been shown abundantly in literature that elastin-like peptides and elastin-containing composite materials undergo structural transitions only in the presence of water. As such, an explicit solvent model is essential for this study.
All subsequent simulations were carried out using GROMACS version 5.01 44. The molecule was placed into a rectangular water box with periodic boundary conditions. The protein and water system contains approximately 200,000 atoms. The CHARMM27 force field is used, which includes CHARMM22 and CMAP for proteins 45. The structure was then minimized through the steepest descent algorithm. Next, solvent was equilibrated around the protein, while the protein was fixed, through two equilibration stages, each 100 ps in length, with a time step of 1 fs. The first phase was equilibration in an NVT ensemble to stabilize temperature, followed by a second stage in an NPT ensemble to stabilize system pressure. After the solvent was equilibrated, the protein restraint was removed and the protein and solvent were equilibrated in an NPT ensemble for an additional 100 ps. After this stage, final structures were inputted into Replica Exchange Molecular Dynamics simulations40. The Berendsen thermostat 46 was used for temperature coupling and the Parrinello-Rahman barostat 47 was used for pressure coupling. The LINCS 48 algorithm was used to constrain covalent bonds with hydrogen atoms. The short range electrostatic interactions and Lennard-Jones interactions were evaluated with a cutoff of 10 Å. Particle-mesh Ewald summation 49 was used to calculate long range electrostatic interactions with a grid spacing of 1.6 Å and a fourth order interpolation.
For each system, 120 temperature replicas were used, exponentially distributed from 280 K to 400 K (7 to 127°C) 50. Each replica was simulated for 20 ns, for a total simulation time of 2.4 μs across all temperatures. A 2 fs time step was used. Exchanges were attempted after 2 ps equilibration runs, and were accepted according to the Metropolis criterion. Exchange acceptance ratios were between 20–30%, signifying sufficient sampling. Representative structures were determined by analyzing the ensemble of structures in the final 2 ns of each replica. K-means clustering was used to group structures into clusters according to root mean square deviation of 12 Å for the low-temperature replica at 280 K (7°C) and for the high-temperature replica at 330 K (57°C). Representative structures with lowest potential energy were chosen from most populated clusters. Analysis of representative structures was carried out using the MMTSB script package 41.
Steered Molecular Dynamics Simulation
Steered molecular dynamics simulations were conducted at four pulling speeds: 20, 30, 40 and 50 m/s for structures at temperatures 7°C and 57°C. For each simulation, a single alpha carbon was fixed at the C terminal, as the structure was pulled by a single alpha carbon of the N terminal, in the direction of the principal axis. A spring constant of 1000 kJ/mol ⋅ nm was used. Force-extension curves were calculated from the forces applied, and distances were computed from the center of mass of the protein structure. All analysis was done using in-house TCL and Matlab scripts. All simulations were completed using the Extreme Science and Engineering Discovery Environment (XSEDE) 51.
Analysis of Molecular Structures
Protein secondary structure was computed using the DSSP algorithm 52–53. Hydrogen bonds were determined using a geometric definition, with the donor–hydrogen–acceptor angle of 30 degrees and a cutoff distance of 0.35 nm between the donor and the acceptor. Secondary structure and solvent accessible surface area analysis was done using Gromacs analysis tools 44 and in-house scripts. Hydrogen bond analysis and visualization of molecular models was performed using VMD 1.9.1 43 and in-house TCL and Matlab scripts.
Synthesis of Polymers
SELP genes and expression plasmids were constructed using our previously established procedures 4. The purity of the proteins was monitored via SDS-PAGE, and the molecular weights of the proteins were determined by MALDI-TOF (Bruker Corporation, Billerica, MA).
UV-Vis Spectrophotometry
The turbidity profiles of 1 mg/ml SELP aqueous solution were obtained by an Aviv 14DS UV–vis spectrophotometer equipped with a Peltier temperature controller (Aviv Biomedical, Lakewood, NJ). Quartz cuvettes with 1 mm path length were used. Temperature scans were performed at 350 nm from 0 to 100°C at a rate of 2°C/min and then cooled to 0°C at the same rate. Absorbance readings were taken after equilibrating the SELP solution at each temperature for 30 seconds. The averaging time of each measurement was 10 seconds per step. The baseline scans were taken with the solvent and cuvette under the same condition and subtracted from the sample scans.
Circular Dichroism
Circular Dichroism (CD) spectra of 0.1 mg/ml SELP aqueous solutions were obtained on an Aviv model 62DS spectrophotometer equipped with a Peltier temperature controller (Aviv Biomedical, Lakewood, NJ). Quartz cuvettes with 1 mm path length were used. Temperature dependent CD scans were performed at 260 to 180 nm with a resolution of 0.5 nm from 4 to 90°C with 10 minute equilibration at each temperature. The reversibility of the CD spectra was measured by scanning over a decreasing temperature range with the same equilibration period. The deconvolution of CD spectra was performed using DICHROWEB 54.
Dynamic Light Scattering
Dynamic Light Scattering (DLS) was carried out on a DynaPro Titan instrument (Wyatt Technology, Santa Barbara, CA) equipped with a temperature controller. Quartz cuvettes with 1 mm path length were used. All samples were filtered through 0.2 μm Millex® syringe filters (EMD Millipore, Darmstadt, Germany) before measurement. SELP solutions (0.2 mg/mL) were stabilized at each temperature for 10 minutes prior to measurement. To obtain the hydrodynamic radii, the intensity autocorrelation functions were analyzed using the Dynamics software (Wyatt Technology, Santa Barbara, CA).
Preparation of SELP Hydrogels
SELP hydrogels were fabricated using our established procedure 2, 5. Briefly, the lyophilized SELP powder was dissolved in deionized water at 4°C for 4 hours to form a 10% SELP stock solution. Then, 6 μL of 40 mg/ml horseradish peroxidase (HRP) stock solution was first added to 100 μL 10% SELP stock solution, and then mixed with 0.2 μL of 30 wt% H2O2 solution to initiate the crosslinking reaction. The mixture was incubated at 4°C overnight to form SELP hydrogels.
Results and Discussion
Temperature-induced structural contraction in silk-elastin-like protein polymers across length scales
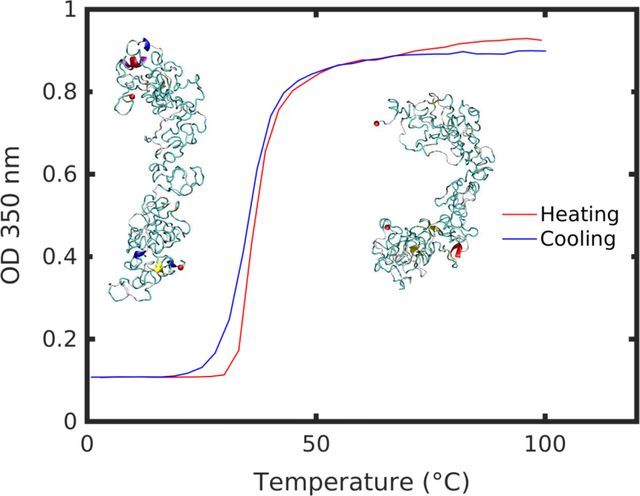
Silk-elastin-like protein polymers, based on the amino acid sequence [(GVGVP)4(GYGVP)(GVGVP)3(GAGAGS)]14 (Figure 1a), were synthesized using recombinant DNA technology. The turbidity profiles for 1 mg/ml of the SELP aqueous solution structures displayed a temperature transition range between 28–45°C, henceforth referred to as Tt (Figure 1b). To distinguish structures below and above transition range, we considered two systems: at 7°C and 57°C, well below and above Tt. Below the transition, at 7°C, the SELP solution appears transparent. As the temperature was raised above the transition for the polymer, to 57°C, the SELP solution becomes cloudy, indicative of the phase transition taking place (Figure 1c).
Figure 1 |.
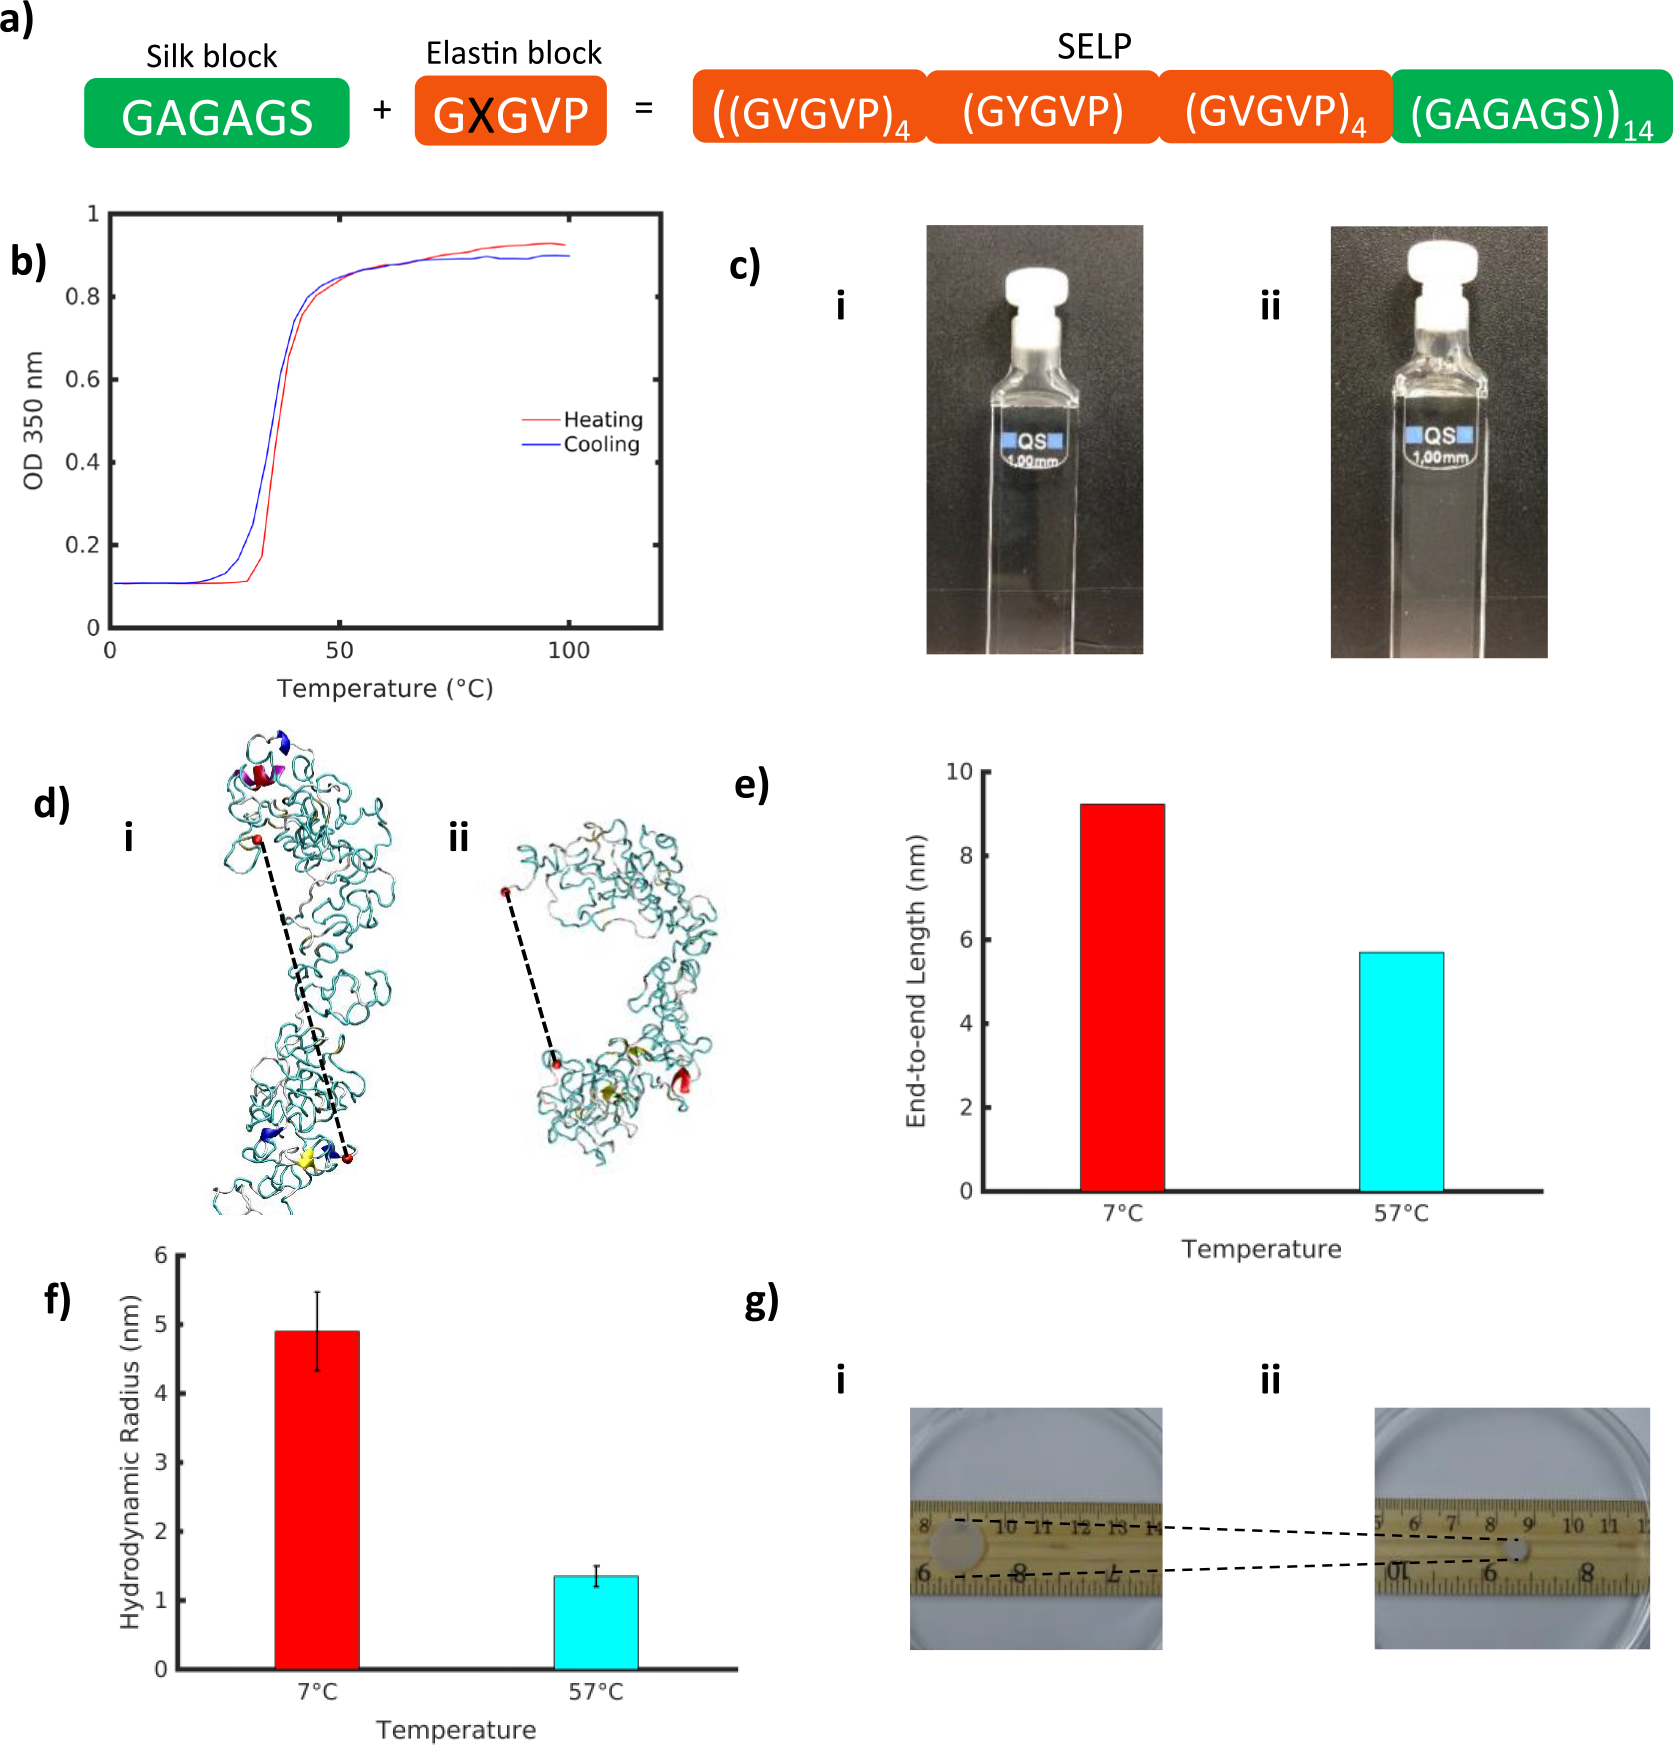
a) SELP sequences are composed of alternating silk-like (GAGAGS) and elastin-like (GXGVP) blocks, where X represents the interchangeable residue responsible for modulating the transition temperature. In this study we consider the sequence [(GVGVP)4(GYGVP)(GVGVP)3(GAGAGS)]14. b) UV Spectrophotometry heating and cooling curves show a reversible transition range between 28–45°C. c) SELP samples at i) low (7°C) and ii) high (57°C) temperature. d) Representative SELP structures from simulation, at i) 7°C and ii) 57°C. Dotted lines represent end-to-end molecular distance. e) End-to-end distance of representative SELP structures pictures in d) at 7°C and 57°C. f) Hydrodynamic radius from dynamic light scattering of SELP at 7°C and 57°C. g) SELP hydrogel samples at i) 7°C and ii) 57°C.
To capture this behavior at the nanoscale, SELP molecular structures were predicted using a series of Replica Exchange Molecular Dynamics simulations (Figure 1d, SI Figure 1). At the single-molecule scale, the transition occurs as a gradual structural change, manifested by a decreasing radius of gyration with temperature (SI Figure 2). Both the molecular models and the synthesized polypeptides exhibit up to 90% of unordered secondary structure with minimal beta sheet and helical content (SI Figure 3), consistent with the high content of elastin-like sequence within the polymer. A comparison between representative structures at 7°C and 57°C showed a structural collapse at high temperature as the structure bent across the principal axis and assumed a more compact conformation (Figure 1d). Measurement of the end-to-end distance confirmed a reduced molecular size (Figure 1e).
A similar trend to a compacted structure with increasing temperature was observed in the synthesized polymer by measuring the hydrodynamic radius (Rh) of the SELP free chain. Rh at temperatures below and above Tt was determined by dynamic light scattering (DLS). DLS measurement at 7°C and 57°C displayed a reduction in the Rh of the free chain from 3.8 ± 0.6 nm to 1.4 ± 0.2 nm (Figure 1f). Such drastic reduction in molecular size suggested that the free chains of the SELP folded at high temperature above Tt, leading to a decrease of the overall size of the SELP free chains.
In this system, elastin-like and silk-like blocks are interspersed in the molecule, with elastin dominating the molecule for a silk to elastin ratio of 1:8. Though volume was conserved at the single molecule scale, and solvent accessible surface area was reduced by a mere 3% at high temperature, there was a 15% increase in the number of hydrogen bonds present in the molecule, and a 30% reduction in the end-to-end distance due to the distinct bend in the molecule at high temperature. We found that a synergistic structural folding was prompted by the formation of intra-molecular hydrogen bonds.
At the macroscale, a corresponding behavior was observed in silk-elastin hydrogels that were fabricated and tested at different temperatures. A shrinkage of 57% in the hydrogel radius was measured between 7°C and 57°C (Figure 1g). We found that the structural collapse observed at the single molecule scale was propagated up to the macroscale. We propose that the packing geometry of SELP molecules in the hydrogel ultimately propels the shrinking phenomenon, causing structural reorganization at the molecular scale.
Temperature-dependent molecular unfolding
We considered the unfolding pathway for representative SELP structures below and above Tt, at 7°C and 57°C respectively, using steered molecular dynamics simulations. Molecules were fixed at the C terminal, and loaded in tension at the N terminal (Figure 2ab). Force-extension curves for a pulling speed of 50 m/s at the two temperatures are shown in Figure 2c. The evolution of SMD unfolding was examined at slower pulling speeds (20 m/s, 30 m/s and 40 m/s) to ensure that the unfolding behavior remained unchanged and was independent of the pulling speed, to avoid artificial results (SI Figure 4). We note that the curves had the same general shape, indicative of a consistent transition pathway at different pulling speeds. Yet, deformation behavior was drastically different at low and high temperatures (Figure 2c). We examined various deformation regimes to shed light on the mechanisms driving the divergence in mechanical signature at different temperatures (boxes i-iv in Figure 2).
Figure 2 |.
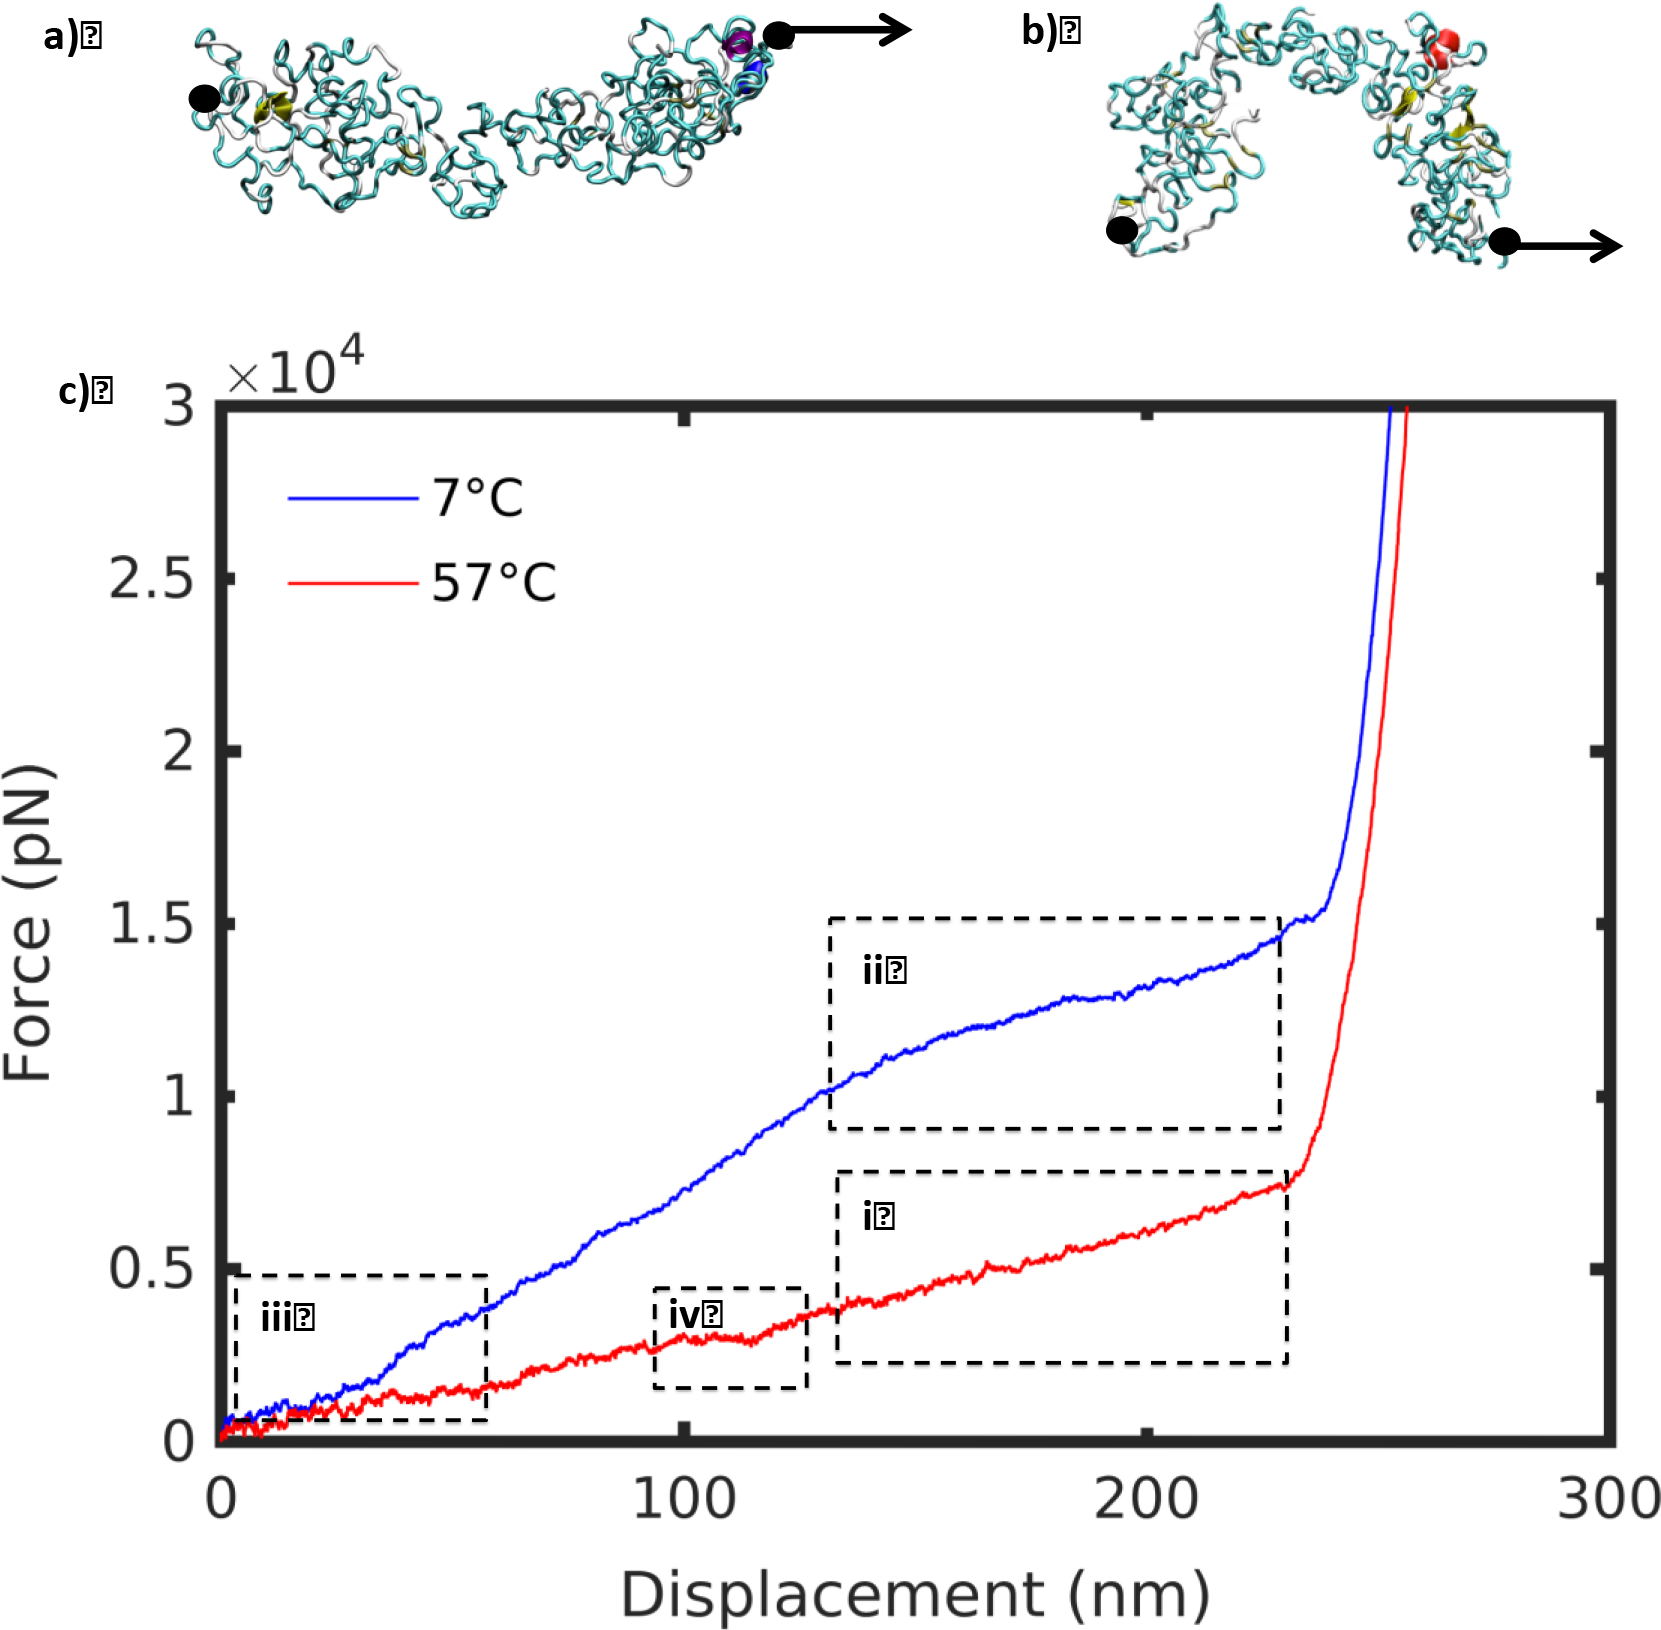
Steered molecular dynamics set-up for SELP at a) 7°C and b) 57°C. Molecule is fixed at the C terminal end, and pulled at the N terminal end. c) Force-displacement curves at 7°C and 57°C for pulling speed 50 m/s. Regions i-iv are discussed subsequently.
At 7°C, the mechanical response included a steep linear regime followed by a plateau, compared with a gentle linear slope at 57°C (Figure 2c). The unraveling of the high temperature structure revealed a smooth unfolding mechanism (Figure 3). The molecule unraveled from a single cluster, uniformly like a ball of yarn, corresponding to a linear deformation regime. By contrast, as the low temperature structure unfolded, a plateau in the force-displacement appeared at a displacement of about 150 nm (Figure 4). A series of smaller clusters detached from the main densely-folded region as the molecule was pulled. These clusters act to dissipate the force, resisting the pulling, and produced the plateau that differentiates the low and high temperature deformation curves.
Figure 3 |.
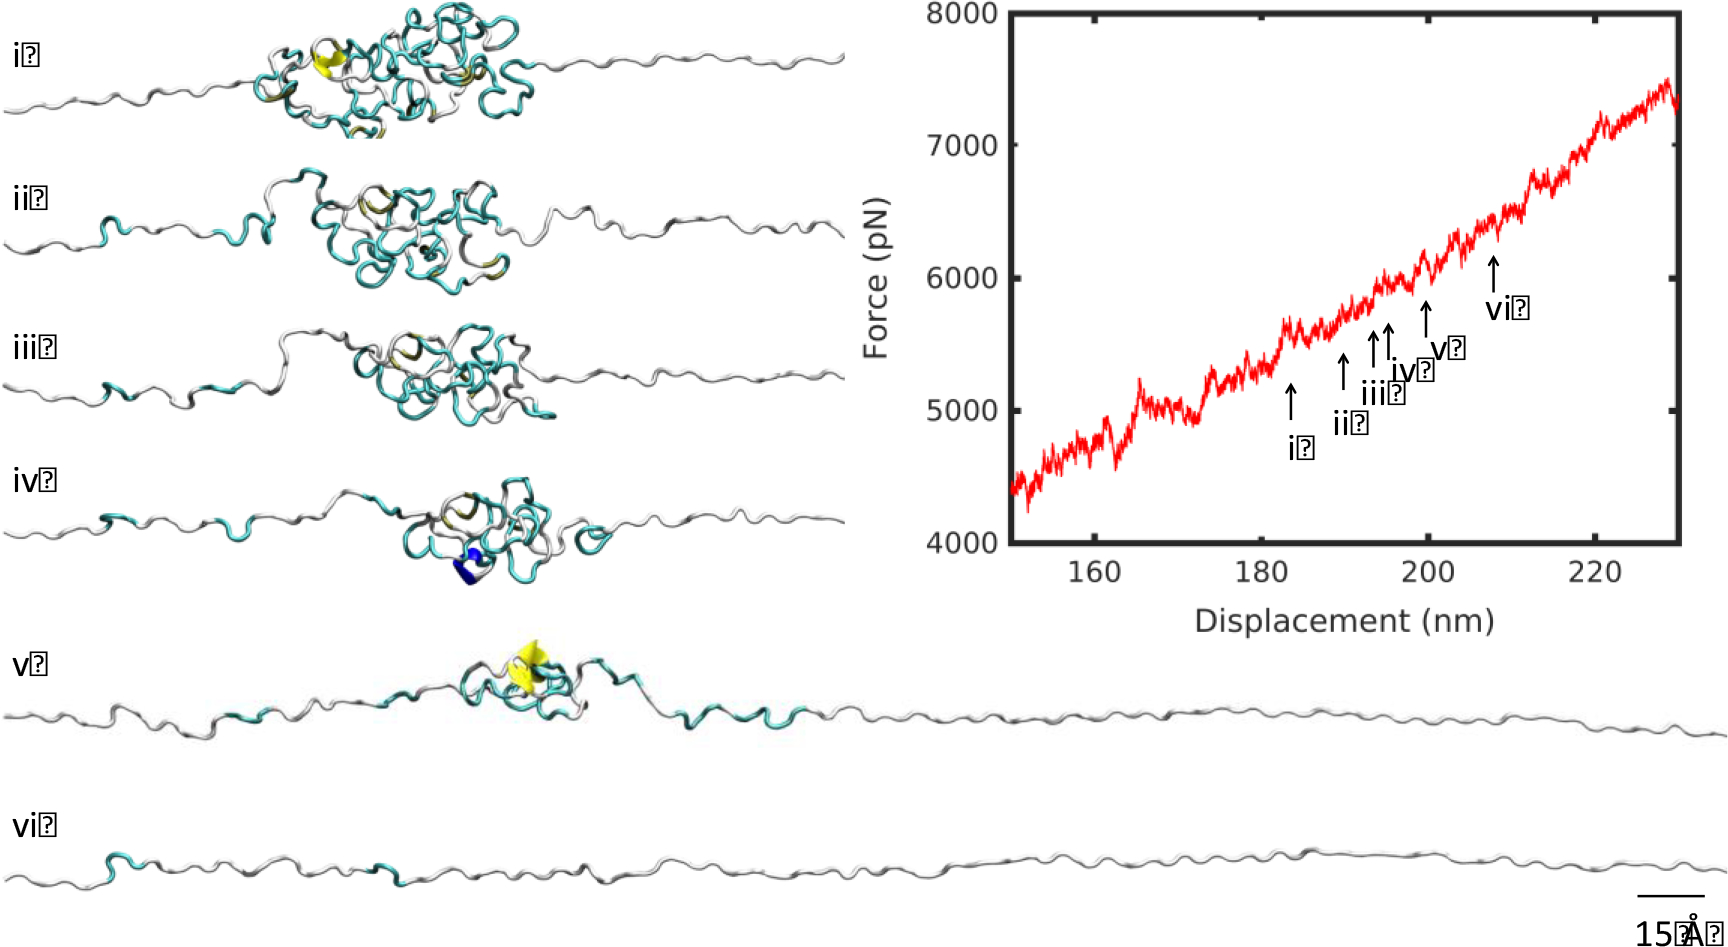
Unfolding snapshots for region (i) from Figure 2, at 57°C. Structures correspond to displacements indicated by numbered arrows on the force-displacement plot. Scale bar: 15 Å.
Figure 4 |.
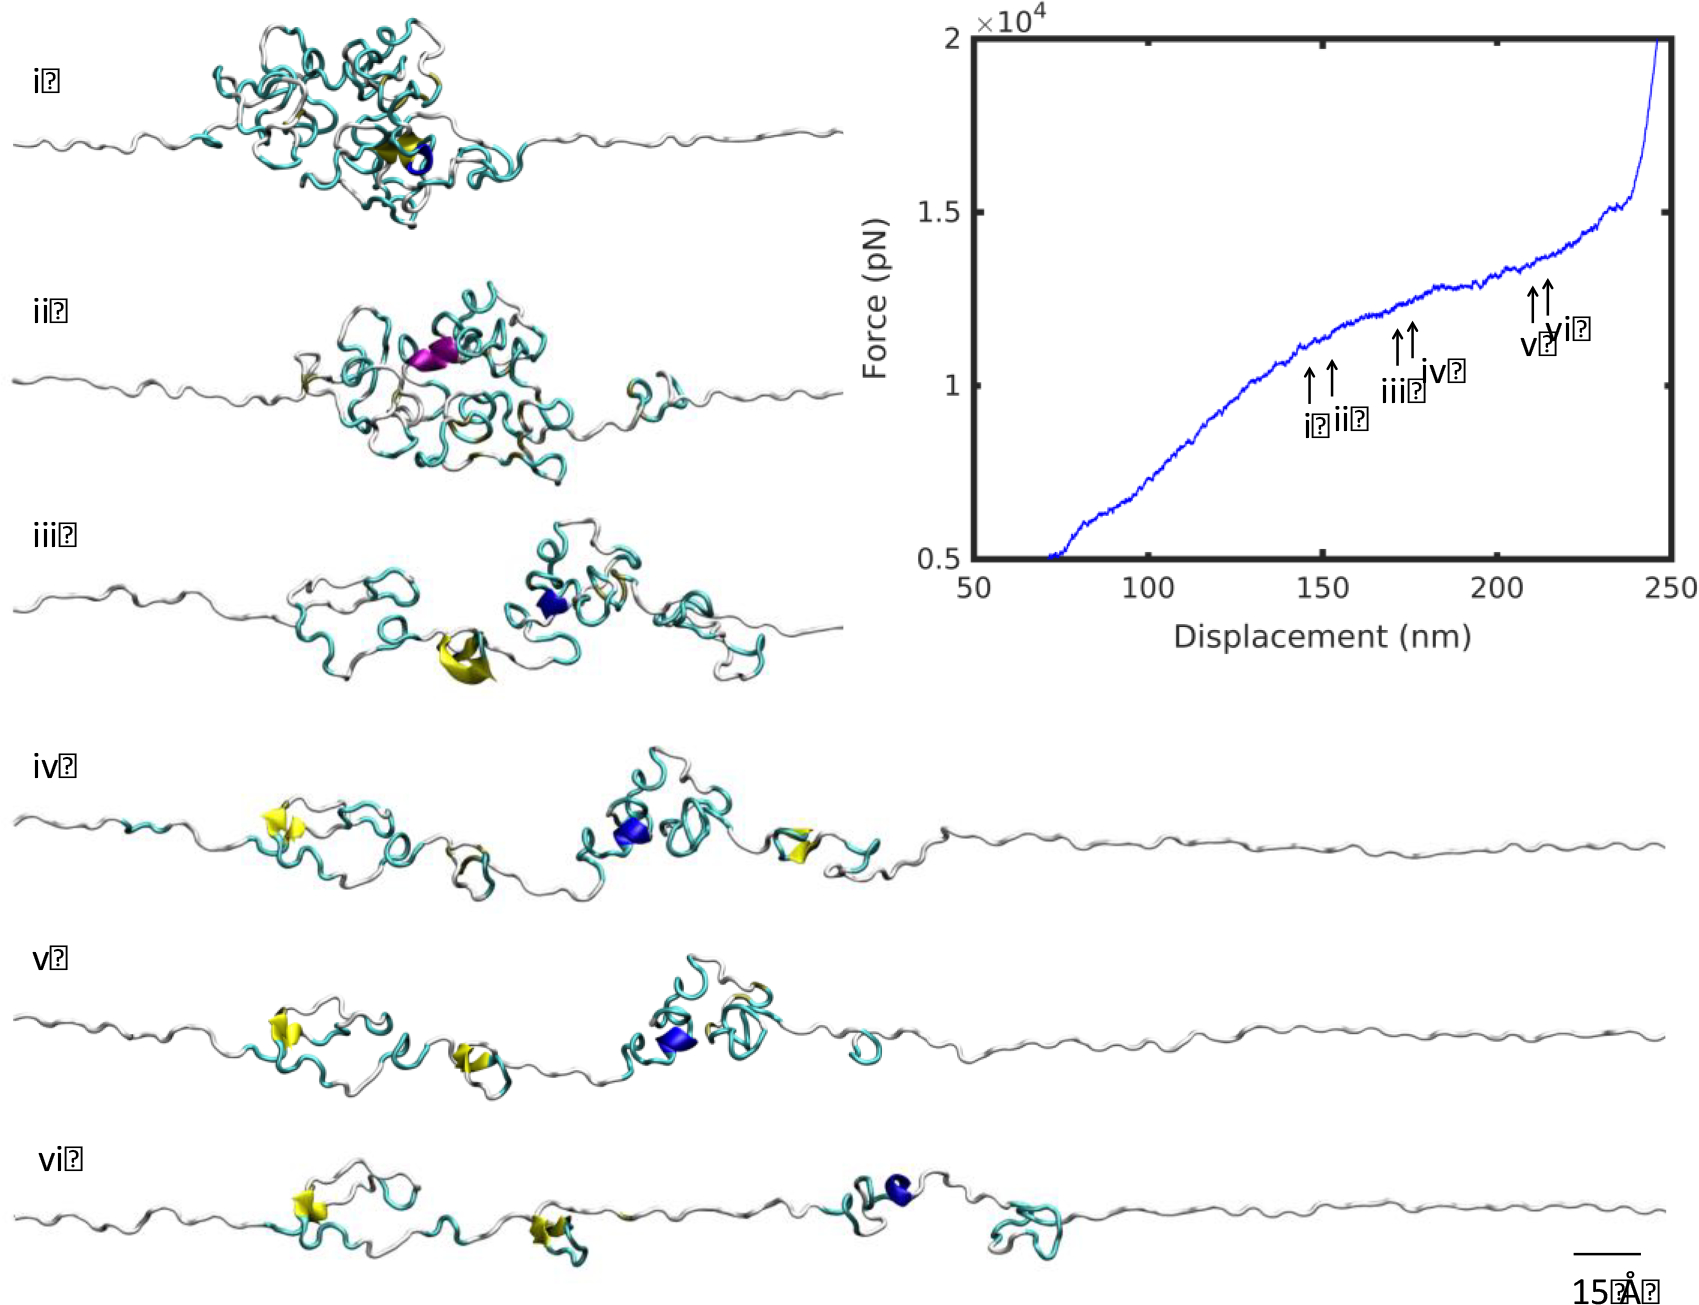
Unfolding snapshots for region (ii) from Figure 2, at 7°C. Structures correspond to displacements indicated by numbered arrows on the force-displacement plot, in increasing displacement order. Scale bar: 15 Å.
To understand the internal molecular landscape through the unfolding process we considered the intra-molecular hydrogen bond evolution at high and low temperature (7°C and 57°C, respectively). Notably, the number of hydrogen bonds that exists within the SELP molecule was higher by 15% at high temperature and this difference persisted through two thirds of the unfolding stages (Figure 5). This observation is counterintuitive, as higher temperature is expected to more easily disrupt weak intra-molecular hydrogen bonds. We attribute this surprising behavior to the presence of elastin-like segments, which are known to assume a folded, hydrogen-bond-rich conformation above Tt. The enhanced hydrogen bonding at high temperature may help to maintain a large, uniform region in the unfolding pathway. Fewer hydrogen bonds at low temperature create a less compact structure that permits the separation of small, independent clusters as the molecule experiences a pulling force.
Figure 5 |.
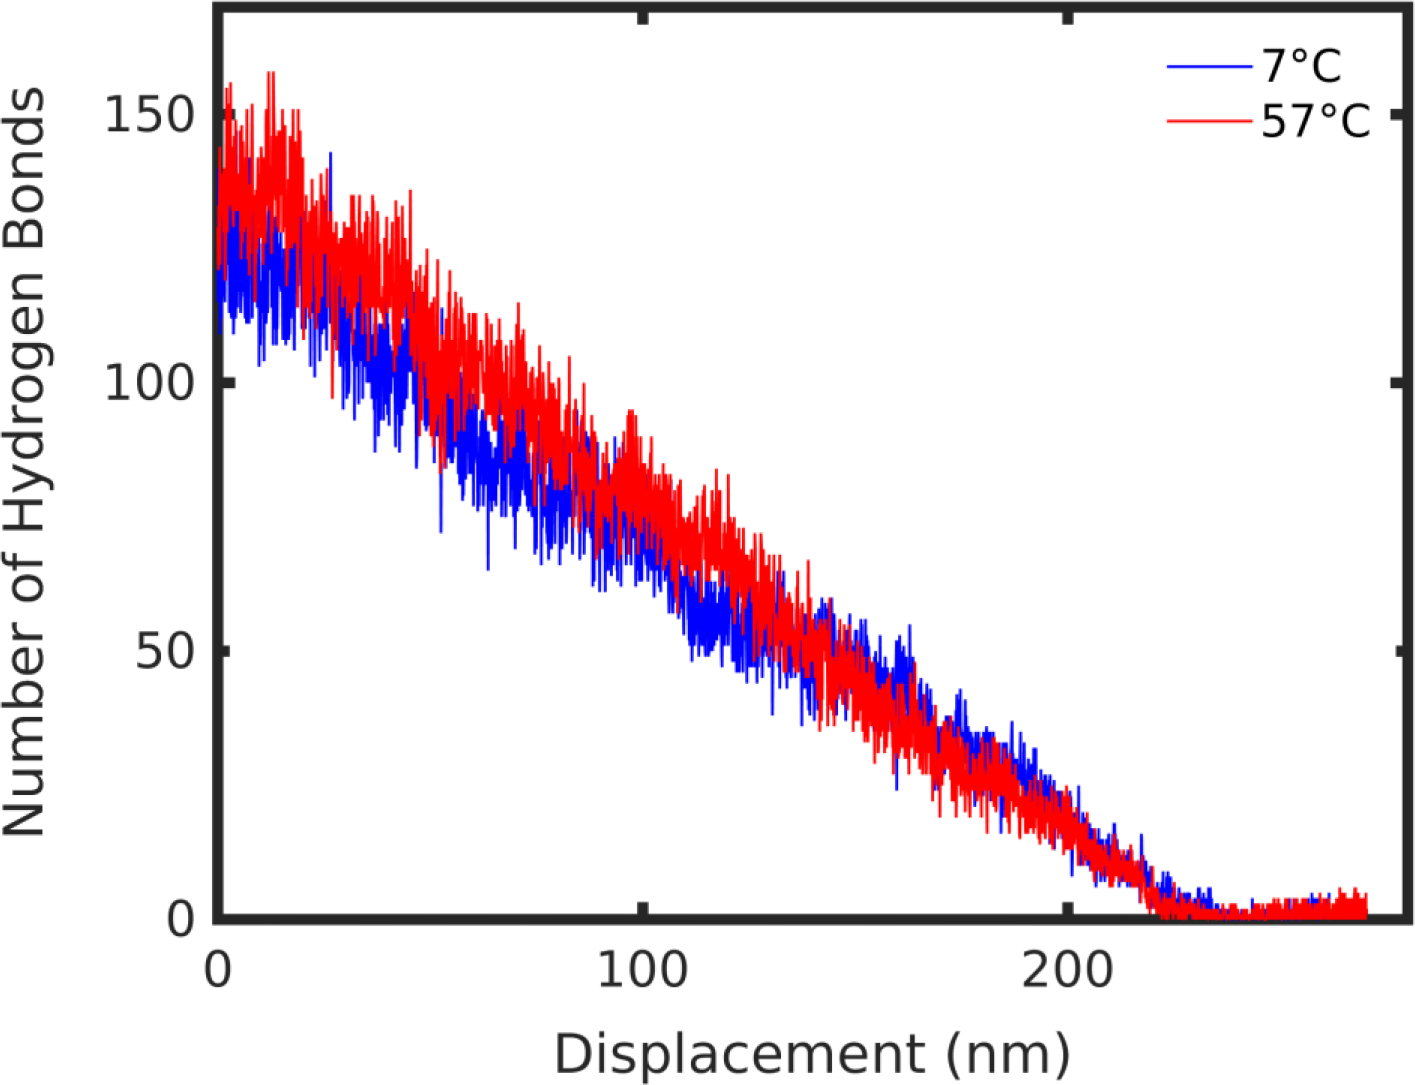
Hydrogen bond evolution at 7°C and 57°C during SMD pulling.
Further evidence of this mechanism lies in the observation that at the displacement of approximately 130 nm, as the number of hydrogen bonds converges to the same value in both the high and low temperature structures (Figure 5), the force-displacement curves become parallel (Figure 2c). This suggests that the hydrogen bond distribution within the molecule directly determined the unfolding pathway of the molecule. A corresponding trend was observed in the secondary structure evolution as the molecule unfolded, naturally related to the hydrogen bonding patterns in the molecule across different temperatures (SI Figure 5). Ordered secondary structure content, namely beta and helical structure, characterized by dense hydrogen bonding, was slightly greater through the unfolding pathway for the high temperature molecule (SI Figure 5a). Consistently, unordered secondary structure, defined as turns and bends, having a single or no hydrogen bonds, respectively, was lower throughout the deformation for the high temperature structure (SI Figure 5b). Based on these observations, we propose that the unique behavior of elastin-like segments can control the molecular deformation regime that may be tuned to extreme precision. Despite this observation, there is a need to decouple the effect of elastin structural transition from a temperature effect, which is addressed later.
Before addressing the question of decoupling elastin structure and temperature-specific effects, we considered additional regions in the deformation pathway. There exists a divergence in the deformation regime at high and low temperature between 25 and 35 nm extension (Figure 6,7). Up to that point, the molecule unraveled smoothly at 7°C, evocative of the deformation observed in the linear regime at large deformation at 57°C previously discussed, albeit less smooth. The minor kinks observed in the initial deformation correspond to small, irregular changes in the bulk of the molecule as it began to unfold. Beyond this, minor plateaus, such as that at 23 nm for the molecule at 7°C, represent small clusters breaking off the molecule’s main fold (Figure 6). By contrast, the high temperature molecule began to unravel by unlocking its natural bend and extending through the principal axis of the molecule (Figure 7). Variable kinks were found in this initial regime. At 23 nm, as the molecule began to divide at its center into two clusters, there was a softening in the force-displacement curve compared with the low temperature deformation. At 38 nm, the split between the two halves of the molecule was apparent and the divergence between low and high temperature deformation curves increased further, establishing two distinct deformation pathways for the molecule below and above Tt.
Figure 6 |.
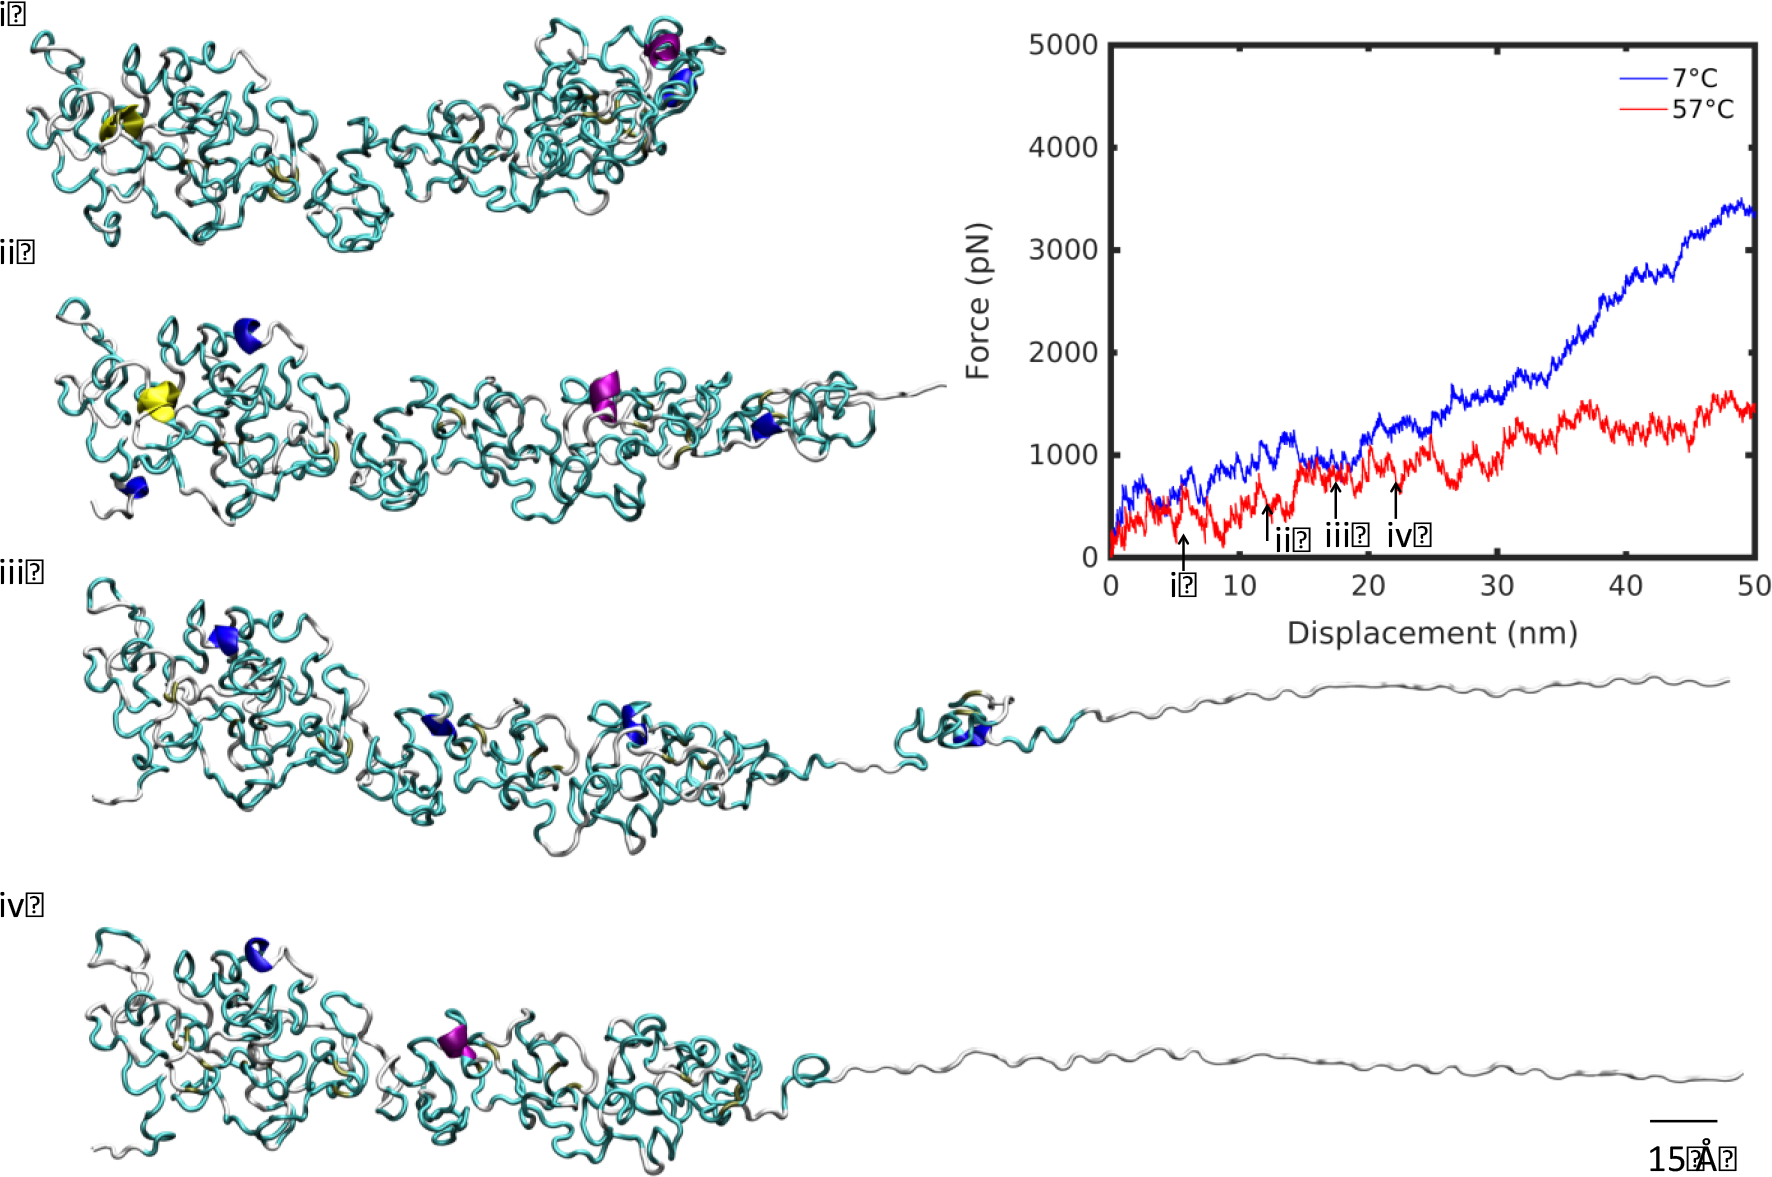
Unfolding snapshots for region (iii) from Figure 2, at 7°C. Structures correspond to displacements indicated by numbered arrows on the force-displacement plot, in increasing displacement order. Scale bar: 15 Å.
Figure 7 |.
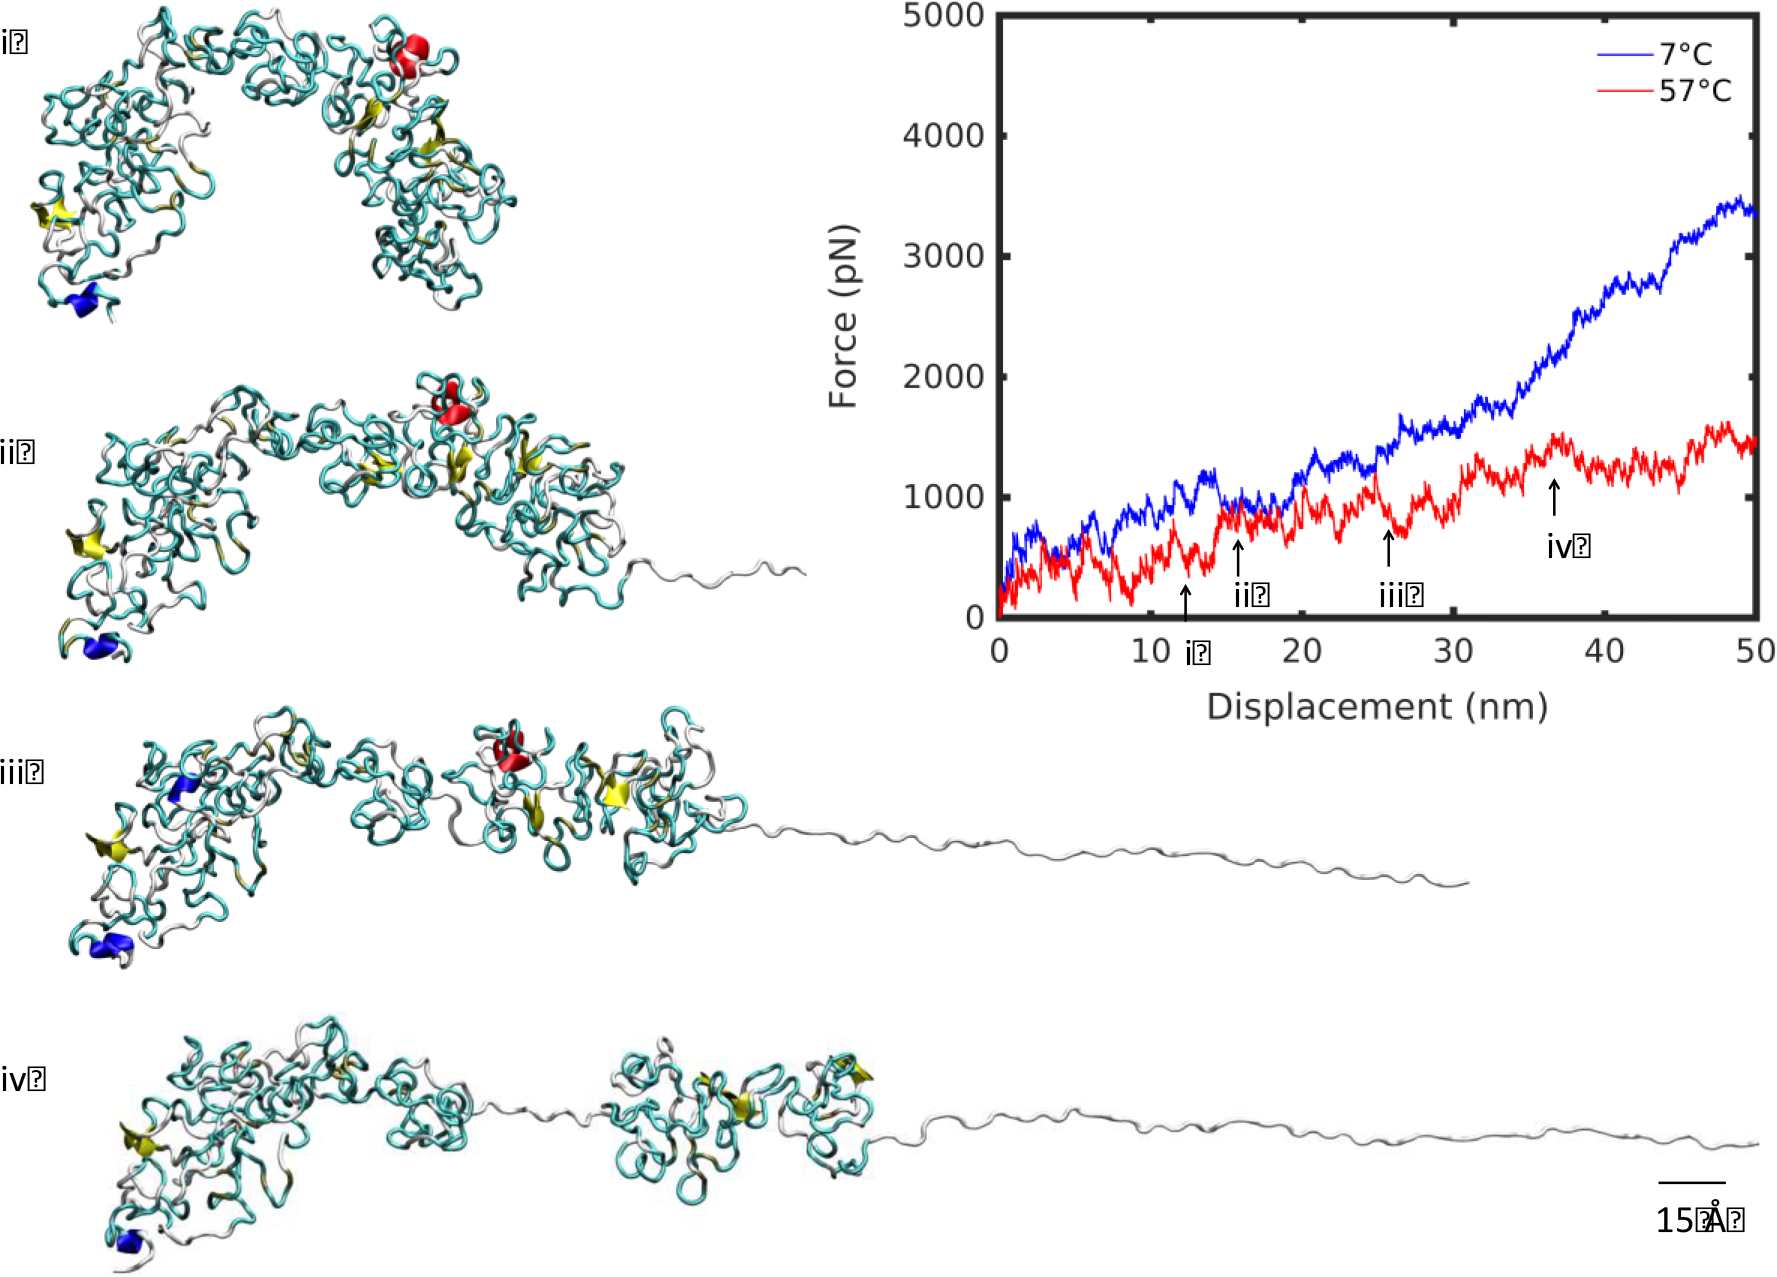
Unfolding snapshots for region (iii) from Figure 2, at 57°C. Structures correspond to displacements indicated by numbered arrows on the force-displacement plot, in increasing displacement order. Scale bar: 15 Å.
Remarkably, the clustering phenomenon during unfolding occurred at both low and high temperature producing the identical effect of dissipating the tensile force. At 57°C, at low displacement, the large breakaway cluster that spans almost half of the molecule’s length softened the deformation (Figure 7). At 7°C, clustering occurred at higher extension, because of a reduced network of hydrogen bonds keeping the structure intact (Figure 4). At 57°C, a denser network of hydrogen bonds resisted breakaway clusters upon extension, creating linear deformation (Figure 3). Once both molecules have unraveled fully, at approximately 230 nm, the stretch of the backbone resulted in significant stiffening of the force-displacement curve. Similarly, after the large breakaway cluster at high temperature has unraveled fully, there was a modest stiffening of the high temperature curve at 113 nm, indicative of backbone stretching (Figure 8).
Figure 8 |.

Unfolding snapshots for region (iv) from Figure 2, at 57°C. Structures correspond to displacements indicated by numbered arrows on the force-displacement plot, in increasing displacement order. Scale bar: 15 Å.
Theoretical Model for Protein Unfolding Mechanics at Different Temperatures
We used the Bell-Evans model 55 to compare the free energy landscape associated with SELP unfolding at high and low temperature. This approach decouples the effect of temperature and the structure-specific contributions to the unfolding pathway. In the original Bell-Evans model 55, which was developed to investigate the unfolding force (or total work) of a protein as a function of many physiological variables that relate to protein folding and unfolding 56–59, the off-rate is defined as
| (3) |
The off-rate describes how often a bond is broken per unit time. It is a function of the thermal fluctuation and external work. Here, kT is the Boltzmann constant, T is ensemble temperature, E is the energy barrier to overcome bond breaking, w is the external work and ω0 is the natural vibrational frequency. We incorporated the relation to the pulling speed by considering the distance, xB, that needs to be overcome for a bond to break. The pulling speed v = χ ⋅ xB, is given as
| (4) |
Here, B is the product of the natural frequency ω0 and distance xB. We extended the application of the Bell-Evans model to investigate the unfolding of the entire folded protein structure under external force. Through this model we could solve for the energy barrier that reveals the protein’s thermal stability. Our results agreed with experiments obtained from the thermal denaturation process 57. We express the energy associated with structural unfolding as a function of the pulling speed v and temperature T:
| (5) |
We can calculate the external work applied on the structure based on simulation results as
| (6) |
by considering that the pulling force f is always in the direction of extension, where L0 is the initial end-to-end length and L is the contour length once the polymer is fully unfolded, before the strain-stiffening region when the protein backbone begins to stretch.
We considered the unfolding behavior at four pulling speeds: 20, 30, 40 and 50 m/s and two temperatures: 7°C and 57°C. We determined the relationship between energy for different pulling speeds at the same temperature by solving a series of equations (Eq. 7). Energy E(v, T) and work w(v, T) are functions of pulling speed v and temperature T in the following set of equations:
| (7) |
Simplifying,
| (8) |
From Eq. (8), incorporating the numerical values of W(v, T) obtained from simulations, we get:
| (9) |
Plotting the above energy values and fitting a linear function (Figure 9), we found the associated energy barrier at 7°C:
| (10) |
Figure 9 |.
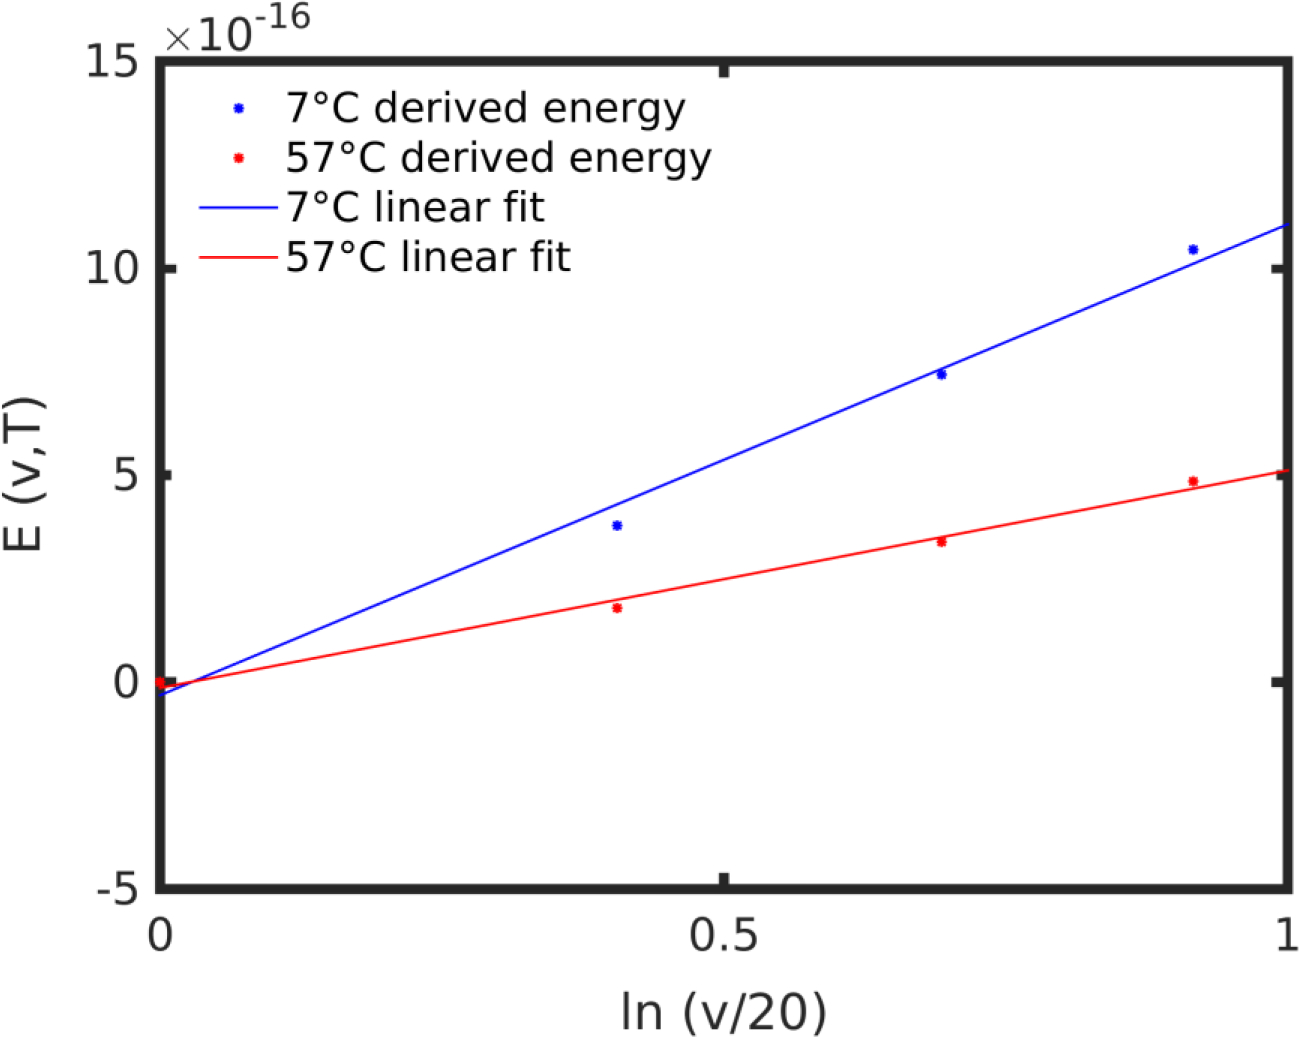
Energy at 7°C and 57°C for pulling speeds 20, 30, 40 and 50 m/s, with linear fits.
Similarly, we can find the relationship for the energy at 57°C:
| (11) |
After the linear fit (Figure 9), the energy barrier function at 57°C is:
| (12) |
Finally, subtracting Equation (10) from (12), we have the difference in the energy barrier between two protein structures folded under different temperatures but unfolded under the same loading rate v as:
| (13) |
We calculated the difference in energy at pulling speed 20 m/s between 7°C and 57°C by considering the work to unfold the structure as given by Eq. (5). We can neglect the final terms when we compute the energy difference because kBT is at least four orders of magnitude smaller than w(v, T). Thus the difference in energy can be simplified as:
| (14) |
The relationship between energy at high and low temperature becomes
| (15) |
We note that the difference E(57°C) − E(7°C) is positive for all values of v < 6.9 m/s, which is relevant to physiological loading conditions (Figure 10). Therefore, the energy barrier to unfold the structure at 57°C was greater than the energy barrier at 7°C. This result is counterintuitive because considering exclusively thermal effects we would expect the structure to be more easily perturbed at high temperature. However, we show that due to the presence of elastin-like domains, the molecule’s structure assumed a folded, densely-hydrogen-bonded shape. Hydrogen bonds persisted through the unfolding of the structure, creating a higher free energy barrier for the protein to unfold. Moreover, such a result agreed with the worm-like-chain model where the unfolding force is proportional to the temperature, suggesting that the amorphous structure of elastin affects the unfolding process to behave as an unraveling of a loose polymer structure.
Figure 10 |.
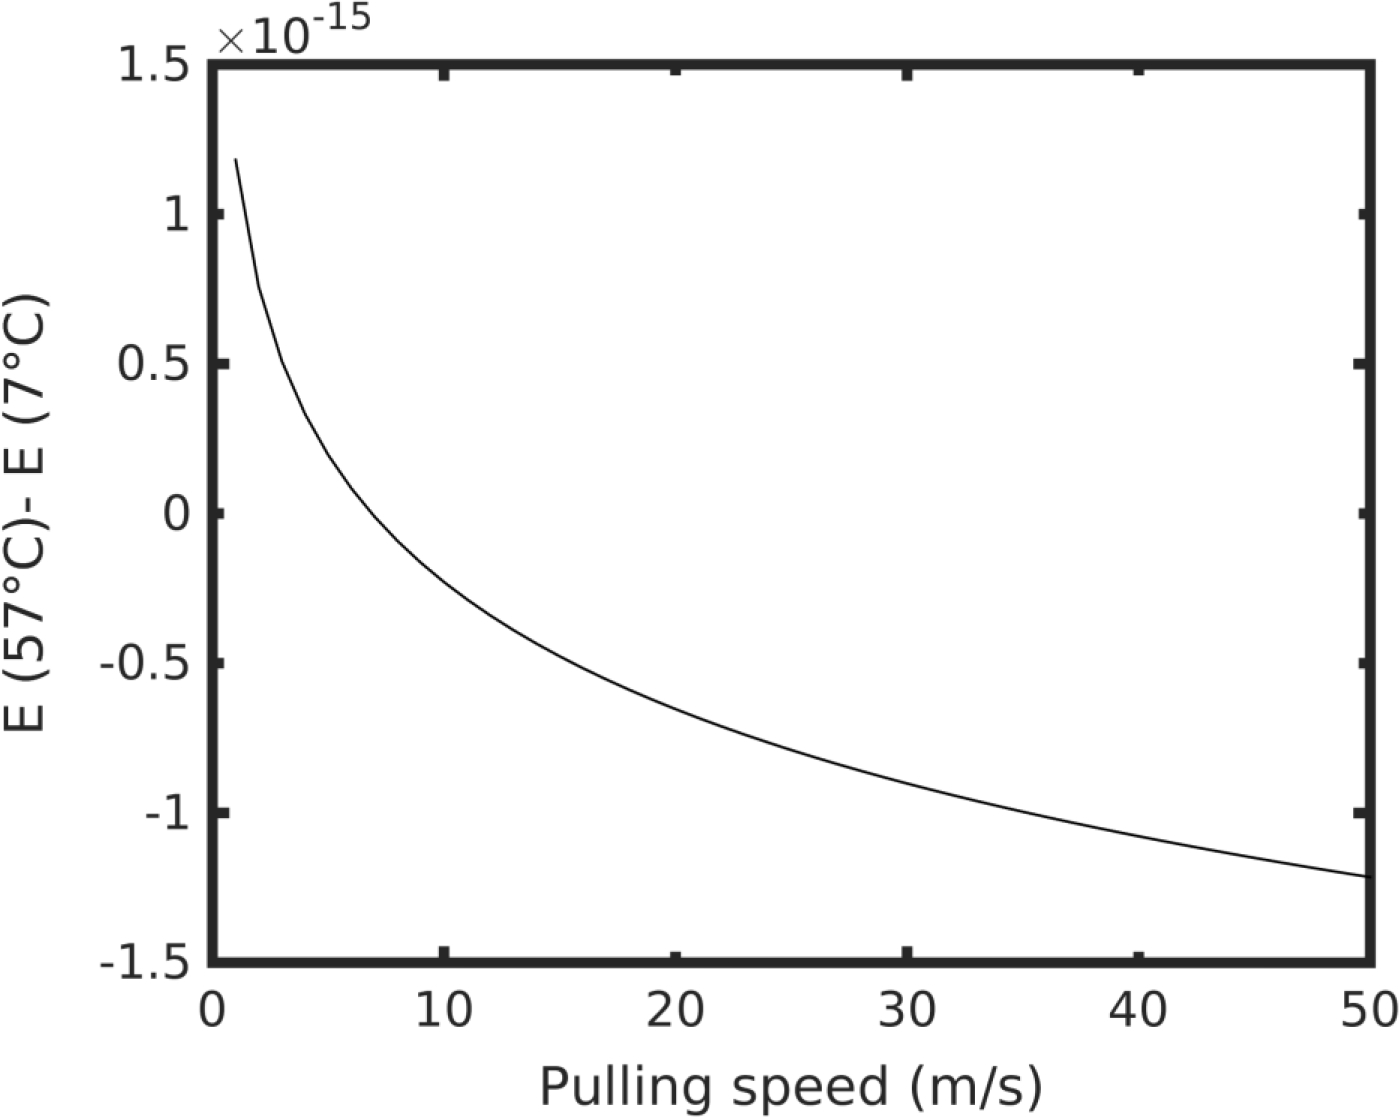
The energy difference between high and low temperature E(57°C) − E(7°C) as a function of pulling speed v.
The approaches and results identified here reside within single molecule chain dynamics. As next steps, the goal is to build upon these approaches with inputs of multiple chains and more complex material outcomes; for example, the assembly and packing of single molecule SELPs into micellar and hydrogel super-structures and the formation and dynamics of hydrogel systems. Such material systems will propel the insights from single molecules towards higher order systems, providing further utility to predictive outcomes of structure-function for these types of bioengineered protein materials. This could serve as a foundational tool for materials-by-design approaches with numerous applications in biomaterials technologies and beyond.
Conclusions
Using a combination of experimental, modeling and theoretical methods, we studied the structure and nanomechanics of SELPs at temperatures below and above the temperature transition range. Our results demonstrated that at the single-molecule scale, temperature induces a collapse of the SELP structure. A characteristic molecular bend was observed, accompanied by a dense formation of intra-molecular hydrogen bonds. DLS results confirmed the model’s predictions, showing a distinct reduction in hydrodynamic radius of the molecule at high temperature. This result was propagated to the hydrogel level, where temperature induced the hydrogel to shrink. This phenomenon was in agreement with the behavior of elastin-like peptide systems, where structural molecular folding characterizes phase transitions.
We found, furthermore, that nanomechanics of SELPs were highly temperature dependent, identifying specific mechanisms through which the molecule unfolded upon application of external force. At experimentally relevant pulling speeds, the free energy barrier at high temperature exceeded that at lower temperature. This result highlighted the structural role in the mechanics of unfolding in SELPs.
Supplementary Material
Acknowledgements
This work used the Extreme Science and Engineering Discovery Environment (XSEDE), which is supported by the National Science Foundation grant number ACI-1053575. The authors acknowledge support from the NIH (5U01EB014976) and ONR PECASE (N00014-10-1-0562) and ONR (N000141612333).
Footnotes
Supporting Information (SI)
SI Figures 1–5 are included in Supporting Information.
References
- 1.Huang W; Rollett A; Kaplan DL, Silk-elastin-like protein biomaterials for the controlled delivery of therapeutics. Expert Opin Drug Deliv 2015, 12 (5), 779–91. DOI: 10.1517/17425247.2015.989830. [DOI] [PMC free article] [PubMed] [Google Scholar]
- 2.Wang Q; Xia X; Huang W; Lin Y; Xu Q; Kaplan DL, High Throughput Screening of Dynamic Silk-Elastin-Like Protein Biomaterials. Adv Funct Mater 2014, 24 (27), 4303–4310. DOI: 10.1002/adfm.201304106. [DOI] [PMC free article] [PubMed] [Google Scholar]
- 3.Xia XX; Wang M; Lin Y; Xu Q; Kaplan DL, Hydrophobic drug-triggered self-assembly of nanoparticles from silk-elastin-like protein polymers for drug delivery. Biomacromolecules 2014, 15 (3), 908–14. DOI: 10.1021/bm4017594. [DOI] [PMC free article] [PubMed] [Google Scholar]
- 4.Xia XX; Xu Q; Hu X; Qin G; Kaplan DL, Tunable self-assembly of genetically engineered silk--elastin-like protein polymers. Biomacromolecules 2011, 12 (11), 3844–50. DOI: 10.1021/bm201165h. [DOI] [PMC free article] [PubMed] [Google Scholar]
- 5.Huang W; Tarakanova A; Dinjaski N; Wang Q; Xia X; Chen Y; Wong JY; Buehler MJ; Kaplan DL, Design of Multi-Stimuli Responsive Hydrogels using Integrated Modeling and Genetically Engineered Silk-Elastin-Like-Proteins. Advanced Functional Materials 2016, DOI: 10.1002/adfm.201600236, DOI: 10.1002/adfm.201600236. [DOI] [PMC free article] [PubMed] [Google Scholar]
- 6.Hwang W; Kim BH; Dandu R; Cappello J; Ghandehari H; Seog J, Surface Induced nanofiber growth by self-assembly of a silk-elastin-like protein polymer. Langmuir 2009, 25 (21), 12682–6. DOI: 10.1021/la9015993. [DOI] [PMC free article] [PubMed] [Google Scholar]
- 7.Ner Y; Stuart JA; Whited G; Sotzing GA, Electrospinning nanoribbons of a bioengineered silk-elastin-like protein (SELP) from water. Polymer 2009, 50 (24), 5828–5836. DOI: 10.1016/j.polymer.2009.09.017. [DOI] [Google Scholar]
- 8.Qiu WG; Huang YD; Teng WB; Cohn CM; Cappello J; Wu XY, Complete Recombinant Silk-Elastinlike Protein-Based Tissue Scaffold. Biomacromolecules 2010, 11 (12), 3219–3227. DOI: 10.1021/bm100469w. [DOI] [PMC free article] [PubMed] [Google Scholar]
- 9.Zhu JX; Huang WW; Zhang Q; Ling SJ; Chen Y; Kaplan DL, Aqueous-Based Coaxial Electrospinning of Genetically Engineered Silk Elastin Core-Shell Nanofibers. Materials 2016, 9 (4). DOI: ARTN 221 10.3390/ma9040221. [DOI] [PMC free article] [PubMed] [Google Scholar]
- 10.Qiu WG; Teng WB; Cappello JY; Wu X, Wet-Spinning of Recombinant Silk-Elastin-Like Protein Polymer Fibers with High Tensile Strength and High Deformability. Biomacromolecules 2009, 10 (3), 602–608. DOI: 10.1021/bm801296r. [DOI] [PubMed] [Google Scholar]
- 11.Gustafson J; Greish K; Frandsen J; Cappello J; Ghandehari H, Silk-elastinlike recombinant polymers for gene therapy of head and neck cancer: from molecular definition to controlled gene expression. J Control Release 2009, 140 (3), 256–61. DOI: 10.1016/j.jconrel.2009.05.022. [DOI] [PMC free article] [PubMed] [Google Scholar]
- 12.Haider M; Leung V; Ferrari F; Crissman J; Powell J; Cappello J; Ghandehari H, Molecular engineering of silk-elastinlike polymers for matrix-mediated gene delivery: biosynthesis and characterization. Mol Pharm 2005, 2 (2), 139–50. DOI: 10.1021/mp049906s. [DOI] [PubMed] [Google Scholar]
- 13.Hwang D; Moolchandani V; Dandu R; Haider M; Cappello J; Ghandehari H, Influence of polymer structure and biodegradation on DNA release from silk-elastinlike protein polymer hydrogels. Int J Pharm 2009, 368 (1–2), 215–9. DOI: 10.1016/j.ijpharm.2008.10.021. [DOI] [PMC free article] [PubMed] [Google Scholar]
- 14.Megeed Z; Haider M; Li D; O’Malley BW Jr.; Cappello J; Ghandehari H, In vitro and in vivo evaluation of recombinant silk-elastinlike hydrogels for cancer gene therapy. J Control Release 2004, 94 (2–3), 433–45. [DOI] [PubMed] [Google Scholar]
- 15.Anumolu R; Gustafson JA; Magda JJ; Cappello J; Ghandehari H; Pease LF 3rd, Fabrication of highly uniform nanoparticles from recombinant silk-elastin-like protein polymers for therapeutic agent delivery. ACS Nano 2011, 5 (7), 5374–82. DOI: 10.1021/nn103585f. [DOI] [PMC free article] [PubMed] [Google Scholar] [Retracted]
- 16.Urry DW, Entropic elastic processes in protein mechanisms. I. Elastic structure due to an inverse temperature transition and elasticity due to internal chain dynamics. J Protein Chem 1988, 7 (1), 1–34. [DOI] [PubMed] [Google Scholar]
- 17.Urry DW, Entropic elastic processes in protein mechanisms. II. Simple (passive) and coupled (active) development of elastic forces. J Protein Chem 1988, 7 (2), 81–114. [DOI] [PubMed] [Google Scholar]
- 18.Urry DW, Free energy transduction in polypeptides and proteins based on inverse temperature transitions. Progress In Biophysics And Molecular Biology 1992, 57 (1), 23–57. [DOI] [PubMed] [Google Scholar]
- 19.Urry DW, MOLECULAR MACHINES - HOW MOTION AND OTHER FUNCTIONS OF LIVING ORGANISMS CAN RESULT FROM REVERSIBLE CHEMICAL-CHANGES. ANGEWANDTE CHEMIE-INTERNATIONAL EDITION 1993, 32 (6), 819–841. [Google Scholar]
- 20.Urry DW, What sustains life? [electronic resource] : consilient mechanisms for protein-based machines and materials. New York, N.Y. : Springer, c2006.: 2006. [Google Scholar]
- 21.Urry DW; Gowda DC; Parker TM; Luan CH; Reid MC; Harris CM; Pattanaik A; Harris RD, Hydrophobicity scale for proteins based on inverse temperature transitions. Biopolymers 1992, 32 (9), 1243–1250. [DOI] [PubMed] [Google Scholar]
- 22.Urry DW; Trapane TL; Prasad KU, Phase-structure transitions of the elastin polypentapeptide-water system within the framework of composition-temperature studies. Biopolymers 1985, 24 (12), 2345. [DOI] [PubMed] [Google Scholar]
- 23.Urry DW; Trapane TL; Iqbal M; Venkatachalam CM; Prasad KU, Carbon-13 NMR relaxation studies demonstrate an inverse temperature transition in the elastin polypentapeptide. Biochemistry 1985, 24 (19), 5182–5189. [DOI] [PubMed] [Google Scholar]
- 24.Nuhn H; Klok HA, Secondary Structure Formation and LCST Behavior of Short Elastin-Like Peptides. BIOMACROMOLECULES 2008, 9 (10), 2755–2763. [DOI] [PubMed] [Google Scholar]
- 25.Ribeiro A; Arias FJ; Reguera J; Alonso M; Rodríguez-Cabello JC, Article: Influence of the Amino-Acid Sequence on the Inverse Temperature Transition of Elastin-Like Polymers. Biophysical journal 2009, 97, 312–320. DOI: 10.1016/j.bpj.2009.03.030. [DOI] [PMC free article] [PubMed] [Google Scholar]
- 26.MacKay JA; Callahan DJ; FitzGerald KN; Chilkoti A, Quantitative Model of the Phase Behavior of Recombinant pH-Responsive Elastin-Like Polypeptides. BIOMACROMOLECULES 2010, 11 (11), 2873–2879. [DOI] [PMC free article] [PubMed] [Google Scholar]
- 27.Meyer DE; Chilkoti A, Genetically encoded synthesis of protein-based polymers with precisely specified molecular weight and sequence by recursive directional ligation: Examples from the elastin-like polypeptide system. BIOMACROMOLECULES 2002, 3 (2), 357–367. [DOI] [PubMed] [Google Scholar]
- 28.Girotti A; Reguera J; Arias FJ; Alonso M; Testera AM; Rodriguez-Cabello JC, Influence of the molecular weight on the inverse temperature transition of a model genetically engineered elastin-like pH-responsive polymer. MACROMOLECULES 2004, 37 (9), 3396–3400. [Google Scholar]
- 29.Reguera J; Urry DW; Parker TM; McPherson DT; Rodriguez-Cabello JC, Effect of NaCl on the exothermic and endothermic components of the inverse temperature transition of a model elastin-like polymer. BIOMACROMOLECULES 2007, 8 (2), 354–358. [DOI] [PubMed] [Google Scholar]
- 30.McDaniel JR; Radford DC; Chilkoti A, A Unified Model for De Novo Design of Elastin-like Polypeptides with Tunable Inverse Transition Temperatures. BIOMACROMOLECULES 2013, 14 (8), 2866–2872. [DOI] [PMC free article] [PubMed] [Google Scholar]
- 31.Rauscher S; Baud S; Miao M; Keeley FW; Pomes R, Proline and glycine control protein self-organization into elastomeric or amyloid fibrils. STRUCTURE 2006, 14 (11), 1667–1676. [DOI] [PubMed] [Google Scholar]
- 32.Li B; Alonso DOV; Daggett V, The molecular basis for the inverse temperature transition of elastin. JOURNAL OF MOLECULAR BIOLOGY 2001, 305 (3), 581–592. [DOI] [PubMed] [Google Scholar]
- 33.Li NK; García Quiroz F; Hall CK; Chilkoti A; Yingling YG, Molecular description of the LCST behavior of an elastin-like polypeptide. Biomacromolecules 2014, 15 (10), 3522–3530. DOI: 10.1021/bm500658w. [DOI] [PubMed] [Google Scholar]
- 34.Anna Tarakanova WH, Weiss Anthony S., Kaplan David L., Buehler Markus J., Computational Smart Polymer Design based on Elastin Protein Mutability In Preparation. 2016. [DOI] [PMC free article] [PubMed] [Google Scholar]
- 35.Tarakanova A; Buehler MJ, Molecular modeling of protein materials: case study of elastin. Model Simul Mater Sc 2013, 21 (6). DOI: Artn 063001 10.1088/0965-0393/21/6/063001. [DOI] [Google Scholar]
- 36.Keten S; Buehler MJ, Atomistic model of the spider silk nanostructure. Applied Physics Letters 2010, 96 (15), 153701. DOI: 10.1063/1.3385388. [DOI] [Google Scholar]
- 37.Keten S; Buehler MJ, Nanostructure and molecular mechanics of spider dragline silk protein assemblies. J R Soc Interface 2010. [DOI] [PMC free article] [PubMed] [Google Scholar]
- 38.Keten S; Xu Z; Ihle B; Buehler MJ, Nanoconfinement controls stiffness, strength and mechanical toughness of beta sheet crystals in silk. Nature Materials 2010, 9 (4), 359–367. DOI: 10.1038/nmat2704 10.1038/NMAT2704. [DOI] [PubMed] [Google Scholar]
- 39.Brooks BR; Bruccoleri RE; Olafson BD; States DJ; Swaminathan S; Karplus M, CHARMM: a program for macromolecular energy, minimisation, and dynamics calculations. Journal of Computational Chemistry 1983, 4 (2), 187–217. [Google Scholar]
- 40.Sugita Y; Okamoto Y, Replica-exchange molecular dynamics method for protein folding. Chemical Physics Letters 1999, 314 (1–2), 141–151. DOI: 10.1016/S0009-2614(99)01123-9. [DOI] [Google Scholar]
- 41.Feig M; Karanicolas J; Brooks IIICL, MMTSB Tool Set: enhanced sampling and multiscale modeling methods for applications in structural biology. Journal of Molecular Graphics and Modelling 2004, 22, 377–395. DOI: 10.1016/j.jmgm.2003.12.005. [DOI] [PubMed] [Google Scholar]
- 42.Lazaridis T; Karplus M, Effective energy function for proteins in solution. Proteins 1999, 35 (2), 133–52. [DOI] [PubMed] [Google Scholar]
- 43.Humphrey W; Dalke A; Schulten K, VMD: Visual molecular dynamics. Journal of Molecular Graphics 1996, 14 (33). [DOI] [PubMed] [Google Scholar]
- 44.Van Der Spoel D; Lindahl E; Hess B; Groenhof G; Mark AE; Berendsen HJ, GROMACS: fast, flexible, and free. J Comput Chem 2005, 26 (16), 1701–18. DOI: 10.1002/jcc.20291. [DOI] [PubMed] [Google Scholar]
- 45.MacKerell AD; Bashford D; Bellott M; Dunbrack RL; Evanseck JD; Field MJ; Fischer S; Gao J; Guo H; Ha S; Joseph-McCarthy D; Kuchnir L; Kuczera K; Lau FTK; Mattos C; Michnick S; Ngo T; Nguyen DT; Prodhom B; Reiher WE; Roux B; Schlenkrich M; Smith JC; Stote R; Straub J; Watanabe M; Wiórkiewicz-Kuczera J; Yin D; Karplus M, All-Atom Empirical Potential for Molecular Modeling and Dynamics Studies of Proteins. The Journal of Physical Chemistry B 1998, 102 (18), 3586–3616. DOI: 10.1021/jp973084f. [DOI] [PubMed] [Google Scholar]
- 46.Berendsen HJC; Postma JPM; van Gunsteren WF; DiNola A; Haak JR, Molecular dynamics with coupling to an external bath. Journal of Chemical Physics 1984, 81 (8), 3684. [Google Scholar]
- 47.Parrinello M; Rahman A, Polymorphic transitions in single crystals: A new molecular dynamics method. Journal of Applied Physics 1981, 52 (12), 7182. [Google Scholar]
- 48.Hess B, P-LINCS: A parallel linear constraint solver for molecular simulation. J Chem Theory Comput 2008, 4 (1), 116–122. DOI: 10.1021/ct700200b. [DOI] [PubMed] [Google Scholar]
- 49.Essmann U; Perera L; Berkowitz ML; Darden T; Lee H; Pedersen LG, A smooth particle mesh Ewald method. Journal of Chemical Physics 1995, 103 (19), 8577. [Google Scholar]
- 50.Patriksson A; van der Spoel D, A temperature predictor for parallel tempering simulations. Physical Chemistry Chemical Physics 2008, 10 (15), 2073–2077. DOI: DOI: 10.1039/b716554d. [DOI] [PubMed] [Google Scholar]
- 51.Towns J; Cockerill T; Dahan M; Foster I; Gaither K; Grimshaw A; Hazlewood V; Lathrop S; Lifka D; Peterson GD; Roskies R; Scott JR; Wilkens-Diehr N, XSEDE: Accelerating Scientific Discovery. Computing in Science & Engineering 2014, 16 (5), 62–74. DOI: DOI: 10.1109/MCSE.2014.80. [DOI] [Google Scholar]
- 52.Joosten RP; te Beek TAH; Krieger E; Hekkelman ML; Hooft RWW; Schneider R; Sander C; Vriend G, A series of PDB related databases for everyday needs. Nucleic Acids Research 2011, 39 (Database issue), D411–D419. DOI: 10.1093/nar/gkq1105. [DOI] [PMC free article] [PubMed] [Google Scholar]
- 53.Kabsch W; Sander C, Dictionary of protein secondary structure: Pattern recognition of hydrogen-bonded and geometrical features. Biopolymers 1983, 22 (12), 2577–2637. DOI: 10.1002/bip.360221211. [DOI] [PubMed] [Google Scholar]
- 54.Whitmore L; Wallace BA, DICHROWEB, an online server for protein secondary structure analyses from circular dichroism spectroscopic data. Nucleic Acids Research 2004, 32, W668–W673. DOI: 10.1093/nar/gkh371. [DOI] [PMC free article] [PubMed] [Google Scholar]
- 55.Ackbarow T; Chen X; Keten S; Buehler MJ, Hierarchies, multiple energy barriers, and robustness govern the fracture mechanics of alpha-helical and beta-sheet protein domains. Proceedings of the National Academy of Sciences of the United States of America 2007, 104 (42), 16410–16415. DOI: 10.1073/pnas.0705759104. [DOI] [PMC free article] [PubMed] [Google Scholar]
- 56.Qin Z; Buehler MJ, Molecular dynamics simulation of the alpha-helix to beta-sheet transition in coiled protein filaments: evidence for a critical filament length scale. Phys Rev Lett 2010, 104 (19), 198304. DOI: DOI 10.1103/PhysRevLett.104.198304. [DOI] [PubMed] [Google Scholar]
- 57.Qin Z; Kalinowski A; Dahl KN; Buehler MJ, Structure and stability of the lamin A tail domain and HGPS mutant. Journal of Structural Biology 2011, 175 (3), 425–433. DOI: DOI 10.1016/j.jsb.2011.05.015. [DOI] [PMC free article] [PubMed] [Google Scholar]
- 58.Qin Z; Fabre A; Buehler MJ, Structure and mechanism of maximum stability of isolated alpha-helical protein domains at a critical length scale. European Physical Journal E 2013, 36 (5). DOI: Artn 53 Doi 10.1140/Epje/I2013-13053-8. [DOI] [PubMed] [Google Scholar]
- 59.Zhao Y; Gao JM, A split ligand for lanthanide binding: facile evaluation of dimerizing proteins. Chem. Commun. 2012, 48 (24), 2997–2999. DOI: 10.1039/c2cc17891e. [DOI] [PubMed] [Google Scholar]
Associated Data
This section collects any data citations, data availability statements, or supplementary materials included in this article.


