

Abstract
In this computer world, huge data are generated in several fields. Statistics in the healthcare engineering provides data about many diseases and corresponding patient’s information. These data help to evaluate a huge amount of data for identifying the unknown patterns in the diseases and are also utilized for predicting the disease. Hence, this work is to plan and implement a new computer-aided technique named modified Ensemble Learning with Weighted RBM Features (EL-WRBM). Data collection is an initial process, in which the data of various diseases are gathered from UCI repository and Kaggle. Then, the gathered data are pre-processed by missing data filling technique. Then, the pre-processed data are performed by deep belief network (DBN), in which the weighted features are extracted from the RBM regions. Then, the prediction is made by ensemble learning with classifiers, namely, support vector machine (SVM), recurrent neural network (RNN), and deep neural network (DNN), in which hyper-parameters are optimized by the adaptive spreading rate-based coronavirus herd immunity optimizer (ASR-CHIO). At the end, the simulation analysis reveals that the suggested model has implications to support doctor diagnoses.
Keywords: Multi-disease prediction, RBM-based deep features, Recurrent neural network, Deep neural network, Adaptive spreading rate-based coronavirus herd immunity optimizer, Modified ensemble learning with weighted RBM features, Support vector machine
Introduction
Predicting the diseases is helpful for patients in managing experiments on presented medicine by identifying the possible diseases; otherwise, the patients may pass over considerable medical tests owing to the inadequate of medical data [1]. In health maintenance sector, the enhancements in predictive analytics focus on method intelligible [2]. The major requirement in health maintenance part is to offer forecast and more information on disease categorization. Additionally, Hepatitis B, Tuberculosis, Hepatitis C, Dengue, Malaria, lung cancer, circRNA disease, Chronic Renal Disease, Neurological Diseases, cardiovascular disease, miRNAs disease, Parkinson’s disease, cancer Chronic Disease, and Alzheimer’s disease are different types of diseases [3]. An analysis of conventional data assists the doctors in detecting the prototype and also helps the doctors in finding the diseases [4, 5].
Single disease prediction model performs based on medical encounters or exact test results, whereas the multi-disease forecast gets a patient’s taken as a whole medical record into concern and recognizes the effect of diverse diseases [6]. Several literatures on healthcare informatics have developed models for predicting the disease progression [7, 8]. Several conventional approaches enhance the models for predicting the evolution of single disease, such as glaucoma, coronary heart disease, and Alzheimer’s. Multi-disease prediction has ability for recognizing various diseases, where an individual is probable to sustain over a certain periods. In types of diseases might be at diverse evolution stages and must diagnose during different clinical visits [9, 10]. An approach that performs multi-disease prediction is mainly used to exploit the intrinsic relationship amidst particular diseases, which includes their general causes, comorbid situations, symptoms, and distinguish components [11]. Also, the multi-disease model permits practitioners to distribute the learning data that has been made for a certain disease to monitor other relevant diseases [12].
Machine learning algorithms utilize large datasets to generalize, learn and predict [13]. These algorithms are applicable in many areas such as identifying the likelihood of the occurrence of rainfall in a certain area, forecasting the sales of the things, etc. [14]. Generally, machine-learning algorithms deal with three research problems namely classification, clustering, and regression. Neural network and other predictive analytics algorithms are improved for predicting and detecting the diseases [15, 16]. A major enhancement in machine learning is the rapid development of deep structured learning algorithms. It effectively extracts the significant features from complex and high-dimensional datasets [17]. Deep learning has revealed the breakthrough performance in many areas. Through a stacked and hierarchical learning process, the deep learning approach effectively capture complex relationship amidst high-dimensional features either consequential or spatial. Many algorithms are combined to initiate the hybrid optimization algorithms [18, 19] that can perform well while comparing with other conventional algorithms. Thus, this paper focuses on implementing a novel disease prediction method by adopting the deep structured learning approaches with ensemble concept.
The major scope of the suggested multi-disease prediction approach is added below.
To design a new multi-disease prediction approach with weighted RBM features together with ensemble learning by suggesting a new optimization algorithm to get the respective predicted outcomes with maximum accuracy.
To design a new optimized ensemble learning model with prediction models like DNN, SVM, and RNN through parameter tuning by ASR-CHIO algorithm for maximizing the prediction rate.
To introduce the ASR-CHIO algorithm for optimizing the number of suitable hidden neuron of DNN, maximum iteration of SVM, and the number of suitable hidden neuron of RNN for getting superior multi-disease prediction outcomes and to improve the efficiency of ensemble method.
To determine the efficiency of the offered approach by comparing with existing prediction models and meta-heuristic algorithms using standard measures.
The remaining sections are depicted below. Section 2 provides the conventional studies. Section 3 describes a novel multi-disease prediction method with modified deep learning. Section 3 indicates “Modified Ensemble Learning with Weighted RBM Features for Multi-disease Prediction”. Section 5 represents “Hyperparameter Tuning in Ensemble Learning for Enhanced Multi-disease Prediction”. Section 6 describes “Results ” and Section “7” gives "Conclusion".
Literature Study
Existing Works
In 2020, Wang et al. [20] have implemented a novel method to evaluate the disease hazards for patients depended on their medical history. For prediction, the medical diagnoses were accumulated into diverse level for meeting the requirements of diverse stakeholders. The suggested model has utilized two independent hospital medical datasets. Initially, the proposed work has demonstrated a high difference in patient’s characters. The analysis has revealed that the deep structured learning techniques have obtained the efficient performance in diverse stages of diagnosis aggregation.
In 2021, Kumar et al. [21] have planned a novel method to predict multi-disease by deep learning. The data were taken from many standard datasets. Then, the accurate feature selection was utilized to the attributes set. It was achieved by combining two algorithms. Then, the hidden neuron count of DBN and neural network was optimized using hybrid Lion-based Butterfly Optimization Algorithm (L-BOA). At the end, simulation outcomes have demonstrated that the proposed work has achieved better results.
In 2021, Harimoorthy and Thangavelu [22] have implemented architecture to predict the diseases. This scheme was tested with reduced set of features regarding diabetes, heart disease, and chronic kidney disease with the help of enhanced predictive analytics process. Moreover, this scheme has evaluated with other conventional approaches. Thus, the simulation results have confirmed that the offered method has secured highest accuracy while evaluating with other conventional techniques. In 2021, Men et al. [23] have proposed a novel model for performing multi-disease prediction. The suggested approach has used a deep learning approach and extended it with two procedures. The time-aware procedure was utilized for handling the sequential indiscretion across clinical visits. For prediction task, the attention-based procedure has helped in resolving the significance of every visit. Thus, the suggested model has obtained good performance while predicting future disease diagnoses.
In 2019, Mohan et al. [24] have introduced a novel technique that has aimed at discovering important features by utilizing machine-learning model for ensuring in enhancing the accuracy in cardiovascular disease prediction. The prediction approach was initiated by diverse integrations of features and classification methods. The experimental analysis has revealed that the deep learning approaches have achieved maximum accuracy while evaluating with other existing methods.
In 2020, Fitriyani et al. [25] have estimated a successful method to predict heart disease that has consisted of clustering-based application for detecting and eliminating the outliers, over-sampling approach for corresponding the distribution of learning data and XGBoost for predicting the heart disease. Two datasets were utilized for constructing the model and the experimental outcomes were evaluated with existing models. The outcomes have demonstrated that the suggested model has performed well, while evaluating with different traditional approaches. Moreover, the proposed model has designed the prototype to assist doctors detect the patient’s heart disease level in terms of their present situation.
In 2019, Fitriyani et al. [26] have developed a disease prediction method for providing an initial detection for hypertension and type-2 diabetes in terms for individual's risk factors’ information. The suggested approach has comprised of over-sampling approach for balancing the distribution of data, outlier detection technique for removing outlier data and an ensemble model for predicting the diseases. In this case, four datasets were employed for constructing the approach and also extracted the major hazards factors. The simulation outcomes have provides that the implemented technique has secured highest accuracy in comparison with other baseline techniques.
In 2020, Hasnony et al. [27] have implemented a successful approach to predict the Parkinson's disease. The suggested approach has utilized the benefits of the “Particle Swarm Optimization (PSO) and the Grey Wolf Optimization (GWO)” to adjust the parameters for the initialization. The fog processing has employed for collecting and evaluating the data at the boundary of the gateways and reporting the local community instantaneously. Furthermore, the suggested approach has employed for predicting Parkinson's disease and has obtained maximum accuracy while validating with other conventional optimization algorithms.
In 2020, Adhi et al. [28] have investigated a huge-array-based deep structured learning models like discriminant, rule-based classifiers, tree, ensemble, probability, and neural. In this research work, the datasets were collected from standardized datasets and the datasets ranges from various diseases. This research work has established the generalizability of the deep structured learning models in multiple disease prediction. Finally, this proposed work was confirmed that the conditional inference tree forest (cforest) has the better deep structured deep learning model when comparing with the others.
In 2020, Adhi et al. [29] have implemented a Coronary Heart Disease (CHD) using deep structured learning models. The base deep structured learning models of another ensemble were utilized for generated a two-tier ensemble. The forecasting model has estimated on standardized heart disease datasets to generalize the features of the suggested model. However, the optimal features were obtained using particle swarm optimization-based feature selection. Finally, the suggested method was evaluated using the twofold and tenfold statistical test, and it was revealed that the recommended method has provided enriched performance than the other optimization algorithms.
Problem Statement
Prediction the disease is a complicated issue, which must be necessary for an individual before it attains serious phase. After predicting the disease, the risk of specific individuals is minimized. Thus, prediction of diseases at initial phase acts as a major part. Thus, the demand on multi-disease prediction approaches is required for reducing the time complexity and the possibility of reducing the mortality rate. Therefore, this paper improves a new multi-disease prediction method for forecasting the more types of diseases. Numerous disease detection approaches are reviewed in Table 1. LSTM–RNN [20] have tested and trained on different datasets and attained superior performance. It is more suitable for real-world applications. However, this model is not suitable for performing the huge dataset with classes like lab tests, procedures information, drug information, and other appropriate data for further enhancing multi-disease risk prediction. L-BOA [21] obtains superior prediction rate and efficiently identifies the multi-diseases. It gets lower precision rate at the initial iterations. SVM-Radial bias kernel approach [22] attains higher accuracy rate and shows superior specificity and lower misclassification rate. However, this model is not appropriate for processing the huge scale datasets. LSTM [23] increases the quality of healthcare service and gets high feasibility while processing the large-scale clinical record data set. Conversely, it suffers computational complexity while increasing the input features. HRFLM [24] gets higher accuracy level, which is more suitable for processing real-world datasets. The efficiency of the designed model is affected by existing feature selection approaches. XGBoost [25] offers early diagnosis and effectively balances the unbalanced training dataset. Though, it is not appropriate to process the other data with the method hyper-parameters and broader medical datasets. Ensemble approach [26] can be more suitable for real-time mobile applications and effectively balances the unbalanced dataset. It is not efficient to process the optimal method parameters for the method and utilizing other clinical datasets with huge attributes. ANFIS + PSOGWO [27] has attained higher prediction accuracy and efficient for real-time data processing and analysis and solving the cloud problems. On the other hand, it is not applicable to evaluate the larger datasets. As the existing models have several problems, there is a purpose of developing a novel multi-prediction method.
Table 1.
Merits and demerits of multi-disease prediction models
| Author [citation] | Techniques | Merits | Demerits |
|---|---|---|---|
| Wang et al. [20] | LSTM–RNN |
They have tested and trained on different datasets and attained superior performance It is applicable for real-world benefits |
However, this model is not suitable for performing the huge dataset with classes like lab tests, procedures information, drug information, and other appropriate data for then enhancing multi-disease risk prediction |
| Kumar et al. [21] | L-BOA |
It obtains superior prediction rate It efficiently identifies the multi-diseases |
It gets lower precision rate at the initial iterations |
| Harimoorthy and Thangavelu [22] | SVM-Radial bias kernel approach |
It attains higher accuracy rate It shows superior specificity and lower misclassification rate |
However, this model is not appropriate for processing the huge scale datasets |
| Men et al. [23] | LSTM |
It increases the quality of healthcare service It gets high feasibility while processing the large-scale clinical record data set |
It suffers computational complexity while increasing the input features |
| Mohan et al. [24] | HRFLM |
It gains maximum accuracy level It is applicable for processing real-world datasets |
The performance of the designed model is affected by existing feature selection approaches |
| Fitriyani et al. [25] | XGBoost |
It offers early diagnosis It effectively balances the unbalanced training dataset |
It is not appropriate to process the other data sampling with the methods hyper-parameters and larger medical datasets |
| Fitriyani et al. [26] | Ensemble approach |
It can be more suitable for real-time mobile applications It effectively balances the unbalanced dataset |
It is not efficient to process the accurate method constraints for the approach and utilizing other clinical datasets with huge attributes |
| Hasnony et al. [27] | ANFIS + PSOGWO |
It has attained higher prediction accuracy It is efficient for real-time data processing and analysis and solving the cloud problems |
It is not applicable to evaluate the larger datasets |
A New Multi-disease Prediction Method with Modified Deep Learning
Multi-disease Data Used for Processing
Here, six datasets are utilized in the proposed model for evaluating the performance, which are COVID-19 prediction, EEG eye state, Epileptic Seizure Recognition, Stroke prediction, Heart-statlog, and Diabetic Retinopathy Debrecen. The description of these datasets is mentioned below.
Dataset 1 (COVID-19 Prediction) Here, the data are gathered from https://github.com/nshomron/covidpred: Access Date: 2022–01-05”. This dataset have primary records, where on a daily basis, all the people are tested for COVID-19. Moreover, many information including the test date and results are offered that includes sex, symptoms, and binary signal regarding whether the tested person is aged 60 years or above. Here, it includes three cases like positive, negative, and other cases. The total data collected from the patients are 32,876.
Dataset 2 (EEG Eye State) Here, the data are gathered from “https://archive.ics.uci.edu/ml/datasets/EEG+Eye+State#: Access Date: 2022–01-05”. This dataset consists of 14 EEG values and it indicates the eye state. In EEG measurement, the eye state was recognized through a camera, and later, it included physically to the file after considering the video frames. Here, ‘0’ represents the eye-open state and ‘1’denotes the eye-closed state. The total data collected from the patients are 14,980.
Dataset 3 (Epileptic Seizure Recognition) Here, the data are taken from “https://www.kaggle.com/maximkumundzhiev/epileptic-seizure-recognition/data: Access Date: 2022–01-05”. This dataset is a re-structured and pre-processed version of frequently used dataset. It contains five diverse directories, each with 100 files. Every directory denotes a single person. Every directory is a recording of brain activity for 23.6 s. This dataset has 180 columns and 1150 unique values. The total data collected from the patients are 11,500.
Dataset 4 (Stroke Prediction) Here, the data are collected from “https://www.kaggle.com/fedesoriano/stroke-prediction-dataset: Access Date: 2022–01-05”. As reported by “World Health Organization (WHO)”, stroke is a second leading cause of death. This dataset is utilized for predicting whether a patient has possible to get stroke based on the input parameters such as age, gender, different diseases, and smoking status. Each row in the data gives related information about the patient. The total data collected from the patients are 5110.
Dataset 5 (Heart-Statlog) Here, the data are gathered from “https://datahub.io/machine-learning/heart-statlog#resource-heart-statlog_zip:Access Date: 2022–01-05”. This dataset represents the heart diseases database, which is related to a database already available in the repository but in a slightly diverse form. It contains 13 attributes namely results, count of main vessels colored by fluoroscopy, the gradient of the peak exercise ST segment, exercise induced angina, higher heart rate is obtained, resting electrocardiographic outcomes, fasting blood sugar > 120 mg/dl, serum cholesterol in mg/dl, resting blood pressure, chest pain type, sex and age. The total data collected from the patients are 1190.
Dataset 6 (Diabetic Retinopathy Debrecen) Here, the data are gathered from “https://archive.ics.uci.edu/ml/datasets/Diabetic+Retinopathy+Debrecen+Data+Set#: Access Date: 2022–01-05”. This dataset includes features extracted from the Messidor image set are used for detecting whether an image has symptoms of diabetic retinopathy or not. Entire features indicate either an image-level descriptor or detected lesion. The total data collected from the patients are 1151.
Consider the input data as , where . Here, the count of data present in a dataset is represented as .
Architecture of Suggested Disease Prediction Method
Disease prediction is one of the complicated issues, which must be necessary for an individual before it reaches serious stage. Major diseases are like cancer, diabetes, vision impairment, cardiovascular diseases, brain health, etc. These diseases affect the health and decrease the personal productivity. The main objective of disease prediction [30] helps to predict the possibility of an individual suffering from certain disease in the future. A major issue of predicting chronic diseases in many cases is that the patient does not aware of the evolution of disease in their body until these conditions are detected in a secondary stage of diagnosis [31]. For past few years, machine-learning models [32, 33] have been generally suitable for prediction and classification of diseases like fibrosis, cirrhosis, chronic diseases, namely, Alzheimer’s, Parkinson, kidney, heart, etc. Various techniques in data mining and Neural Network are utilized for discussing the seriousness of heart diseases. The disease severity is categorized by different models. Moreover, deep learning [34] approaches are employed in many sectors, which are connected with medical science effectively. It is employed to minimize the cost and also applied for enhancing the accuracy of diagnosis. Thus, the above drawbacks are considered, and so, it is essential to concentrates on improving the new model using ensemble techniques. The structural design of suggested multi-disease prediction approach is depicted in Fig. 1.
Fig. 1.

Architecture of suggested multi-disease prediction model
Initially, the standard data are gathered from six datasets, namely, COVID-19 [35] prediction, EEG eye state, epileptic-seizure-recognition, stroke prediction, heart-statlog, and diabetic retinopathy debrecen. Furthermore, the collected data are subjected to the pre-processing parts and it is utilized to convert the raw data into helpful and understandable format, which helps for accurate prediction. Here, the pre-processing is employed by absent data filling technique. After that, the pre-processed data are fed into feature extraction phase. It is used to decrease the dimensionality of data by removing the redundant data and it control overfitting problem. Here, the weighted features are extracted from the RBM layers of DBN. Then, the prediction is done by the ensemble learning with classifiers, such as DNN, SVM, and RNN [36]. Ensemble methods utilize multiple learning classifiers for obtaining better predictive performance. This ensemble model uses optimized networks, where the number of suitable hidden neuron count of DNN, maximum iterations of SVM, and the number of suitable hidden neuron count of RNN are tuned with the help of proposed ASR-CHIO. It is used for predicting the diseases [37, 38] from different datasets. Thus, the developed method secured highest accuracy while predicting the diseases.
Data Pre-processing
In the proposed model, the gathered data are pre-processed by missing data filling technique [39]. The pre-processing is utilized for cleaning the data in particular form and makes it to give the clean data to the model. Here, the occurrence of missing values for data is a critical problem to solve. The presence of data contained missing values owing to many situations like human error, machine failures, changes in the siting monitors, and routine maintenance. Hence, it is significant to improve the data and analyzed to be of high quality. It is used for minimizing the original data size by removing the unrelated information present in the data. In data mining technique, it converts the raw data into a more useful, understandable and efficient format. Missing data padding method is applied to fill the blank spaces or space in the dataset with required values. It adds values to the missing scheme of a single group. The better way to resolve the incomplete data issue is the implementation of interpolation approaches. Various interpolation approaches are linear, quadratic and cubic interpolation. In this research work, the linear interpolation techniques are used for filling the missing data due to its simplest way to resolve the issue.
Linear Interpolation [40] It is the simplest form of interpolation which is used to connect two data points with a straight line and it is expressed in Eq. (1)
| 1 |
From the above equation, is the independent variable, is a known value of the independent variable, and is the value of the dependent variable for a value of the independent variable. Here, Eqs. (2), and (3) is formulated with the help of Eq. (3)
| 2 |
| 3 |
Finally, the pre-processed data are denoted by and it is given to the feature extraction phase.
Modified Ensemble Learning with Weighted RBM Features for Multi-disease Prediction
RBM-Based Feature Extraction
In the suggested method, the features are acquired by DBN. Here, the final pre-processed data are given to the DBN for extracting the features. Feature extraction is a method of minimizing the source count to reduce the complexity, thus improving the overall performance. DBN [21] is a category of generative neural network that utilizes an unsupervised predictive analytics approach for producing better outcomes. It has some benefits like fast inference and has ability for encoding higher order network configurations. It contains many Restricted Boltzmann Machines (RBMs) like hidden layer of each RBM function as noticeable layer to the next RBM. It is the visible layer of DBN and the remaining layers are hidden layers. The input data are subjected to neural network and it is observed as the input to the DBN. It is composed of visible layers that are similar to neural network. The result attained from DBN is denoted as . Moreover, the outcome includes the sinusoidal function likelihood , and it is expressed in Eqs. (4), and (5)
| 4 |
| 5 |
Here, the temperature parameter is represented as Pt. Also, based on Boltzmann distribution, Boltzmann approach is developed with the accurate modeling of input patterns, and it is denoted in Eqs. (6) and (7)
| 6 |
| 7 |
Here, the neuron’s biases are considered as , the term indicates the neuron state, and the term denotes weight among the neurons. In DBN, the Boltzmann approach encloses the neurons with Eq. (8). Furthermore, the formation between the visible and the hidden neurons concerning with the energy is given by Eqs. (9), (10), and (11)
| 8 |
| 9 |
| 10 |
| 11 |
Here, the terms and represent the hidden and visible neurons, respectively, and the terms and indicate the bias weights of hidden and visible neurons, respectively. Finally, the extracted features from RBM are represented as where ; here, defines the DBN features count.
Weighted RBM Deep Feature Extraction
In this suggested model, the features are extracted by DBN network through RBM layer. The output of the pre-processed data is given to the DBN network. In this case, the DBN extracts the features as . Finally, the weighted RBN extracted features are obtained by multiplying weight with features extracted from the DBN network and it is expressed in Eq. (12)
| 12 |
Here, the term represents the weighted RBM extracted features; the term denotes weight, and the term indicates the features extracted from DBN network.
Proposed EL-WRBM
The extracted weighted features are subjected to the ensemble learning with classifiers like DNN, SVM, and RNN, and in the end, the predicted results are attained. The major advantage is that the ensemble learning classifier provides accurate predictions, and it performs superior to the single contributing model. It integrates the decisions from many models for enhancing the whole system efficiency. The suggested multi-disease prediction model uses ensemble model by optimizing the number of suitable hidden neuron of DNN, maximum iteration of SVM, and the number of suitable hidden neuron of RNN by ASR-CHIO algorithm for getting a better prediction outcomes. It utilized for maximizing the accuracy of the multi-disease prediction method.
DNN [18] For DNN, the extracted weighted RNM features is taken as the input. The developed multi-disease prediction method utilizes optimized DNN with the optimization of the hidden neuron count using ASR-CHIO algorithm. DNN automatically detects the important features form the images. It gives very high accuracy in image recognition issues. It minimizes the computation time, and also, it is appropriate for real-time applications. The main features are easy initialization and efficient modification. It enhances the accuracy rate of the suggested method. It is one of part of artificial neural network (ANN) [41] that is regarded as an information transforming model and it have deeply connected elements called as neurons that are worked together to solve the certain problems. DNN is considered by utilizing many ANN layers. The suggested model focuses on dense layers, in which the stylometric natures are developed. The statistical form of hidden layer is expressed in Eq. (13)
| 13 |
The term indicates the input data, and the weight and bias matrix are represented as and , respectively, which are considered as measures that are determined at training process. When the entire neurons are linked in the network, it is termed as “dense layers”. When the outcome of the network is determined, each node from the network encloses an activation function and it plays a major role in neural network. In a suggested method, they have elected softmax and ReLU function for improving the efficiency
| 14 |
In Eq. (14), a function for the node in the network is represented and the biased average of inputs is given as an input to an activation function and bias . In neural network, the data passed through the entire linked nodes and it gets trigger by the utilization of activation function.
The training of DNN comprises of an iterative run through the whole dataset by giving weights and biases. The likelihoods are gathered, and also, the gradients are estimated. The gradients are then utilized as the vectors for pointing out the loss function with local minima. It performs well while handling sparse gradient during noisy problems and this optimizer helps to attain superior outcomes. The improved method constructs a three-sequential neural network for testing the accuracy, where fourfold cross-validation is employed. When the number of epochs and folds enlarges, it achieves maximum accuracy. Finally, it gets the predicted outcomes from the optimized DNN through ASR-CHIO technique.
SVM [22] The suggested multi-disease prediction model uses optimized SVM by optimizing the maximum iteration with ASR-CHIO algorithm. Here, the iteration limit of SVM classifier is tuned for enhancing the performance of classified outcomes and for reducing the generalization error. Initially, it generates a hyperplane dimension and the mapping function is employed rather than actual data into better aspect and the statistics gathered from the two classes are divided by hyperplane through the border. If the margin is larger, then the generalization is higher.
Every pattern is modified altered to the factor as given in Eq. (15)
| 15 |
In an augmented space, the linear discriminate is given in Eq. (16)
| 16 |
The condition utilized for separating hyper plane is expressed as . The best classification outcomes are obtained by increasing the margin width amidst the two classes and it is represented in Eq. (17)
| 17 |
Finally, it gets the predicted outcomes from the optimized SVM through ASR-CHIO technique.
RNN [42] The suggested multi-disease prediction model uses optimized RNN by optimizing the hidden neuron count with ASR-CHIO algorithm. RNN is a neural network, and also, it is utilized for generating a set of statistics. Also, it performs well with time series data. Thus, the outcome attained is represented as unique while comparing with other existing approaches. “It is a recurrent approach and has an input sequence as that seeks to forecast a state at time ”. Using a differentiable function , assume that the previous state as and it does not hold statistics from the preceding step, but it can extract entire precedent state and it is explained in Eqs. (18) and (19)
| 18 |
| 19 |
Here, the terms , and represent the weight parameters that are distributed across all layers. This approach is trained for minimizing a loss function, and then, the error in a prediction is estimated with definite values. At training stage, the RNN technique is unfolded into recurrent phases. Then, is determined, where indicates the gradient of loss function based on output state at time and it is expressed in Eqs. (20), (21) and (22)
| 20 |
| 21 |
| 22 |
Finally, it gets the predicted outcomes from the optimized RNN through ASR-CHIO technique. The flow diagram of proposed EL-WRBM for multi-disease prediction approach is given in Fig. 2.
Fig. 2.

Flow diagram of proposed EL-WRBM for multi-disease prediction method
Hyperparameter Tuning in Ensemble Learning for Enhanced Multi-disease Prediction
Hyperparameter Tuning in Ensemble Learning
In the suggested approach, the ranking-based predicted outcomes are attained by the ensemble learning. The enhanced multi-disease prediction model uses ASR-CHIO algorithm for optimizing the parameters in ensemble model. The main scope of the enhanced multi-disease prediction method with ensemble learning method is to focus on maximizing the accuracy of predicted outcomes and it is formulated in Eq. (23)
| 23 |
The suggested multi-disease model uses EL-WRBM by optimizing the number of suitable hidden neuron count of DNN in a range of , maximum iteration of SVM in a range of , and hidden neuron count of RNN in a range of , respectively, with the help of ASR-CHIO. Accuracy is defined as “closeness of the measurements to a specific value”. As given in Eq. (24)
| 24 |
Here, term indicates a true positive, denotes a true negative, represents a false positive, and expresses a false negative. Finally, the outcome for the developed multi-disease prediction approach is obtained by considering the predicted output with maximum occurrences from three prediction approaches like DNN, SVM, and RNN. The solution encoding of suggested multi-disease prediction approach is given in Fig. 3.
Fig. 3.
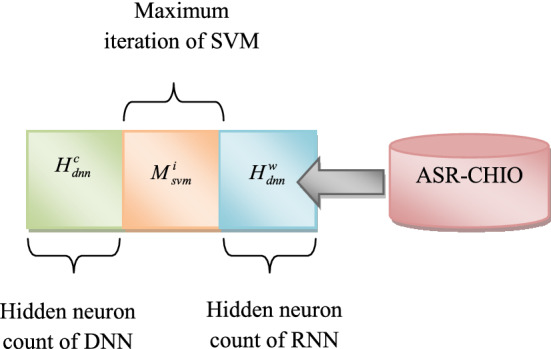
Solution encoding of proposed multi-disease prediction model
Proposed ASR-CHIO for Optimal Framework
The suggested method uses ASR-CHIO algorithm for optimizing the number of suitable hidden neuron count of DNN, the maximum iteration of SVM, and hidden neuron count of RNN. CHIO [43] is a new human-based optimization algorithm and it is derived from the concept of herd immunity for tackling COVID-19 pandemic. CHIO imitate the concepts of herd immunity technique and also the social distancing. It can be utilized for tackling various optimization problems. Using their stochastic based components, they can easily escape the local optima. However, it does not applicable for real-time optimization problems. To overcome this problem, GWO [44] is used. It is easy to implement due to its simple structure, less storage, and computational requirements. Thus, the hybridization of CHIO and GWO algorithm [40] is employed for enhancing the performance while predicting the multi-disease.
The proposed ASR-CHIO algorithm is performed based on the spreading rate, where if the spreading rate is greater than 0.5, then the solutions are updated by CHIO; otherwise, the solution is updated by GWO. In existing algorithm, the spreading rate is randomly determined. However, in the proposed ASR-CHIO algorithm, the new formula is proposed for calculating spreading rate using fitness function and it is formulated in Eqs. (25) and (26)
| 25 |
| 26 |
Here, the terms BF and WF denote the best fitness and worst fitness solutions, respectively. The CHIO algorithm has followed some condition and it is described below.
Step 1: Initialize the CHIO parameters and optimization crisis and it is expressed in Eq. (27)
| 27 |
Here, the term represents the immunity rate evaluated for the individual , where indicates the decision variable indexed by and the overall decision variable count in each individual is denoted as . Also, the range of each decision variable is given as . Here, the upper and lower bounds of decision variable are expressed as and , respectively. CHIO has two control parameters, namely, basic reproduction rate controls the CHIO operators by increasing the epidemic amidst individuals and maximum infected cases age verifies the infected cases position, where cases attained is healthier or died. Also, CHIO has four algorithmic parameters namely maximum iteration , problem dimensionality , population size , and count of initial infected cases .
Step 2: Initially, it generates the population of herd immunity, where CHIO arbitrarily produces a set of individuals as many as . In herd immunity population , the generated individuals are stored as two-dimensional vector of length .
Here, the each row denotes a case and it is generated as , where . The immunity rate is evaluated based on Eq. (16).
Step 3: Evolution of herd immunity: In CHIO, this is the major development loop. The decision variable of case is affected by means of social distancing using three policies based on proportion and it is expressed in Eq. (28)
| 28 |
Here, the term indicates an arbitrary number that lies in between . The three major rules are mentioned below.
Infected case: The new value of decision variable is affected by social distancing in a range of . It is attained by taking difference between decision variable taken from an infected case and present decision variable and it is given in Eqs. (29) and (30)
| 29 |
| 30 |
Here, the value of is arbitrarily selected from any infected case according to the status matrix like that .
Susceptible case: The new value of decision variable is affected by social distancing in a range of . It is attained by taking difference between decision variable taken from an infected case and present decision variable and it is expressed in Eqs. (31) and (32)
| 31 |
| 32 |
Immuned case The new value of decision variable is affected by social distancing in a range of . It is attained by taking difference between decision variable taken from an immuned case and present decision variable and it is expressed in Eqs. (33) and (34)
| 33 |
| 34 |
Here, the value of is spread from optimal immuned case according to the status vector, such that .
Step 4: Upgrade the population of herd immunity. The immunity rate of of every generated case is evaluated and the present case is returned by produced case , if better, like . If is fulfilled, then the age matrix is increased by 1.
According to the herd immune threshold, the status vector is upgraded and it is explained in Eq. (35)
| 35 |
Here, the term indicates the binary value, which is equal to 1. The mean values of the population immune rates are expressed as .
Step 5: Sometimes, the immunity rate of infected case presented is not enhanced for definite iteration count as specified by the parameter ; furthermore, this case is assumed died. Furthermore, it is reproduced by . Moreover, and are set to be 0.
Step 6: Stop condition in CHIO is repeated from step 3 to 6 until it meets the end condition that usually depends if the maximum iteration count is attained. Here, the overall immuned and susceptible cases will overlook the population. The infected cases are also vanished.
The proposed ASR-CHIO algorithm is performed based on the spreading rate, where the spreading rate is less than 0.5, and then, the solution will be updated in GWO. This algorithm was motivated by grey wolves. The GWO algorithm mimics the hunting method of grey wolves in nature. The hierarchy of each set of wolves is split in to four types.
Encircling prey During hunting, the prey is encircled by grey wolves and it is formulated in Eqs. (36) and (37)
| 36 |
| 37 |
Here, the position matrix of the prey is represented as , and the term and indicate the coefficient matrix and it is expressed in Eqs. (39) and (40)
| 38 |
| 39 |
Here, the arbitrary numbers are indicated as and that lie in between .
Hunting It is mainly controlled by alpha, subsequently the hunting made by delta and beta. For statistical experiment, the wolves hunting activities are referred as beta, alpha, and delta that have information relevant to the probable location of prey. Therefore, the first three optimal results attained are essential to save and generate the other candidates for updating the location with respect to optimal candidate position. The expression for hunting is mentioned below
| 40 |
| 41 |
| 42 |
| 43 |
| 44 |
| 45 |
| 46 |
Here, the term indicates the iteration count. The hunting method is done when the prey stops moving, and wolves start an attack. Thus, the spreading rate of the ASR-CHIO is determined in adaptive basis for determining the position updating by either CHIO or GWO and it gives best solutions. Thus, it increases the efficiency of multi-disease prediction. The pseudocode of implemented ASR-CHIO is mentioned in Algorithm 1.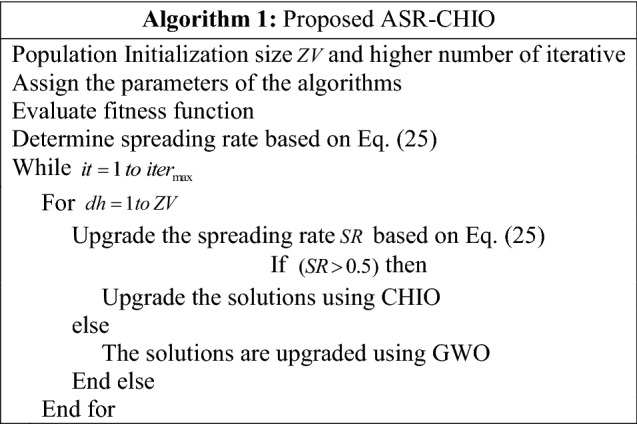
The flowchart of improved ASR-CHIO algorithm is shown in Fig. 4.
Fig. 4.
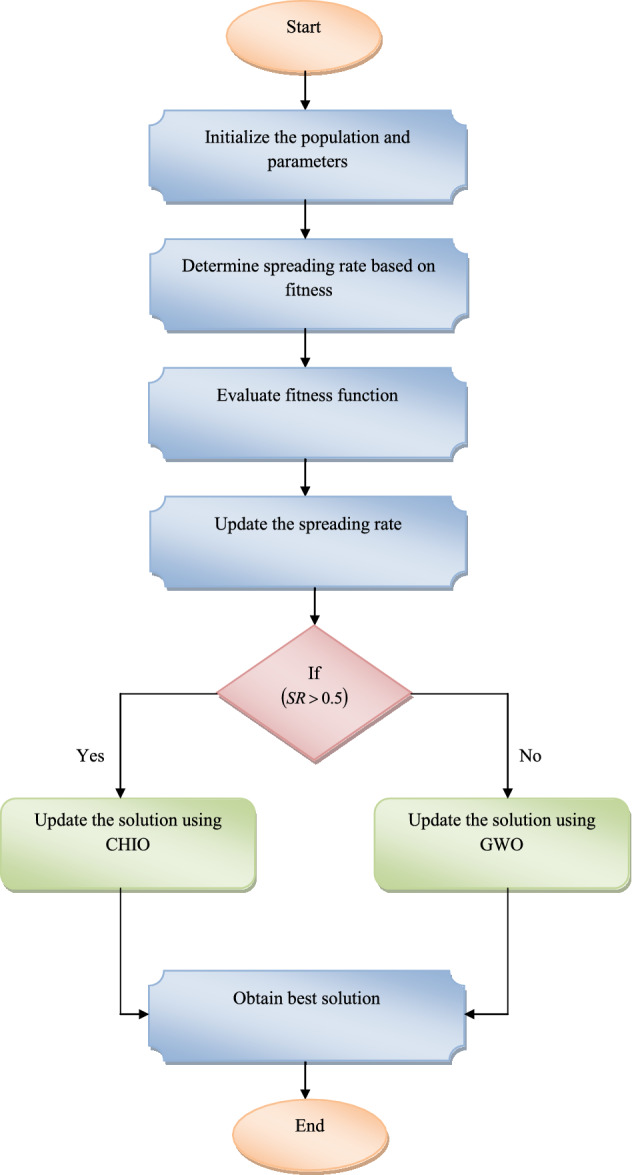
Flowchart of ASR-CHIO algorithm for multi-disease prediction model
Results
Evaluation of Simulation Results
The implemented multi-disease prediction method has been implemented in Python, and the experimental analysis was estimated. Here, the performance of the offered approach was compared with different conventional approaches based on Type I and Type II metrics. Here, Type I measures were positive metrics like Mathews correlation coefficient (MCC), F1-Score, Negative Predictive Value (NPV), Precision, Specificity, Sensitivity, and Accuracy, and Type II measures were negative metrics namely False Discovery Rate (FDR), False-negative rate (FNR), and False-positive rate (FPR). The performance of the suggested approach was evaluated with DNN [18], SVM [22], XGBoost [25], LSTM [23], Ensemble [26], PSO [45], Whale Optimization Algorithm-Jaya Algorithm (WOA-JA) [46], JA [47], and GWO [44].
Performance Metrics
The diverse efficiency of the implemented approach is examined by utilized various quantitative metrics.
(h) MCC is “a measure of the quality of binary (two-class) classifications" as shown in Eq. (47)
| 47 |
(g) F1-score is “the harmonic mean of precision and recall” as given in Eq. (48)
| 48 |
Here, the term is a F1-score.
(f) FDR is "the ratio of the number of false positive classifications to the total number of positive classifications" as shown in Eq. (49)
| 49 |
(e) FNR is "the proportion of positives which yield negative test outcomes with the test, i.e., the conditional probability of a negative test result given that the condition being looked for is present" as shown in Eq. (50)
| 50 |
(d) NPV is “the ratio of the number of true negative classifications to the total number of negative classifications” as given in Eq. (51)
| 51 |
(c) FPR is "the proportion of all negatives that still yield positive test outcomes, i.e., the conditional probability of a positive test result given an event that was not present" as shown in Eq. (52)
| 52 |
(b) Sensitivity refers to "the proportion of those who received a positive result on this test out of those who actually have the condition" as shown in Eq. (53)
| 53 |
Here, the term denotes Sensitivity.
(a) Specificity refers to "the proportion of those who received a negative result on this test out of those who do not actually have the condition" as shown in Eq. (54)
| 54 |
Here, the term is specificity.
(i) Precision is "the closeness of the measurements to each other". As shown in Eq. (55)
| 556 |
Here, the term is precision.
Algorithmic Evaluation over Optimization Algorithms
The analysis of the implemented multi-diseases prediction method is performed in terms of accuracy by testing the conventional optimization algorithms through differing the folds and learning percentages, and it is portrayed in Figs. 5, 6 and 7, respectively. In dataset 2, the accuracy of the suggested multi-disease prediction method has scored highest value, which is 0.42% enriched performance than PSO-EL-WRBM, 0.95% enriched performance than WOA-JA-EL-WRBM, 0.84% superior to JA-EL-WRBM, and 0.5% superior to GWO-EL-WRBM, respectively, at varying threefold at 1.00 value. In dataset 2, at varying fivefold of 2 value, the suggested multi-disease prediction model has obtained high accuracy, which is 0.7% improved than PSO-EL-WRBM, 0.8% improved than WOA-JA-EL-WRBM, 0.63% enhanced than JA-EL-WRBM, and 1.06% enhanced than GWO-EL-WRBM, respectively. In dataset 3, while considering accuracy at learning percentage of 35, the suggested multi-disease prediction model has performed well, which is 2.6% improved than PSO-EL-WRBM, 0.11% improved than WOA-JA-EL-WRBM, 0.22% improved than JA-EL-WRBM, and 2.6% improved than GWO-EL-WRBM, respectively. In dataset 5, at varying threefold of 1, the suggested multi-disease prediction method has correspondingly obtained high accuracy while evaluating with other traditional algorithms like PSO-EL-WRBM, WOA-JA-EL-WRBM, JA-EL-WRBM, and GWO-EL-WRBM. Therefore, the implemented multi-disease prediction model gives accurate performance.
Fig. 5.

Evaluation on implemented multi-disease prediction method with diverse existing optimization algorithms for accuracy by differing threefold concerning “a Dataset 1, b Dataset 2, c Dataset 3, d Dataset 4, e Dataset 5 and f Dataset 6”
Fig. 6.

Analysis on implemented multi-disease prediction method with diverse existing optimization algorithms for accuracy by varying fivefold concerning “a Dataset 1, b Dataset 2, c Dataset 3, d Dataset 4, e Dataset 5 and f Dataset 6”
Fig. 7.

Analysis on implemented multi-disease prediction method with diverse existing meta-heuristic algorithms for accuracy by varying learning percentage concerning “a Dataset 1, b Dataset 2, c Dataset 3, d Dataset 4, e Dataset 5 and f Dataset 6”
Performance Analysis over Other Prediction Models
The efficiency of the suggested multi-disease prediction method is analyzed and given in Figs. 8, 9 and 10. In dataset 1, the accuracy of the implemented multi-disease prediction model has attained maximum value, which is 4.4% enriched performance than DNN, 5.5% progressed than SVM, 2.2% enriched performance than XGBoost, 2.2% progressed than LSTM, 2.1% higher than LSTM–RNN, and 1.1% better than Ensemble, respectively, at varying threefold of 1. In dataset 2, at varying fivefold of 3, the suggested multi-disease prediction model has obtained high accuracy, which is 2.1% improved than DNN, 3.2% improved than SVM, 3.2% improved than XGBoost, 2.19% enhanced than LSTM, and 1.09% enhanced than LSTM–RNN, respectively. In dataset 5, while considering accuracy at learning percentage of 35, the suggested multi-disease prediction model has correspondingly achieved best performance, which is 2.6% enhanced than DNN, 0.11% enriched than SVM, 0.22% elevated performance than XGBoost, 2.6% enriched performance than LSTM, 2.8% elevated performance than LSTM–RNN, and 2.5% enriched performance than Ensemble. Thus, the developed multi-disease prediction approach reveals advance performance with diverse quantitative metrics than other baseline techniques.
Fig. 8.

Analysis on implemented multi-disease prediction method with different prediction methods for accuracy by varying threefold concerning “a Dataset 1, b Dataset 2, c Dataset 3, d Dataset 4, e Dataset 5 and f Dataset 6”
Fig. 9.

Analysis on implemented multi-disease prediction method with different prediction approaches for accuracy by varying fivefold concerning “a Dataset 1, b Dataset 2, c Dataset 3, d Dataset 4, e Dataset 5 and f Dataset 6”
Fig. 10.

Analysis on implemented multi-disease prediction method with different prediction models for accuracy by varying learning percentage concerning “a Dataset 1, b Dataset 2, c Dataset 3, d Dataset 4, e Dataset 5 and f Dataset 6”
Comparative Evaluation over Optimization Algorithms
Evaluation of performance on the offered multi-disease prediction method is estimated the traditional optimization algorithms and it is portrayed in Table 2. In dataset 1, the precision of the developed multi-disease prediction model has obtained maximum value, which is 1.1% advanced than PSO-EL-WRBM, 0.7% advanced than WOA-JA-EL-WRBM, 1.7% advanced than JA-EL-WRBM, and 1.3% advanced than GWO-EL-WRBM, respectively. In dataset 2, while considering MCC, the suggested multi-disease prediction model has achieved highest value, which is 1.16% better than PSO-EL-WRBM, 0.8% better than WOA-JA-EL-WRBM, 1.9% better than JA-EL-WRBM, and 1.35% better than GWO-EL-WRBM, respectively. In dataset 3, the specificity of the proposed multi-disease prediction method has obtained higher value, which is 0.61% enriched performance than PSO-EL-WRBM, 0.45% improved than WOA-JA-EL-WRBM, 0.9% progressed than JA-EL-WRBM, and 0.68% progressed than GWO-EL-WRBM, respectively. Thus, the developed multi-disease prediction model proves efficient performance with various quantitative metrics than other existing techniques.
Table 2.
Comparative analysis of multi-disease prediction model with different meta-heuristic algorithms
| TERMS | PSO-EL-WRBM [45] | WOA-JA-EL-WRBM [46] | JA-EL-WRBM [47] | GWO-EL-WRBM [44] | ASR-CHIO-EL-WRBM |
|---|---|---|---|---|---|
| Dataset 1 | |||||
| MCC | 85.155501 | 85.595915 | 84.509656 | 84.945289 | 86.377275 |
| F1-Score | 90.196078 | 90.483904 | 89.774030 | 90.058669 | 90.995191 |
| FDR | 12.669838 | 12.298030 | 13.172853 | 12.834088 | 11.655686 |
| NPV | 96.509816 | 96.613101 | 96.335235 | 96.453264 | 96.806240 |
| FNR | 6.743521 | 6.551892 | 7.072028 | 6.849982 | 6.189926 |
| FPR | 6.764813 | 6.551892 | 7.049215 | 6.857586 | 6.188405 |
| Precision | 87.330162 | 87.701970 | 86.827147 | 87.165912 | 88.344314 |
| Specificity | 93.235187 | 93.448108 | 92.950785 | 93.142414 | 93.811595 |
| Sensitivity | 93.256479 | 93.448108 | 92.927972 | 93.150018 | 93.810074 |
| Accuracy | 93.242284 | 93.448108 | 92.943180 | 93.144949 | 93.811088 |
| Dataset 2 | |||||
| MCC | 86.415733 | 86.723876 | 85.770467 | 86.251215 | 87.434403 |
| F1-Score | 92.556252 | 92.723247 | 92.204440 | 92.463276 | 93.108797 |
| FDR | 8.182084 | 7.983009 | 8.557636 | 8.220985 | 7.526409 |
| NPV | 94.477172 | 94.590948 | 94.204322 | 94.359980 | 94.855463 |
| FNR | 6.693440 | 6.559572 | 7.020675 | 6.842184 | 6.247211 |
| FPR | 6.770013 | 6.600460 | 7.084898 | 6.794235 | 6.212910 |
| Precision | 91.817916 | 92.016991 | 91.442364 | 91.779015 | 92.473592 |
| Specificity | 93.229987 | 93.399540 | 92.915102 | 93.205765 | 93.787090 |
| Sensitivity | 93.306560 | 93.440428 | 92.979325 | 93.157817 | 93.752789 |
| Accuracy | 93.264353 | 93.417891 | 92.943925 | 93.184246 | 93.771696 |
| Dataset 3 | |||||
| MCC | 80.877020 | 81.374946 | 80.138061 | 80.729688 | 82.398925 |
| Sensitivity | 93.165217 | 93.486957 | 92.947826 | 93.139130 | 93.791304 |
| Specificity | 93.239130 | 93.384783 | 92.921739 | 93.169565 | 93.815217 |
| Accuracy | 93.224348 | 93.405217 | 92.926957 | 93.163478 | 93.810435 |
| FNR | 6.834783 | 6.513044 | 7.052174 | 6.860870 | 6.208696 |
| Precision | 77.502894 | 77.939684 | 76.651129 | 77.318992 | 79.128457 |
| FDR | 22.497107 | 22.060316 | 23.348871 | 22.681008 | 20.871543 |
| F1-Score | 84.615385 | 85.008302 | 84.016506 | 84.494932 | 858.38208 |
| NPV | 98.200385 | 98.286277 | 98.137987 | 98.192316 | 98.372427 |
| FPR | 6.760870 | 6.615217 | 7.078261 | 6.830435 | 6.184783 |
| Dataset 4 | |||||
| MCC | 59.566585 | 59.934307 | 58.559462 | 58.795777 | 61.304260 |
| F1-Score | 57.354759 | 57.783313 | 56.272838 | 56.548348 | 59.287532 |
| Specificity | 93.252417 | 93.375849 | 92.984983 | 93.067270 | 93.746143 |
| FPR | 6.747583 | 6.624151 | 7.015018 | 6.932730 | 6.253857 |
| FNR | 6.827309 | 6.827309 | 72.28916 | 7.228916 | 6.425703 |
| NPV | 99.626374 | 99.626866 | 99.603350 | 99.603699 | 99.650120 |
| Precision | 41.428571 | 41.877256 | 40.384615 | 40.669014 | 43.389199 |
| F1-Score | 57.354759 | 57.783313 | 56.272838 | 56.548348 | 59.287532 |
| Sensitivity | 93.172691 | 93.172691 | 92.771084 | 92.771084 | 93.574297 |
| Accuracy | 93.248532 | 93.365949 | 92.974560 | 93.052838 | 93.737769 |
| FDR | 59.566585 | 59.934307 | 58.559462 | 58.795777 | 61.304260 |
| Dataset 5 | |||||
| F1-Score | 93.545817 | 93.535515 | 93.216281 | 93.216281 | 94.014366 |
| FNR | 6.677266 | 6.836248 | 7.154213 | 7.154213 | 6.359301 |
| Specificity | 93.048128 | 93.226382 | 92.869875 | 92.869875 | 93.761141 |
| FDR | 6.230032 | 6.089744 | 6.410256 | 6.410256 | 5.608974 |
| NPV | 92.553192 | 92.402827 | 92.049470 | 92.049470 | 92.932862 |
| Accuracy | 93.193277 | 93.193277 | 92.857143 | 92.857143 | 93.697479 |
| Sensitivity | 93.0322735 | 93.163752 | 92.845787 | 92.845787 | 93.640700 |
| MCC | 86.347008 | 86.351600 | 85.677429 | 85.677429 | 87.362855 |
| Precision | 93.769968 | 93.910256 | 93.589744 | 93.589744 | 94.391026 |
| FPR | 6.951872 | 6.773619 | 7.130125 | 7.130125 | 6.238859 |
| Dataset 6 | |||||
| Sensitivity | 92.962357 | 93.126023 | 92.635025 | 92.962357 | 93.780687 |
| NPV | 92.110092 | 92.321755 | 91.788321 | 92.110092 | 93.001842 |
| FDR | 6.270627 | 5.794702 | 6.135987 | 6.270627 | 5.756579 |
| FPR | 7.037037 | 6.481482 | 6.851852 | 7.037037 | 6.481482 |
| FNR | 7.037643 | 6.873977 | 7.364976 | 7.037643 | 6.219313 |
| F1-Score | 93.344289 | 93.662551 | 93.245470 | 93.344289 | 94.011485 |
| Accuracy | 92.962641 | 93.310165 | 92.875760 | 92.962641 | 93.657689 |
| MCC | 85.882382 | 86.585777 | 85.717729 | 85.882382 | 87.272230 |
| Specificity | 92.962963 | 93.518519 | 93.148148 | 92.962963 | 93.518519 |
| Precision | 93.729373 | 94.205298 | 93.864013 | 93.729373 | 94.243421 |
Comparative Analysis over Other Prediction Models
The analysis of the offered multi-disease prediction approach is employed by estimating the diverse prediction approaches and it is depicted in Table 3. In dataset 1, the accuracy of the developed multi-disease prediction technique has obtained maximum value, which is 1.5% superior to DNN, 2.6% progressed than SVM, 1.1% enhanced performance than XGBoost, 2.2% higher than LSTM, 1.61% enhanced than LSTM–RNN, and 1.41% higher than Ensemble, respectively. In dataset 2, while considering F1-score, the suggested multi-disease prediction model has achieved highest value, which is 1.6% improved performance than DNN, 2.9% improved performance than SVM, 1.07% improved performance than XGBoost, 2.4% improved performance than LSTM, 1.64% improved performance than LSTM–RNN, and 1.48% improved performance than Ensemble, respectively. In dataset 3, the sensitivity of the proposed multi-disease prediction method has correspondingly obtained maximum value, which is 1.65% superior to DNN, 2.69% superior to SVM, 1.04% superior to XGBoost, 2.1% superior to LSTM, 1.55% enhanced than LSTM–RNN, and 1.39% enriched than Ensemble. Thus, the implemented multi-disease prediction model provides optimal results with various quantitative metrics than other conventional techniques.
Table 3.
Comparative analysis of multi-disease prediction model with different prediction models
| TERMS | DNN [18] | SVM [22] | XGBOOST [25] | LSTM [23] | LSTM–RNN [20] | ENSEMBLE [26] | ASR-CHIO-EL-WRBM |
|---|---|---|---|---|---|---|---|
| Dataset 1 | |||||||
| Accuracy | 0.92319625 | 0.91303686 | 0.92863082 | 0.91688972 | 0.92300361 | 0.92485907 | 0.93811088 |
| FDR | 0.14259076 | 0.16016335 | 0.13321598 | 0.15327770 | 0.14286925 | 0.13966322 | 0.11655686 |
| FNR | 0.07689500 | 0.08671980 | 0.07138946 | 0.08340431 | 0.07716876 | 0.07531330 | 0.06189926 |
| Precision | 0.85740924 | 0.83983665 | 0.86678402 | 0.84672230 | 0.85713075 | 0.86033678 | 0.88344314 |
| FPR | 0.07675812 | 0.08708480 | 0.07135905 | 0.08296326 | 0.07691021 | 0.07505475 | 0.06188405 |
| Sensitivity | 0.92310500 | 0.91328020 | 0.92861054 | 0.91659569 | 0.92283125 | 0.92468670 | 0.93810074 |
| Specificity | 0.92324188 | 0.91291520 | 0.92864095 | 0.91703674 | 0.92308979 | 0.92494525 | 0.93811595 |
| F1-Score | 0.88904513 | 0.87502004 | 0.89663274 | 0.88027459 | 0.88876846 | 0.89135184 | 0.90995191 |
| MCC | 0.83176284 | 0.81018974 | 0.84339840 | 0.81828770 | 0.83133917 | 0.83530372 | 0.86377275 |
| NPV | 0.96002088 | 0.95465751 | 0.96298516 | 0.95650312 | 0.95987791 | 0.96088035 | 0.96806240 |
| Dataset 2 | |||||||
| Precision | 0.907762023 | 0.894736842 | 0.912916423 | 0.899664086 | 0.908185679 | 0.909609478 | 0.924735915 |
| FPR | 0.076420007 | 0.087440959 | 0.07218118 | 0.083202132 | 0.07593557 | 0.074845586 | 0.062129103 |
| F1-Score | 0.915659098 | 0.903696068 | 0.921058451 | 0.907885041 | 0.915289256 | 0.917256637 | 0.931087968 |
| MCC | 0.846002514 | 0.823985702 | 0.85584887 | 0.831746687 | 0.845417419 | 0.848950954 | 0.874344031 |
| NPV | 0.936970144 | 0.927841399 | 0.941617502 | 0.930775851 | 0.936081462 | 0.938106349 | 0.94855463 |
| FDR | 0.092237977 | 0.105263158 | 0.087083577 | 0.100335914 | 0.091814321 | 0.090390522 | 0.075264085 |
| Sensitivity | 0.923694779 | 0.912836531 | 0.929347018 | 0.916257623 | 0.922504834 | 0.925033467 | 0.937527889 |
| Specificity | 0.923579993 | 0.912559041 | 0.92781882 | 0.916797868 | 0.92406443 | 0.925154414 | 0.937870897 |
| Accuracy | 0.923631509 | 0.912683578 | 0.928504673 | 0.916555407 | 0.923364486 | 0.925100134 | 0.937716956 |
| FNR | 0.076305221 | 0.087163469 | 0.070652982 | 0.083742377 | 0.077495166 | 0.074966533 | 0.062472111 |
| Dataset 3 | |||||||
| NPV | 0.9794059 | 0.9766301 | 0.9810095 | 0.9781444 | 0.9796493 | 0.9801096 | 0.9837243 |
| FDR | 0.2497524 | 0.2760072 | 0.2350201 | 0.2667546 | 0.2501412 | 0.2436353 | 0.2087154 |
| Specificity | 0.9232391 | 0.9130217 | 0.9287174 | 0.9165000 | 0.9230000 | 0.9255217 | 0.9381522 |
| MCC | 0.7854842 | 0.7605627 | 0.7994792 | 0.7705301 | 0.7857390 | 0.7913857 | 0.8239893 |
| Accuracy | 0.9230609 | 0.9129391 | 0.9285913 | 0.9168174 | 0.9230609 | 0.9253913 | 0.9381043 |
| FNR | 0.0776522 | 0.0873913 | 0.0719130 | 0.0819130 | 0.0766957 | 0.0751304 | 0.0620870 |
| Precision | 0.7502476 | 0.7239928 | 0.7649799 | 0.7332454 | 0.7498588 | 0.7563647 | 0.7912846 |
| FPR | 0.0767609 | 0.0869783 | 0.0712826 | 0.0835000 | 0.0770000 | 0.0744783 | 0.0618478 |
| F1-Score | 0.8274436 | 0.8074319 | 0.8386767 | 0.8153211 | 0.8275916 | 0.8321728 | 0.8583821 |
| Sensitivity | 0.9223478 | 0.9126087 | 0.9280870 | 0.9180870 | 0.9233043 | 0.9248696 | 0.9379130 |
| Dataset 4 | |||||||
| MCC | 0.5685109 | 0.5272423 | 0.5878882 | 0.5449743 | 0.5685915 | 0.5730059 | 0.6130426 |
| Specificity | 0.9245011 | 0.9115408 | 0.9298498 | 0.9170952 | 0.9236783 | 0.9253240 | 0.9374614 |
| FDR | 0.6147404 | 0.6554878 | 0.5951134 | 0.6386688 | 0.6162791 | 0.6111111 | 0.5661080 |
| F1-Score | 0.5437352 | 0.4994475 | 0.5644769 | 0.5181818 | 0.5428907 | 0.5480427 | 0.5928753 |
| FPR | 0.0754989 | 0.0884592 | 0.0701502 | 0.0829048 | 0.0763217 | 0.0746760 | 0.0625386 |
| FNR | 0.0763052 | 0.0923695 | 0.0682731 | 0.0843373 | 0.0722892 | 0.0722892 | 0.0642570 |
| NPV | 0.9957899 | 0.9948361 | 0.9962530 | 0.9953115 | 0.9960071 | 0.9960142 | 0.9965012 |
| Accuracy | 0.9244618 | 0.9113503 | 0.9299413 | 0.9170254 | 0.9238748 | 0.9254403 | 0.9373777 |
| Sensitivity | 0.9236948 | 0.9076305 | 0.9317269 | 0.9156627 | 0.9277108 | 0.9277108 | 0.9357430 |
| Precision | 0.3852596 | 0.3445122 | 0.4048866 | 0.3613312 | 0.3837209 | 0.3888889 | 0.4338920 |
| Dataset 5 | |||||||
| Accuracy | 0.92352941 | 0.91176471 | 0.92689076 | 0.91512605 | 0.92100840 | 0.92352941 | 0.93697479 |
| Sensitivity | 0.92368839 | 0.91096979 | 0.92845787 | 0.91414944 | 0.92050874 | 0.92368839 | 0.93640700 |
| FDR | 0.06891026 | 0.07877814 | 0.06709265 | 0.07556270 | 0.07062600 | 0.06891026 | 0.05608974 |
| F1-Score | 0.92737430 | 0.91606715 | 0.93067729 | 0.91926459 | 0.92492013 | 0.92737430 | 0.94014366 |
| MCC | 0.84666174 | 0.82312789 | 0.85335580 | 0.82986853 | 0.84163386 | 0.84666174 | 0.87362855 |
| Specificity | 0.92335116 | 0.91265597 | 0.92513369 | 0.91622103 | 0.92156863 | 0.92335116 | 0.93761141 |
| NPV | 0.91519435 | 0.90140845 | 0.92021277 | 0.90492958 | 0.91181658 | 0.91519435 | 0.92932862 |
| FPR | 0.07664884 | 0.08734403 | 0.07486631 | 0.08377897 | 0.07843137 | 0.07664884 | 0.06238859 |
| FNR | 0.07631161 | 0.08903021 | 0.07154213 | 0.08585056 | 0.07949126 | 0.07631161 | 0.06359300 |
| Precision | 0.93108974 | 0.92122186 | 0.93290735 | 0.92443730 | 0.92937400 | 0.93108974 | 0.94391026 |
| Dataset 6 | |||||||
| Precision | 0.9308072488 | 0.9195402299 | 0.9372937294 | 0.9270315091 | 0.9323432343 | 0.9369817579 | 0.9424342105 |
| FPR | 0.0777777778 | 0.0907407407 | 0.0703703704 | 0.0814814815 | 0.0759259259 | 0.0703703704 | 0.0648148148 |
| Specificity | 0.9222222222 | 0.9092592593 | 0.9296296296 | 0.9185185185 | 0.9240740741 | 0.9296296296 | 0.9351851852 |
| MCC | 0.8465920461 | 0.8256168952 | 0.8588238149 | 0.8327763243 | 0.8483635055 | 0.8536914344 | 0.8727223013 |
| FNR | 0.0752864157 | 0.0834697218 | 0.0703764321 | 0.0851063830 | 0.0752864157 | 0.0752864157 | 0.0621931260 |
| Accuracy | 0.9235447437 | 0.9131190269 | 0.9296264118 | 0.9165942659 | 0.9244135534 | 0.9270199826 | 0.9365768897 |
| Sensitivity | 0.9247135843 | 0.9165302782 | 0.9296235679 | 0.9148936170 | 0.9247135843 | 0.9247135843 | 0.9378068740 |
| FDR | 0.0691927512 | 0.0804597701 | 0.0627062706 | 0.0729684909 | 0.0676567657 | 0.0630182421 | 0.0575657895 |
| F1-Score | 0.9277504105 | 0.9180327869 | 0.9334428924 | 0.9209225700 | 0.9285127362 | 0.9308072488 | 0.9401148482 |
| NPV | 0.9154411765 | 0.9059040590 | 0.9211009174 | 0.9051094891 | 0.9155963303 | 0.9160583942 | 0.9300184162 |
Statistical Analysis Using Deep Learning and 2-Tier Classifier Ensemble Learning Models
Statistical analysis of the implemented multi-diseases prediction method with various deep learning and 2-tier classifier ensemble learning methods is shown in Fig. 11. From Fig. 11, in dataset 1, the accuracy concerning with the best values of the implemented multi-disease prediction method is correspondingly obtained 3.43%, 5.4%, 2.2%, and 2.5% progressed performance than CNN, DBN, AlexNet-CNN, and RF-GBM-XGBoost at learning percentage 35. Accordingly, in dataset 4, the accuracy concerning with the median values of the implemented multi-disease prediction method is correspondingly secured 2.43%, 3.4%, 5.2%, and 1.5% superior efficiency to CNN, DBN, AlexNet-CNN, and RF-GBM-XGBoost at learning percentage 55. In dataset 6, while taking accuracy at learning percentage of 75, the accuracy concerning with the mean values of the implemented multi-disease prediction model correspondingly attains 1.33%, 5.46%, 8.3%, and 4.51% elevated performance than CNN, DBN, AlexNet-CNN, and RF-GBM-XGBoost. Hence, the implemented multi-disease prediction approach proves enriched performance while comparing the other deep learning and 2-tier classifier ensemble learning methods.
Fig. 11.

Statistical evaluation on implemented multi-disease prediction method with various deep learning and 2-tier classifier ensemble learning models for accuracy by differing learning percentage concerning “a Dataset 1, b Dataset 2, c Dataset 3, d Dataset 4, e Dataset 5 and f Dataset 6”
Conclusion
This paper has designed a novel multi-disease prediction method with weighted RBM features and ensemble learning. Initially, the data were gathered related to COVID-19 prediction, EEG eye state, Epileptic Seizure Recognition, Stroke prediction, Heart-statlog, and Diabetic Retinopathy Debrecen. Then, the collected data were pre-processed by missing data filling technique. After pre-processing the data, the weighted features were extracted from the RBM layers of DBN. Then, the prediction was done by ensemble learning with prediction models, namely, RNN, SVM, and DNN, from which hyper-parameters are optimized by ASR-CHIO. Finally, the experimental setup have revealed that the accuracy of the improved multi-disease prediction approach has obtained maximum value, which was 1.5% enriched performance than DNN, 2.6% elevated performance than SVM, 1.1% progressed than XGBoost, 2.2% enriched performance than LSTM, 1.61% progressed than LSTM–RNN, and 1.41% progressed than Ensemble-DNN–SVM–RNN, respectively. Thus, the suggested method attains an elevated performance while comparing with other existing techniques. However, in dataset 6, the accuracy of the suggested model has comparatively equal to Ensemble-DNN–SVM–RNN. To overcome this problem, the suggested multi-disease prediction model needs to be improved in future work using advanced techniques to be supported for all disease in accurate way.
Footnotes
Publisher's Note
Springer Nature remains neutral with regard to jurisdictional claims in published maps and institutional affiliations.
Contributor Information
A. S. Prakaash, Email: prakaashphd333@gmail.com
K. Sivakumar, Email: sivakumarkaliappan.sse@saveetha.com
B. Surendiran, Email: surendiran@gmail.com
S. Jagatheswari, Email: jaga.sripa@gmail.com
K. Kalaiarasi, Email: kalaishruthi12@gmail.com
References
- 1.Gupta V, Sachdeva S, Bhalla S. A novel deep similarity learning approach to electronic health records data. IEEE Access. 2020;8:209278–209295. doi: 10.1109/ACCESS.2020.3037710. [DOI] [Google Scholar]
- 2.Huang Z, Dong W, Duan H, Liu J. A regularized deep learning approach for clinical risk prediction of acute coronary syndrome using electronic health records. IEEE Trans. Biomed. Eng. 2018;65(5):956–968. doi: 10.1109/TBME.2017.2731158. [DOI] [PubMed] [Google Scholar]
- 3.Gangavarapu T, Krishnan GS, Jeganathan SKSJ. FarSight: long-term disease prediction using unstructured clinical nursing notes. IEEE Trans. Emerg. Top. Comput. 2021;9(3):1151–1169. doi: 10.1109/TETC.2020.2975251. [DOI] [Google Scholar]
- 4.Davagdorj K, Bae J-W, Pham V-H, Theera-Umpon N, Ryu KH. Explainable artificial intelligence based framework for non-communicable diseases prediction. IEEE Access. 2021;9:123672–123688. doi: 10.1109/ACCESS.2021.3110336. [DOI] [Google Scholar]
- 5.Ali SA, et al. An optimally configured and improved deep belief network (OCI-DBN) approach for heart disease prediction based on Ruzzo-Tompa and stacked genetic algorithm. IEEE Access. 2020;8:65947–65958. doi: 10.1109/ACCESS.2020.2985646. [DOI] [Google Scholar]
- 6.Hong W, Xiong Z, Zheng N, Weng Y. A medical-history-based potential disease prediction algorithm. IEEE Access. 2019;7:131094–131101. doi: 10.1109/ACCESS.2019.2940644. [DOI] [Google Scholar]
- 7.Wang K, Zhang X, Huang S, Chen F, Zhang X, Huangfu L. Learning to recognize thoracic disease in chest X-rays with knowledge-guided deep zoom neural networks. IEEE Access. 2020;8:159790–159805. doi: 10.1109/ACCESS.2020.3020579. [DOI] [Google Scholar]
- 8.Shuvo SB, Ali SN, Swapnil SI, Al-Rakhami MS, Gumaei A. CardioXNet: a novel lightweight deep learning framework for cardiovascular disease classification using heart sound recordings. IEEE Access. 2021;9:36955–36967. doi: 10.1109/ACCESS.2021.3063129. [DOI] [Google Scholar]
- 9.Song Q, Zheng Y-J, Sheng W-G, Yang J. Tridirectional transfer learning for predicting gastric cancer morbidity. IEEE Trans. Neural Netw. Learn. Syst. 2021;32(2):561–574. doi: 10.1109/TNNLS.2020.2979486. [DOI] [PubMed] [Google Scholar]
- 10.Prakaash AS, Sivakumar K. Data analytics and predictive modelling in the application of big data: a systematic review. J. Adv. Res. Dyn. Control Syst. 2019;11:395–399. doi: 10.5373/JARDCS/V11SP11/20193047. [DOI] [Google Scholar]
- 11.Wang Z, Li L, Yan J, Yao Y. Approaching high-accuracy side effect prediction of traditional Chinese medicine compound prescription using network embedding and deep learning. IEEE Access. 2020;8:82493–82499. doi: 10.1109/ACCESS.2020.2991750. [DOI] [Google Scholar]
- 12.Shanmuga Priya, S., Saran Raj, S., Surendiran, B., Arulmurugaselvi, N.: Brain tumour detection in MRI using deep learning. In: Advances in Intelligent Systems and Computing, pp. 395–403 (2021)
- 13.Tang SJ, Wang CJ, Nie JT, Kumar N, Zhang Y, Xiong ZH, Barnawi A, et al. EDL-COVID: ensemble deep learning for COVID-19 case detection from chest X-ray images. IEEE Trans. Ind. Inf. 2021;17(9):6539–6549. doi: 10.1109/TII.2021.3057683. [DOI] [PMC free article] [PubMed] [Google Scholar]
- 14.Prakaash AS, Sivakumar K. A precipitation prediction model exploitation artificial neural network. J. Adv. Res. Dyn. Control Syst. 2018;12:626–633. [Google Scholar]
- 15.Li G, Luo J, Xiao Q, Liang C, Ding P, Cao B. Predicting microRNA-disease associations using network topological similarity based on DeepWalk. IEEE Access. 2017;5:24032–24039. doi: 10.1109/ACCESS.2017.2766758. [DOI] [Google Scholar]
- 16.Amarbayasgalan T, Pham V-H, Theera-Umpon N, Piao Y, Ryu KH. An efficient prediction method for coronary heart disease risk based on two deep neural networks trained on well-ordered training datasets. IEEE Access. 2021;9:135210–135223. doi: 10.1109/ACCESS.2021.3116974. [DOI] [Google Scholar]
- 17.Raj RJS, Shobana SJ, Pustokhina IV, Pustokhin DA, Gupta D, Shankar K. Optimal feature selection-based medical image classification using deep learning model in internet of medical things. IEEE Access. 2020;8:58006–58017. doi: 10.1109/ACCESS.2020.2981337. [DOI] [Google Scholar]
- 18.Sadr H, Pedram MM, Teshnehlab M. Multi-View deep network: a deep model based on learning features from heterogeneous neural networks for sentiment analysis. IEEE Access. 2020;8:86984–86997. doi: 10.1109/ACCESS.2020.2992063. [DOI] [Google Scholar]
- 19.Prakaash AS, Sivakumar K. Optimized recurrent neural network with fuzzy classifier for data prediction using hybrid optimization algorithm: scope towards diverse applications. Int. J. Wavel. Multiresolut. Inf. Process. 2021;19(02):2050074. doi: 10.1142/S0219691320500745. [DOI] [Google Scholar]
- 20.Wang T, Tian Y, Qiu RG. Long short-term memory recurrent neural networks for multiple diseases risk prediction by leveraging longitudinal medical records. IEEE J. Biomed. Health Inf. 2020;24(8):2337–2346. doi: 10.1109/JBHI.2019.2962366. [DOI] [PubMed] [Google Scholar]
- 21.Dubey, A.K.: Optimized hybrid learning for multi disease prediction enabled by lion with butterfly optimization algorithm. Sādhanā 46(63), (2021)
- 22.Harimoorthy K, Thangavelu M. Multi-disease prediction model using improved SVM-radial bias technique in healthcare monitoring system. J. Ambient Intell. Humaniz. Comput. 2021;12:3715–3723. doi: 10.1007/s12652-019-01652-0. [DOI] [Google Scholar]
- 23.Men L, Ilk N, Tang X, Liu Y. Multi-disease prediction using LSTM recurrent neural networks. Expert Syst. Appl. 2021;177:114905. doi: 10.1016/j.eswa.2021.114905. [DOI] [Google Scholar]
- 24.Mohan S, Thirumalai C, Srivastava G. Effective heart disease prediction using hybrid machine learning techniques. IEEE Access. 2019;7:81542–81554. doi: 10.1109/ACCESS.2019.2923707. [DOI] [Google Scholar]
- 25.Fitriyani NL, Syafrudin M, Alfian G, Rhee J. HDPM: an effective heart disease prediction model for a clinical decision support system. IEEE Access. 2020;8:133034–133050. doi: 10.1109/ACCESS.2020.3010511. [DOI] [Google Scholar]
- 26.Fitriyani NL, Syafrudin M, Alfian G, Rhee J. Development of disease prediction model based on ensemble learning approach for diabetes and hypertension. IEEE Access. 2019;7:144777–144789. doi: 10.1109/ACCESS.2019.2945129. [DOI] [Google Scholar]
- 27.El-Hasnony IM, Barakat SI, Mostafa RR. Optimized ANFIS model using hybrid metaheuristic algorithms for Parkinson’s disease prediction in IoT environment. IEEE Access. 2020;8:119252–119270. doi: 10.1109/ACCESS.2020.3005614. [DOI] [Google Scholar]
- 28.Tama BA, Lim S. A comparative performance evaluation of classification algorithms for clinical decision support systems. Mathematics. 1814;8(10):2020. [Google Scholar]
- 29.Tama, B.A., Im, S. and Lee, S.: Improving an intelligent detection system for coronary heart disease using a two-tier classifier ensemble. BioMed Res. Int. (2020) [DOI] [PMC free article] [PubMed]
- 30.Ramesh, D., Jose, D., Keerthana, R., Krishnaveni, V.: Detection of pulmonary nodules using thresholding and fractal analysis. In: Computational Vision and Bio Inspired Computing, pp.937–946 (2018)
- 31.Tabjula, J., Kalyani, S., Rajagopal, P., Srinivasan, B.: Statistics-based baseline-free approach for rapid inspection of delamination in composite structures using ultrasonic guided waves. Struct. Health Monit. (2021)
- 32.Illuri B, Jose D. Design and implementation of hybrid integration of cognitive learning and chaotic countermeasures for side channel attacks. J. Ambient Intell. Humaniz. Comput. 2021;12:5427–5441. doi: 10.1007/s12652-020-02030-x. [DOI] [Google Scholar]
- 33.Jose D, Kumar PN, Shirley JA, Ghayathrrie S. Implementation of genetic algorithm framework for fault-tolerant system on chip. Int. Inf. Inst. (Tokyo) 2014;17(8):3921–3945. [Google Scholar]
- 34.Menaga D, Revathi S. Probabilistic principal component Analysis (PPCA) based dimensionality reduction and deep learning for cancer classification. Intell. Comput. Appl. 2020;1172:353–368. [Google Scholar]
- 35.Nawar, N., El-Gayar, O., Ambati, L.S., Bojja, G.R.: Social media for exploring adverse drug events associated with multiple sclerosis. Hawaii International Conference on System Sciences (HICSS), In: Proceedings of the 55th Hawaii International Conference on System Sciences, pp. 4217–4226 (2022)
- 36.Bojja, G.R., Ofori, M., Liu, J., Ambati, L.S.: Early public outlook on the coronavirus disease (COVID-19): a social media study. In: Social Media Analysis on Coronavirus (COVID-19), (2020)
- 37.Murthy MYB, Koteswararao A, Babu MS. Adaptive fuzzy deformable fusion and optimized CNN with ensemble classification for automated brain tumor diagnosis. Biomed. Eng. Lett. 2022;12(1):37–58. doi: 10.1007/s13534-021-00209-5. [DOI] [PMC free article] [PubMed] [Google Scholar]
- 38.Ambati, L.S., Narukonda, K., Bojja, G.R., Bishop, D.: Factors influencing the adoption of artificial intelligence in organizations-from an employee's perspective. In: Adoption of AI in organization from employee perspective (2020)
- 39.Noor MN, Yahaya AS, Ramli NA, Al Bakri AMM. Filling missing data using interpolation methods: study on the effect of fitting distribution. Key Eng. Mater. 2013;594-595:889–895. doi: 10.4028/www.scientific.net/KEM.594-595.889. [DOI] [Google Scholar]
- 40.Noor MN, Yahaya AS, Ramli NA, Bakri AM. Filling Missing Data Using Interpolation Methods: Study On The Effect Of Fitting Distribution. Key Eng. Mater. 2014;594–595:889–895. [Google Scholar]
- 41.Tabjula JL, Kanakambaran S, Kalyani S, Rajagopal P, Srinivasan B. Outlier analysis for defect detection using sparse sampling in guided wave structural health monitoring. Struct. Control Health Monit. 2021;28:e2690. doi: 10.1002/stc.2690. [DOI] [Google Scholar]
- 42.Vaisakh T, Jayabarathi R. Analysis on intelligent machine learning enabled with meta-heuristic algorithms for solar irradiance prediction. Evol. Intell. 2020;15:235–254. doi: 10.1007/s12065-020-00505-6. [DOI] [Google Scholar]
- 43.Al-Betar MA, Alyasseri ZAA, Awadallah MA, Doush IA. Coronavirus herd immunity optimizer (CHIO) Neural Comput. Appl. 2021;33:5011–5042. doi: 10.1007/s00521-020-05296-6. [DOI] [PMC free article] [PubMed] [Google Scholar]
- 44.Mirjalili S, Mirjalili SM, Lewis A. Grey wolf optimizer. Adv. Eng. Softw. 2014;69:46–61. doi: 10.1016/j.advengsoft.2013.12.007. [DOI] [Google Scholar]
- 45.Dubey AK, Kumar A, Agrawal R. An efficient ACO-PSO-based framework for data classification and preprocessing in big data. Evol. Intell. 2021;14:909–922. doi: 10.1007/s12065-020-00477-7. [DOI] [Google Scholar]
- 46.Sudha I, Nedunchelian R. A secure data protection technique for healthcare data in the cloud using homomorphic encryption and Jaya-Whale optimization algorithm. Int. J. Model. Simul. Sci. Comput. 2019;10(06):1950040. doi: 10.1142/S1793962319500405. [DOI] [Google Scholar]
- 47.Venkata Rao R. Jaya: a simple and new optimization algorithm for solving constrained and unconstrained optimization problems. Int. J. Ind. Eng. Comput. 2016;7:19–34. [Google Scholar]