

Dear Editor
Aberrant gene expression sustains massive proliferation and stress adaptation under the regulation of oncogenic transcription factors (TFs) whose binding across the genome orchestrates in space and time transcription. Transcriptional dependency defines the addiction of cancer cells to TFs on top of the regulatory hierarchy governing cancer dysregulated programs [1]. These factors and their dependent mechanisms are an attractive and unexplored reservoir of potential targets for new anticancer drugs. Still, while the transcriptional landscape of many cancer‐supportive TFs has been revealed, this information remains purely descriptive and confined to in vitro models. To foster transferability, new approaches that integrate clinical data into the transcriptional networks are needed.
The runt‐related transcription factor 2 (RUNX2) is necessary for skeletal development and organ morphogenesis. Many studies have linked RUNX2 de‐regulation with tumor progression, metastasis, and therapy resistance [2, 3]. However, while many RUNX2 targets have been identified, a model explaining how this TF promotes cancer progression is still lacking.
In this work, we propose an integrated network‐based approach that combines different layers of omics information with patient‐derived clinical data to model the hierarchy underlying the transcriptional dependency of thyroid cancer to RUNX2. Mining the intrinsic structure of this interactome, we derived specific modules whose transcriptional modulation is translated into relevant cancer supporting pathways.
For the analysis, all sources were managed using specific integrative bioinformatics pipelines, applying both stringent quality criteria and statistical thresholds to control the noisiness and heterogeneity of both sequencing and clinical data (Supplementary Materials and Methods).
To map RUNX2 genomic occupancy, chromatin immunoprecipitation‐sequencing (ChIP‐Seq) was performed in TPC1 cell line. In addition, distribution of histone 3 acetyl‐lysine 27 (H3K27ac), RNA‐polymeraseII (RNA‐PolII), histone 3 mono‐methyl lysine 4 (H3K4me1), and histone 3 trimethyl lysine 4 (H3K4me3) was investigated by ChIP‐Seq.
We identified 28,128 RUNX2 peaks, of which 77.0% (21,655) were also enriched for H3K27ac. H3K4me1 and H3K4me3 had a comparable distribution covering 72.2% and 66.8% of these regions. RNA‐PolII was present in about 70.3% and 89.7% of the obtained lists. Peak‐to‐target assignment identified 8410 genes associated with RUNX2‐dependent promoters and 5930 genes associated with RUNX2‐dependent putative enhancers (ENHs) (Figure 1A).
FIGURE 1.
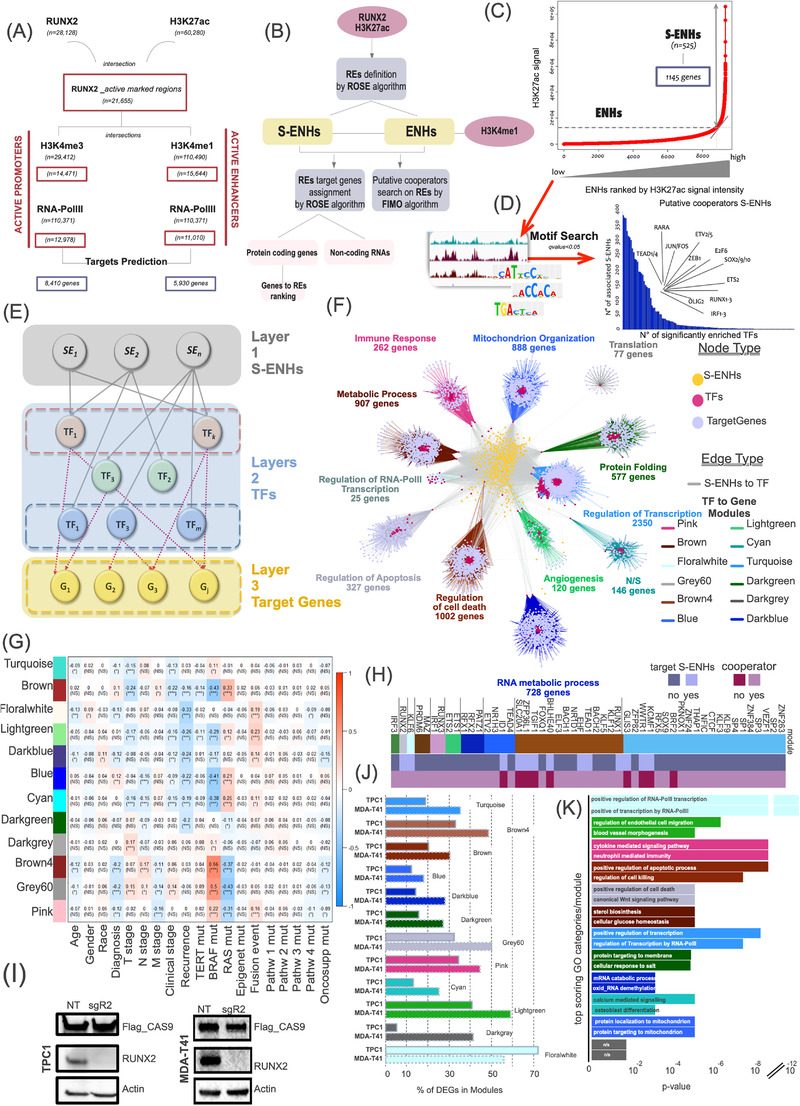
RUNX2 multi‐layered hierarchical network. (A) Work‐flow of the pipeline used to identify RUNX2 regulative elements (REs) and their putative target genes and TF cooperators. (B) Schematic representation of ChIP‐seq profile integration and target gene prediction. (C) Ranking of super‐enhancers and classical enhancers based on their input‐normalized H3K27ac signal intensity in stitched regions performed by ROSE. (D) Distribution of RUNX2 putative TF cooperators identified by FIMO search is associated with predicted S‐ENHs in TPC1 cells. (E) Schematic representation of the hierarchical model backbone highlighting each functional layer. (F) Final hierarchical model of the reconstructed RUNX2 transcriptional landscape. The integration of different omics information allowed to stratify the RUNX2 regulative network. The node composition of each layer is shown in the legend. The transcriptional flow converged on target genes (layer 3) whose expression similarity assessed using a weighted correlation analysis is represented by different colored modules. The biological importance of each cluster was assessed by GO analysis using an FDR < 0.05 as the significance threshold. The number of genes and the major GO macro‐category are indicated above each module. N/S indicates that no significant pathway (FDR < 0.05) was detected for the considered module. (G) Correlation heatmap between eigengenes in each module and patients’ clinical features. Scale bar indicates correlation as expressed by R2 values. *P < 0.05, (**P < 0.01, *** P < 0.001. (H) Ranking of the top 5% TF model nodes identified as the bottleneck with a topological network analysis. The TF functional categories are represented with a binary color scale. (I Western blotting showing the RUNX2 KD mediated by CRISPR‐interference in the indicated cell lines. (J) Intersection of RUNX2‐network module genes with RNA‐seq profile. The histogram represents the percentage of deregulated genes in each module. (K) Top GO categories of deregulated gene modules ranked by enrichment significance (P value adjusted by Benjamini‐Hochberg correction for multiple tests). Abbreviations: TF, Transcription Factor; S‐ENH, Super‐Enhancer; ENH, Enhancer; ChIP‐seq, Chromatin Immunoprecipitation Sequencing; H3K27ac, Histone 3 acetyl lysine 27; RNA‐PolII, RNA‐polymerase II; H3K4me1, Histone 3 mono‐methyl Lysine 4; H3K4me3, Histone 3 tri‐methyl Lysine 4; WGCNA, Weighted correlation network analysis; TCGA‐THCA, The Cancer Genome Atlas‐Thyroid Cancer; GO, Gene Ontology; KD, Knock‐Down; NT, Non‐targeting control
We used the integrated list of RUNX2 and H3K27ac peaks to query the ROSE algorithm [4, 5] that discriminates classical ENHs from super‐ENHs (S‐ENHs) (Figure 1B).
We identified 525 RUNX2‐dependent S‐ENHs, which were associated with 1145 potential targets (Figure 1C).
We performed a motif enrichment analysis with FIMO algorithm [6] within S‐ENHs, identifying 137 RUNX2 putative cooperators ranked for representativeness and significance across all input sequences (Figure 1D). A precise core of cancer‐related TFs like Jun proto‐oncogene (JUN), Fos Proto‐Oncogene (FOS), and TEA Domain Transcription Factor (TEAD) was included in this list. Noticeably, AP‐1 transcription factor subunits JUNB and JUND, and TEAD1 and TEAD4 were also predicted to be putative targets of RUNX2‐associated S‐ENHs. We had previously shown that members of the TEAD and AP‐1 families regulated RUNX2 expression in thyroid and breast cancers [7, 8], highlighting the existence of a functional loop in which a core of transcriptional regulators controls themselves and cooperates to orchestrate complex transcriptional programs. To reconstruct the architecture of the RUNX2 transcriptional landscape, we built a hierarchical model integrating the information obtained from the omics profiles, focusing on S‐ENHs as leading nodes of this network.
Three functional levels were defined: S‐ENHs, TFs, and target genes. TFs were further categorized based on their being: 1) targets of RUNX2‐dependent S‐ENHs, 2) putative cooperators of RUNX2 in S‐ENHs, 3) putative targets and cooperators at RUNX2‐associated S‐ENHs (Figure 1E).
To infer TF regulation and define modules with a functional relevance, a weighted correlation was performed using clinical, mutational and transcriptional data of 494 patients from The Cancer Genome Atlas‐Thyroid Cancer (TCGA‐THCA) project [9]. Using a signed correlation approach (β parameter = 10, R2 = 0.8) and a cut height of 0.25 for the dynamic tree cut algorithm, highly‐correlated gene clusters were generated and filtered to retain only TFs and genes that were present in our omics dataset. We estimated the eigengenes on these refined modules, and those with higher correlation (≥0.75) were merged. The resulting 12 modules (Figure 1F) constituted the third layer of the hierarchy in which the transcriptional flow converged on its targets. The biological significance of the inferred structure was assessed by Gene Ontology (GO) enrichment analysis (Figure 1F) and by testing the correlation between module eigengenes and patient clinical features (Figure 1G). GO analysis identified a major biological category for each module. Processes like angiogenesis and regulation of cell death were among the RUNX2‐dependent functions.
We focused on the presence of metastasis (M‐stage) as a major determinant of thyroid cancer aggressiveness [10]. Pink, Grey60, and Brown4 modules, corresponding to immune response, regulation of apoptosis, and regulation of cell death categories showed significant negative correlations with this variable, while the Brown module related to the regulation of metabolic processes was positively correlated with this feature (Figure 1G).
A topological network analysis was performed to evaluate the importance of other TFs in propagating the RUNX2 transcriptional signal. Local and global centrality measures were exploited (i.e., betweenness, closeness and stress centrality, degree and neighborhood connectivity) to prioritize TFs, selecting the top 5% TFs as bottleneck nodes. These elements represent the connection point of RUNX2 with each module, acting as control centers that spread and amplify the RUNX2 transcriptional activity on module genes. The identified bottlenecks were RUNX2 predicted cooperators rather than targets (Figure 1H). Collectively, these results underline a direct dependency of the disease modules from RUNX2 and suggests that in their definition the primary action of RUNX2 at the genome level is of greater relevance than the potential activation of specific targets. Furthermore, the evidence that each module depends on different co‐factors indicates that RUNX2 affects different biological properties by changing partners according to the function to be performed.
This integrative genome‐wide analysis confirmed RUNX2 as a crucial gene in thyroid cancer, highlighted the major biological processes through which this TF exercises its pro‐metastatic function, and defined a link between RUNX2‐associated S‐ENHs and clinical aggressiveness.
Next, we knocked down RUNX2 expression by clustered regularly interspaced short palindromic repeats (CRISPR) interference in TPC1 and MDA‐T41 cells (Figure 1I) and performed RNA‐sequencing. A total of 2716 and 4677 genes significantly deregulated upon RUNX2 loss were identified in TPC1 and MDA‐T41, respectively.
The percentage of confirmed genes for each module ranged from 5.2% (dark grey) to 72% (floral white) and was generally greater in MDA‐T41 cells than in TPC1 cells, coherently with their higher RUNX2 expression (Figure 1J). Up to 50% of predicted genes were confirmed as RUNX2 targets by this analysis. Finally, GO analysis for genes of each module fully recapitulated the predicted categories, functionally validating the constructed model (Figure 1K).
In conclusion, our data demonstrated the transcriptional landscape of RUNX2 in thyroid cancer, providing evidence of a role for this TF in mastering S‐ENH function in cancer. We developed a computational network‐based approach that, integrating within a hierarchical model multi‐omics profiles and clinical data, describes the transcriptional dependency of thyroid cancer on the genomic activity of RUNX2. This model may serve as a transversal approach for modeling the function of other TFs in different contexts and may be used as a relevant tool for mapping cancer‐transcriptional dependencies and for defining new therapeutic interventions.
ETHICS APPROVAL AND CONSENT TO PARTICIPATE
The project was approved by the local Ethical Committee (number 2017/0071406 del 03/08/2017).
CONSENT FOR PUBLICATION
All authors read and approved the final manuscript for publication.
AUTHOR CONTRIBUTIONS
EV, MG, VM and FT performed experiments
ES and FT performed bioinformatics and modelling analysis
AC conceived the experiment and wrote the manuscript
All the Authors have revised and approved the manuscript
COMPETING INTEREST
The authors declare that they have no competing interests.
Supporting information
Supporting information.
ACKNOWLEDGEMENTS
We wish to thank Marina Grassi for technical support and all the members of the lab for stimulating discussion. We wish to thank GRADE onlus for its financial support to Dr. Veronica Manicardi PhD research fellowship. This work was supported by Fondazione Italiana per la Ricerca sul Cancro (project code: AIRC IG21772).
Emanuele Vitale, Elisabetta Sauta and Mila Gugnoni contributed equally to this work
DATA AVAILABILITY STATEMENT
ChiP‐seq data are available at ArrayExpress E‐MTAB‐11050 (ChIPseq Histone Modifications https://www.ebi.ac.uk/arrayexpress/experiments/E‐MTAB‐11050/), E‐MTAB‐11052 (ChIPseq RNA‐Polimerase II https://www.ebi.ac.uk/arrayexpress/experiments/E‐MTAB‐11052/), E‐MTAB‐11051 (ChIPseq RUNX2 https://www.ebi.ac.uk/arrayexpress/experiments/E‐MTAB‐11051/). RNA‐seq data are available at ArrayExpress E‐MTAB‐11049 (https://www.ebi.ac.uk/arrayexpress/experiments/E‐MTAB‐11049/).
REFERENCES
- 1. Bradner JE, Hnisz D, Young RA. Transcriptional Addiction in Cancer. Cell. 2017;168(4):629–43. [DOI] [PMC free article] [PubMed] [Google Scholar]
- 2. Ito Y, Bae SC, Chuang LSH. The RUNX family: developmental regulators in cancer. Nat Rev Cancer. 2015;15(2):81–95. [DOI] [PubMed] [Google Scholar]
- 3. Sancisi V, Borettini G, Maramotti S, Ragazzi M, Tamagnini I, Nicoli D, et al. Runx2 Isoform I Controls a Panel of Proinvasive Genes Driving Aggressiveness of Papillary Thyroid Carcinomas. J Clin Endocr Metab. 2012;97(10):E2006–15. [DOI] [PMC free article] [PubMed] [Google Scholar]
- 4. Whyte WA, Orlando DA, Hnisz D, Abraham BJ, Lin CY, Kagey MH, et al. Master Transcription Factors and Mediator Establish Super‐Enhancers at Key Cell Identity Genes. Cell. 2013;153(2):307–19 [DOI] [PMC free article] [PubMed] [Google Scholar]
- 5. Orlova NN, Bogatova OV, Orlov AV. High‐performance method for identification of super enhancers from ChIP‐Seq data with configurable cloud virtual machines. Methodsx. 2020;7:101165. [DOI] [PMC free article] [PubMed] [Google Scholar]
- 6. Grant CE, Bailey TL, Noble WS. FIMO: scanning for occurrences of a given motif. Bioinformatics. 2011;27(7):1017–8 [DOI] [PMC free article] [PubMed] [Google Scholar]
- 7. Sancisi V, Gandolfi G, Ambrosetti DC, Ciarrocchi A. Histone Deacetylase Inhibitors Repress Tumoral Expression of the Proinvasive Factor RUNX2. Cancer Res. 2015;75(9):1868–82 [DOI] [PubMed] [Google Scholar]
- 8. Sancisi V, Manzotti G, Gugnoni M, Rossi T, Gandolfi G, Gobbi G, et al. RUNX2 expression in thyroid and breast cancer requires the cooperation of three non‐redundant enhancers under the control of BRD4 and c‐JUN. Nucleic Acids Res. 2017;45(19):11249–67 [DOI] [PMC free article] [PubMed] [Google Scholar]
- 9. Agrawal N, Akbani R, Aksoy BA, Ally A, Arachchi H, Asa SL, et al. Integrated Genomic Characterization of Papillary Thyroid Carcinoma. Cell. 2014;159(3):676–90 [DOI] [PMC free article] [PubMed] [Google Scholar]
- 10. Haq M, Harmer C. Differentiated thyroid carcinoma with distant metastases at presentation: prognostic factors and outcome. Clin Endocrinol. 2005;63(1):87–93 [DOI] [PubMed] [Google Scholar]
Associated Data
This section collects any data citations, data availability statements, or supplementary materials included in this article.
Supplementary Materials
Supporting information.
Data Availability Statement
ChiP‐seq data are available at ArrayExpress E‐MTAB‐11050 (ChIPseq Histone Modifications https://www.ebi.ac.uk/arrayexpress/experiments/E‐MTAB‐11050/), E‐MTAB‐11052 (ChIPseq RNA‐Polimerase II https://www.ebi.ac.uk/arrayexpress/experiments/E‐MTAB‐11052/), E‐MTAB‐11051 (ChIPseq RUNX2 https://www.ebi.ac.uk/arrayexpress/experiments/E‐MTAB‐11051/). RNA‐seq data are available at ArrayExpress E‐MTAB‐11049 (https://www.ebi.ac.uk/arrayexpress/experiments/E‐MTAB‐11049/).