Abstract
Background
Stomach adenocarcinoma (STAD), is the most common histological type of gastric cancer (GC) with high mortality and poor prognosis. We sought to investigate the contribution of Notch receptor 1 (NOTCH1) to STAD immunity.
Methods
The profiles of immune cells in STAD cohorts were compared, and a correlation analysis between the NOTCH1 gene and tumor immune cell infiltration was then conducted. The immune-related genes (IRGs) associated with the NOTCH1 gene were identified. Based on the NOTCH1-associated IRGs, multiple-gene risk prediction signatures were established. The relationship between the expression levels of the selected IRGs and overall survival (OS) was analyzed by a univariate analysis. The risk score was calculated using the formula of β1x1 + β2x2 +... + βixi. A prognostic nomogram was constructed to predict individuals’ survival probabilities.
Results
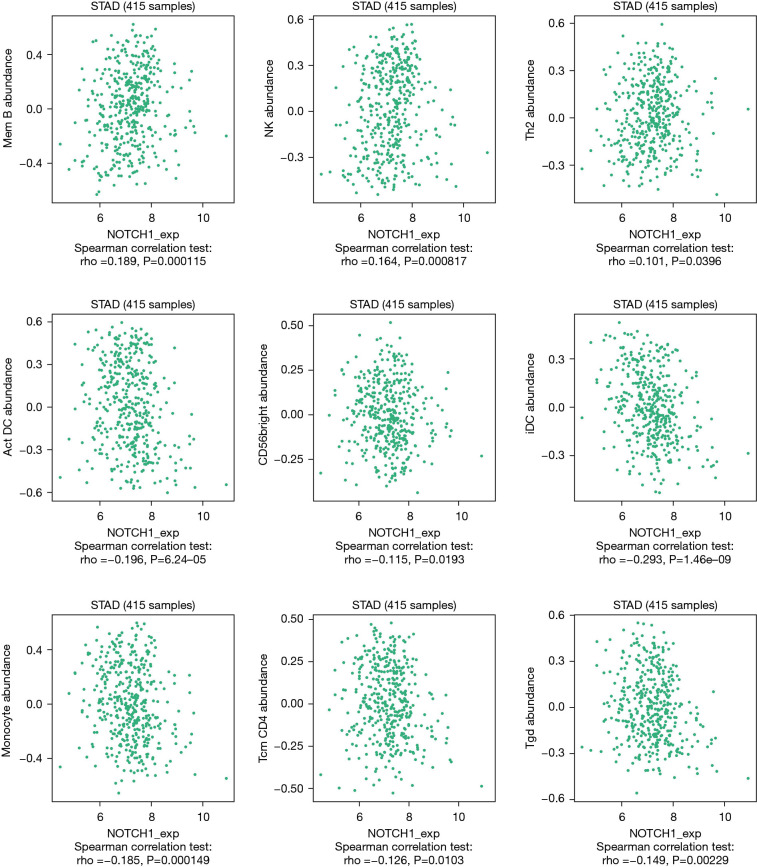
In STAD, NOTCH1 expression levels were significantly negatively associated with tumor-infiltrating lymphocyte (TIL) Act dendritic cells (DCs) (r=−0.196, P value =6.24e-05), TIL cluster of differentiation (CD) 56 bright cells (r=−0.115, P value =0.0193), TIL immature DCs (r=−0.293, P value =1.16e-09), TIL monocyte cells (r=−0.185, P value =0.000149), TIL central memory T CD4 cells (r=−0.126, P value =0.0103), and TIL gamma delta T cells (r=−0.149, P value =0.00229). The resulting risk scores of the 8-gene risk prediction signature (corticotrophin releasing hormone receptor 2 (CRHR2) (HR =1.858, P value =0.048), fms related receptor tyrosine kinase 1 (FLT1) (HR =1.268, P value =0.048), fms related receptor tyrosine kinase 4 (FLT4) (HR =1.334, P value =0.031), glial fibrillary acidic protein (GFAP) (HR =2.739, P value =0.008), platelet-derived growth factor receptor beta (PDGFRB) (HR =1.192, P value =0.02), prostaglandin D2 receptor (PTGDR) (HR =1.564, P value =0.049), semaphorin 5B (SEMA5B) (HR =1.154, P value =0.029), and tyrosine kinase 2 (TYK2) (HR =0.734, P value =0.041) were independent prognostic predictors for STAD patients.
Conclusions
NOTCH1 could be a potential target for STAD. The mechanisms underpinning NOTCH1-medicated prognostic values of immune signatures should be further explored.
Keywords: Stomach adenocarcinoma (STAD), NOTCH1, immune cells, prognosis, nomogram
Introduction
Stomach adenocarcinoma (STAD), is the most common histological type of gastric cancer (GC), and is the 5th most common neoplasm and the 3rd most deadly cancer (1). A combination of factors contribute to the high mortality of STAD patients, including underlying genetic heterogeneity, late clinical presentation, and the ineffective mechanisms of antitumor drugs. Additionally, many factors are crucial to the development of STAD, including chronic atrophic gastritis, smoking, alcohol, obesity, smoked food consumption, and Helicobacter pylori infection (2). The survival of patients with STAD has greatly improved due to surgery, targeted therapy, and chemotherapy; however, the prognosis of STAD patients is still unsatisfactory (3). Marin et al. found that the poor prognosis of STAD patients is associated with high tumor invasion, metastasis, and recurrence (1). It is important to explore the pathological mechanisms underlying tumor development and progression to identify novel potential prognostic biomarkers and therapeutic targets for treating STAD.
The tumor microenvironment (TME), which refers to the local biological environment of tumor cells, mainly consists of cytokines, stromal cells, and the extracellular matrix. Tumorigenesis causes a variety of immunological disturbances, which ultimately generate an immunosuppressive TME. In STAD, immune cells in the TME play important roles in tumorigenesis and clinical outcomes (1). In view of this, immunotherapy is regarded a promising therapy against cancer. Through immunotherapy, the TME can be improved. However, due to a lack of effective prognostic evaluation measures at an early stage (1), immune checkpoint inhibitors only play roles in a very small percentage of STAD patients. Thus, novel biomarkers that predict the survival of STAD patients urgently need to be identified. Previous studies showed that vestigial like family member 3 (VGLL3), nuclear receptor subfamily 1 group D member 1 (NR1D1), period circadian regulator 1 (PER1), Janus kinase 3 (JAK3) and tyrosine kinase 2 (TYK2) are considered as novel prognostic biomarkers for STAD (4-6). However, the potential mechanisms of NOTCH1 in STAD, especially in the immune response, remain mostly unknown. In comparison to normal gastric tissues, the expression levels of notch receptor 1 (NOTCH1) are higher in both GC and STAD tissues (1). Marin et al. found that the abnormal richness of NOTCH1 messenger ribonucleic acid (mRNA) was associated with unfavorable overall survival (OS) in GC patients (1). In this study, we evaluated the status of immune cells and examined the association between NOTCH1 and STAD immunity and the related signaling pathways. We also generated prognostic immune signatures using NOTCH1-associated IRGs, and then constructed a nomogram. We present the following article in accordance with the TRIPOD reporting checklist (available at https://jgo.amegroups.com/article/view/10.21037/jgo-22-685/rc).
Methods
Data set selection and data preprocessing
We obtained the gene expression data and complete clinical annotations for STAD from the University of California, Santa Cruz, Xena data set (https://gdc.xenahubs.net). Fragments per kilobase of exon per million mapped reads were converted into transcripts of per kilo base million. Patients with no survival information were removed. The STAD data set comprised 350 cancerous and 32 normal tissues. The study was conducted in accordance with the Declaration of Helsinki (as revised in 2013).
Determination of tumor-infiltrating immune cells
We conducted a single-sample gene-set enrichment analysis (SSGSEA) to quantify the relative abundance of cellular infiltration in the tumor immune microenvironment (TIME) in each tissue sample of STAD. The gene-set labeled for each TIME-infiltrating immune cell type was obtained. Enrichment scores (calculated by the SSGSEA analysis) were used to represent the relative abundance of the TIME-infiltrated cells in each tissue sample. A violin diagram was used to compare the infiltration differences of the immune cells in different tissues.
Correlation between the NOTCH1 gene and immune cell infiltration
The site provides several modules, including genes, survival, mutation, differential expression, and correlation. Using the TIMER tool, we evaluated the effect of NOTCH1 gene copy number alterations on immune infiltration. The immune score, Stromal score, and ESTIMATE score of each STAD patient were calculated using the ESTIMATE algorithm. The STAD patients were divided into high NOTCH1 expression group and low NOTCH1 expression group. Box plots were used to compare differences in terms of the immune scores, stromal scores, and ESTIMATE scores of the two groups.
RNA sequencing
The human STAD cell line was obtained from the National Cell Center. We knocked down the NOTCH1 gene. RNA samples were extracted and subjected to RNA-sequencing.
GSVA
To examine the association between NOTCH1 gene silencing and the phenotypic differences, we performed a gene set variation analysis (GSVA). The “limma” in R package was used to identify the pathways significantly associated with NOTCH1 expression levels. A P value <0.05 and a |log2 fold change| >0.3 were considered statistically significant.
Identification of IRGs associated with the NOTCH1 gene
The immune-related genes (IRGs) were retrieved. The overlapping IRGs, which were selected from The Cancer Genome Atlas (TCGA)-STAD data set and the ImmPort database, were used for the further analysis. The IRGs significantly associated with the NOTCH1 gene were screened using the co-expression strategy. Correlations with a |correlation| value >0.5 and P value <0.01 were considered significant. The David 6.8 database was used for the functional enrichment analysis of the significantly correlated IRGs.
Identification of a risk signature related to immunization
We tried to develop a prognostic multiple immune signature from the NOTCH1-related IRGs. We analyzed the relationship between the expression levels of the selected IRGs and OS by a univariate analysis. A P value <0.05 was considered statistically significant. A least absolute shrinkage and selection operator (LASSO) Cox regression analysis was then used to determine the prognostic model. The risk score for each sample was calculated using the following formula: risk score = β1x1 + β2x2 +... + βixi (7). The STAD patients were divided into high- and low-risk groups. A survival analysis was performed. Univariate and multivariate Cox regression analyses were performed to determine whether the risk score could be used as a prognostic factor independent of other clinical variables (including sex, histological grade, and tumor stage).
Construction of nomogram
A nomogram scores each parameter, such as age, sex, tumor-node-metastasis (TNM) stage, and risk score, by points. These points are added for each patient to calculate a total score. The higher the score, the more likely it is that an event will happen. This approach allows a personalized assessment of the probability of recurrence (1). We used the nomogram for cancer prognosis. The calibration curve was used to visualize the deviation between the predicted probabilities and actual outcomes.
Statistical analysis
We conducted all the statistical analysis with R. A Wilcox test was used to screen the statistically significant infiltrating immune cells. Univariate and multivariate Cox regression analyses were performed on the factors affecting the prognosis. The results of the multivariate Cox regression analysis are shown in forest maps. The C-index, time-dependent ROC, and calibration curve were also important criteria for evaluating the histogram. A P value <0.05 was considered statistically significant.
Results
The landscape of infiltrating immune cells in STAD
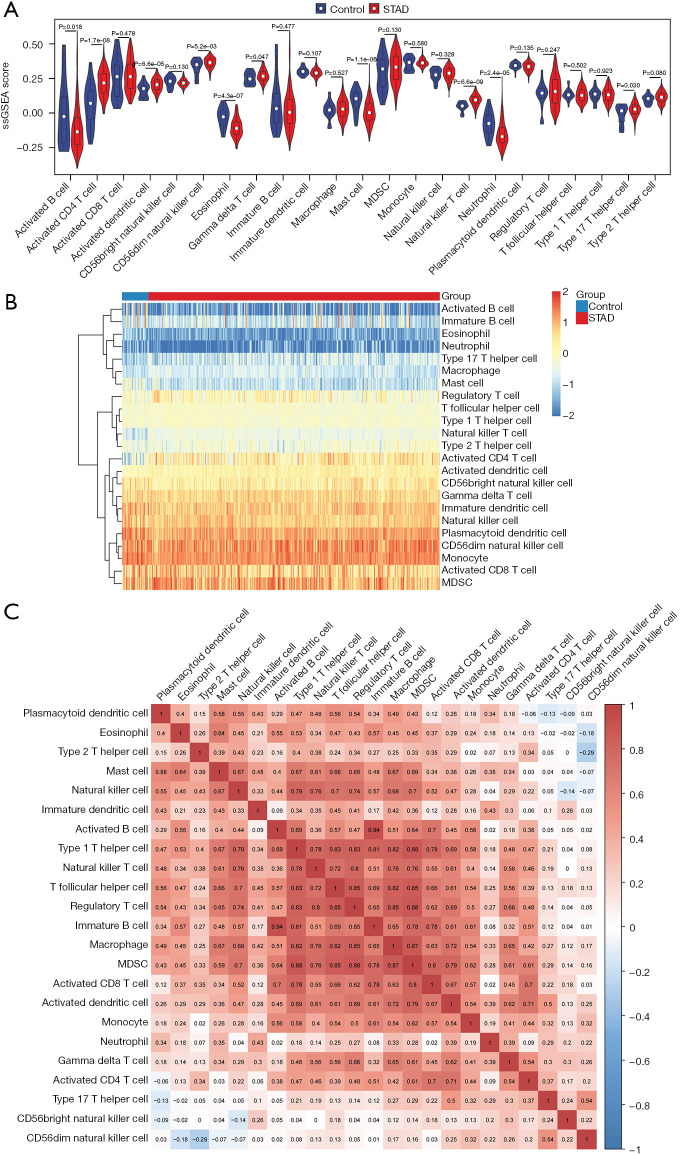
A SSGSEA analysis was then used to characterize the immune cell pattern in STAD (see Figure 1). The proportions of activated B cells, eosinophils, mast cells, and neutrophil cells were significantly decreased in the tissues of STAD patients. However, the proportions of activated cluster of differentiation (CD)4 T cells, activated dendritic cells (DCs), CD56 disorganized muscle protein (Dim) natural killer (NK) cells, gamma delta T cells, NK T cells, and type 17 T helper cells were significantly increased in the tissues of STAD patients (see Figure 1A). Patterns of infiltrating immune cells are shown in Figure 1B. Further, correlation patterns between immune cells were identified in STAD (see Figure 1C). The above results showed that the occurrence and development of STAD were closely related to immune cells.
Figure 1.
Evaluation of immune cell infiltration in STAD. The violin plots and heat maps show the differences between the STAD (red) and normal control (blue) tissues in the STAD (A,B) cohorts. Different correlation patterns among the immune cells subsets in the STAD (C) cohorts. STAD, stomach adenocarcinoma.
Association between NOTCH1 and immune cells
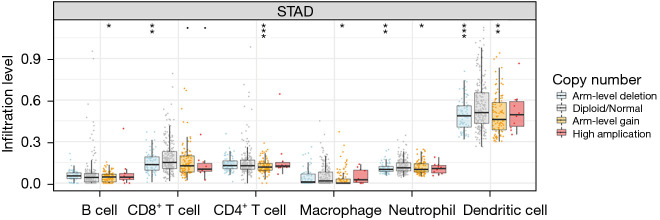
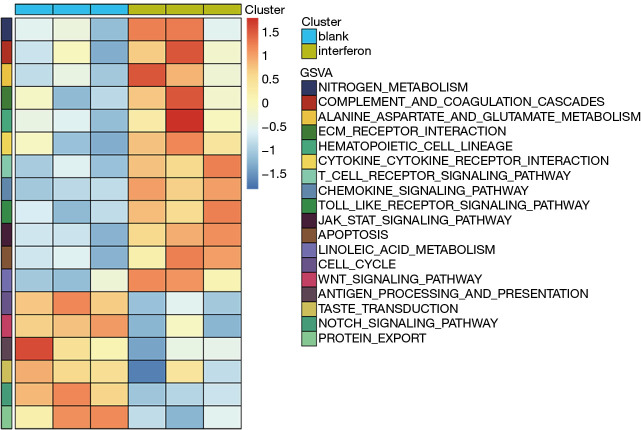
We studied the effect of NOTCH1 on the immune system. Arm-level deletion and an increase in the NOTCH1 gene significantly affected the infiltration levels of immune cells (see Figure 2). The expression level of NOTCH1 was positively or negatively correlated with various immune cell subpopulations. For example, the expression level of NOTCH1 was significantly positively correlated with memory B cells, tumor-infiltrating lymphocyte (TIL) NK cells, and TIL T helper 2 cells, while the expression level of NOTCH1 was significantly negatively associated with TIL Act DCs, TIL CD56 bright cells, TIL iDCs, TIL monocyte cells, TIL central memory T (Tcm) CD4 cells, and TIL gamma delta T cells (Tgd) cells (see Figure 3). The results of the ESTIMATE analysis showed that the immune score, stromal score, and ESTIMATE score of the high NOTCH1 expression group were significantly lower than those of the low NOTCH1 expression group (see Figure 4). These results indicated that the NOTCH1 gene appears to play key role in regulating the infiltration of immune cells. In addition, the RNA sequencing results showed that the silencing of the NOTCH1 gene activated several immune-related signaling pathways (see Figure 5).
Figure 2.
Associations between NOTCH1 gene copy number and immune infiltration levels in STAD. *P<0.05; **P<0.01; ***P<0.001. STAD, stomach adenocarcinoma.
Figure 3.
Correlation between NOTCH1 expression levels and cell subsets in STAD. The dot plots show the correlation between the NOTCH1 expression level and immune cell subset in STAD. Rho >0 and rho <0 represent the positive and negative correlations, respectively. STAD, stomach adenocarcinoma.
Figure 4.
Comparison of immune score, stromal score, and ESTIMATE score in the high and low NOTCH1 expression groups in STAD. STAD, stomach adenocarcinoma.
Figure 5.
GSVA results of NOTCH1 gene silencing in STAD cells. GSVA, gene set variation analysis; STAD, stomach adenocarcinoma.
NOTCH1-related IRGs
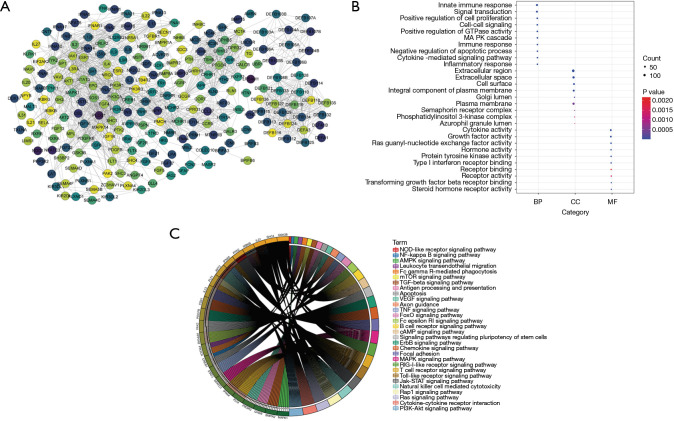
We found that 292 IRGs were significantly associated with NOTCH1 (see Figure 6A). Gene Ontology (GO) was used to annotate these IRGs (see Figure 6B). The Janus kinase (Jak)-signal transducer and activator of transcription (STAT), phosphatidylinositol 3-kinase (PI3K)-AKT serine/threonine kinase (Akt), Toll-like receptor, Ras-like protein (Ras) and erb-b2 receptor tyrosine kinase (ErbB) ignaling pathways were associated with NOTCH1-mediated immune events (see Figure 6C).
Figure 6.
Analysis of IRGs associated with the NOTCH1 gene in STAD. (A) Protein-protein network of 292 NOTCH1-associated IRGs. The darker the color, the higher the association with NOTCH1; (B) GO annotation of 292 NOTCH1-associated IRGs; (C) KEGG pathway analysis of the above-mentioned 292 genes. IRGs, immune-related genes; STAD, stomach adenocarcinoma; GO, Gene Ontology; KEGG, Kyoto Encyclopedia of Genes and Genomes.
The prognostic value of NOTCH1-associated IRGs in STAD
To study the prognostic values of NOTCH1-associated IRGs in STAD, a univariate Cox regression analysis was performed on the 292 identified NOTCH1-associated IRGs, which led to an optimal 11-gene prognostic signature (see Figure 7A). The LASSO Cox regression analysis of the 11 genes ultimately identified 8 characteristic genes [i.e., corticotrophin releasing hormone receptor 2 (CRHR2), fms related receptor tyrosine kinase 1 (FLT1), fms related receptor tyrosine kinase 4 (FLT4), glial fibrillary acidic protein (GFAP), platelet-derived growth factor receptor beta (PDGFRB), prostaglandin D2 receptor (PTGDR), semaphorin 5B (SEMA5B), and tyrosine kinase 2 (TYK2)]. A risk model composed of these 8 genes was also constructed. The risk scores were calculated. Patients with a low-risk score had significantly longer survival (see Figure 7B). To assess the accuracy of a prognostic model consisting of the 8 NOTCH1-associated IRGs in predicting the prognosis of STAD, we performed the ROC analyses at 1, 3, and 5 years to compare the area under the curve (AUC) values. The results showed that the AUC at 1, 3, and 5 years were 0.65, 0.72 and 0.75, respectively (see Figure 7C). The prognostic model composed of 8 NOTCH1-associatedIRGs performed well in determining the prognosis of STAD patients.
Figure 7.
The development of the prognostic gene signatures based on the 292 NOTCH1-associated IRGs. The hazard ratios of the 11 NOTCH1-associated IRGs, which were integrated into the prognostic signature, are represented in the forest plots (A). KM curves of the further 8 identified NOTCH1-associated IRGs for STAD regarding the risk score (B). Time-dependent ROC curves of further identified 8 NOTCH1-associated IRGs at 1, 3, and 5 years for STAD (C). AUC, area under the curve; IRGs, immune-related genes; KM, Kaplan-Meier; STAD, stomach adenocarcinoma; ROC, receiver operating characteristic.
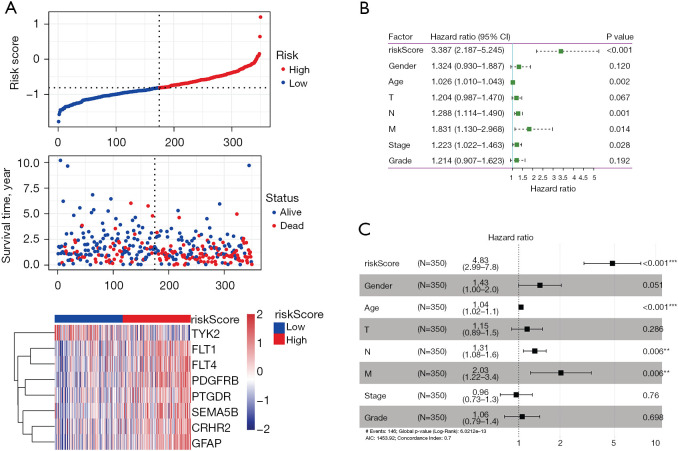
The distribution of the risk score, survival status, and expression profiles for STAD are shown in Figure 8A. The heat map results showed that the high-risk genes (i.e., CRHR2, FLT1, FLT4, GFAP, PDGFRB, PTGDR, and SEMA5B) were highly expressed in the high-risk group, while the protective gene TYK2 was lowly expressed in the high-risk group. The risk score was significantly related to the survival of STAD patients (see Figure 8B). Further, the risk score was an independent predictor of the prognosis of STAD patients (see Figure 8C).
Figure 8.
Prognostic values of the risk score of STAD patients. Distribution of the risk score, survival status, and gene expression profile (A). Univariate Cox regression. X-axis represents orderings of samples (B) and multivariate Cox regression (C) analyses. **P<0.01; ***P<0.001. STAD, stomach adenocarcinoma.
Construction of the nomogram
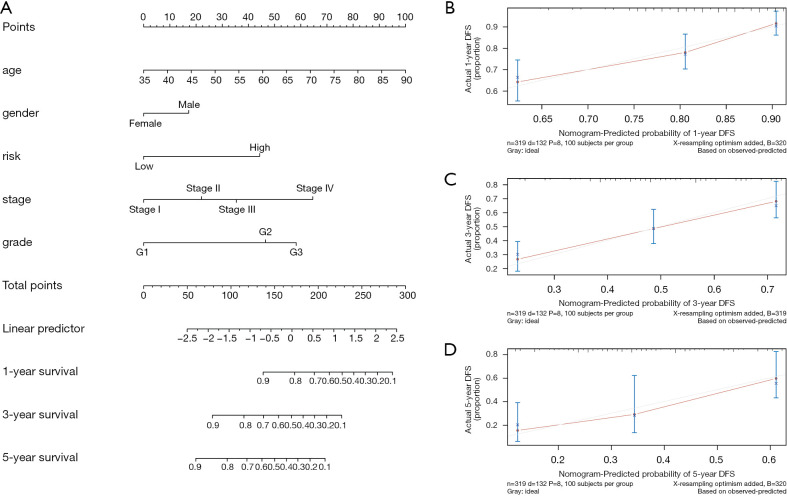
In the end, we constructed the prognostic nomogram for STAD to predict an individual’s survival probability by weighing the risk score, TNM stage, age, and gender. The the nomogram’s predicted probability (solid line) was well matched to the ideal reference line (dashed line) (see Figure 9). We also examined the nomogram’s predictive discrimination. Our prognostic nomogram had a C-index of 0.69.
Figure 9.
Establishment of the prognostic nomogram for STAD. (A) A nomogram for predicting the survival possibilities of STAD patients. The calibration curve for 1-year (B), 3-year (C), and 5-year survival of the STAD patients (D). The 45° dashed line shows the perfect uniformity. DFS, disease-free survival; STAD, stomach adenocarcinoma.
Discussion
We found that the immune subsets in the TME were significantly changed in STAD. For example, the proportion of activated B cells, eosinophils, mast cells, and neutrophil cells was significantly decreased in the tissues of STAD patients. However, the proportions of activated CD4 T cells, activated DCs, CD56 Dim NK cells, gamma delta T cells, NK T cells, and type 17 T helper cells were significantly increased in the tissues of STAD patients. These findings suggest that the occurrence and development of STAD are closely associated with immune cells.
Notably, the immune cell infiltration levels were related to the NOTCH1 gene copy numbers in STAD. Additionally, the expression level of NOTCH1 was significantly negatively associated with TIL Act DCs, TIL CD56bright cells, TIL immature DCs (iDCs), TIL monocyte cells, TIL Tcm CD4 cells, and TIL Tgd cells. TIL CD56 bright cells mediate antibody-dependent cellular cytotoxicity and exhibit high levels of perforin and enhanced killing. TIL CD56 bright cells specialize in secreting cytokines and chemokines in response to inflammatory factors and in regulating adaptive immunity. It has been reported that TIL CD56 bright cells are associated with non-small cell lung cancer and clear cell renal cell carcinoma (1). The relationship between TIL iDCs and GC has been demonstrated (1). TIL monocyte cells promote tumorigenesis and inhibit the antitumor immune response (1). A high absolute count of TIL monocyte cells is related to the poor prognosis of GC patients (8). TIL Tcm CD4 cells, which are a type of lymphocyte, have been identified in the TME of head and neck squamous cancer patients (9). TIL Tgd cells are associated with the prognosis of STAD patients (10). These results suggest that the NOTCH1 gene could play an important role in regulating the infiltration of immune cells in STAD.
The association of NOTCH1 and immunity was also verified using the RNA sequencing data. Notably, the silencing of the NOTCH1 gene activated several immune pathways in STAD cells, including the cytokine-cytokine receptor interaction, T cell receptor signaling pathway, chemokine signaling pathway, and apoptosis. Cytokines could stimulate host immune responses against pathogens and tumors (1). Cytokines play important roles in cancer progression and immunotherapy. Research has shown that GC cells express cytokine receptor systems that impart a therapeutically-resistant phenotype to gastric tumors (11). It has been noted that the cytokine-cytokine receptor interaction is a significantly enriched signaling pathway in STAD (12). In cancer, some prognostic immune genes are associated with the T cell receptor (1). T cell receptor editing has been clinically tested in cancer therapy (13). Chemokines are the main component of cancer-related inflammation, and play a crucial role in tumor growth (1). Chemokines also control the positioning and the migratory patterns of immune cells, which are critical for immune cell homeostasis (1). It is supposed that targeting chemokine receptors may be an attractive approach for eliciting beneficial anti-tumor immune responses in cancer patients. Cell apoptosis can hinder tumor growth (1). Thus, the induction of tumor apoptosis is a good anti-cancer therapy. It is confirmed that NOTCH1 could be involved in the immune reaction of STAD.
Based on the KEGG pathway analysis of the NOTCH1-associated IRGs, we found that the Jak-STAT, PI3K-Akt, Toll-like receptor, Ras, and ErbB signaling pathways might be associated with the NOTCH1-mediated immune response. The Jak-STAT proteins are expressed by immune cells, making them key transducers of immune signals in cells. Previous research has shown that GC prognosis-related genes are involved in the Jak-STAT signaling pathway (14). It is worth mentioning that the Jak-STAT signaling pathway is associated with STAD (1). PI3K-Akt activation increases the migration potential of GC cells in macrophage-derived exosomes (15). Toll-like receptors can detect pathogens and promote pro-inflammatory changes at the site of infection. Genetic polymorphisms in the Toll-like receptor signaling pathway are associated with gastric precancerous lesions (16). In STAD, some survival-related genes were shown to be enriched in the Ras and ErbB signaling pathways (1). We assumed that NOTCH1 inhibitors would be helpful in the antitumor efficacy of immune checkpoint blockers in STAD.
Using the NOTCH1-associated IRGs, we established the immune gene signature for STAD. The risk score was significantly related to survival in STAD. Notably, the immune gene signatures for STAD were CRHR2, FLT1, FLT4, GFAP, PDGFRB, PTGDR, SEMA5B, and TYK2. Moreover, high-risk genes (i.e., CRHR2, FLT1, FLT4, GFAP, PDGFRB, PTGDR, and SEMA5B) were highly expressed in the high-risk patients, while the protective gene TYK2 was lowly expressed in the high-risk patients. CRHR2 immunoreactivity has been found in some malignancies, including adrenocortical carcinoma (1), ovarian carcinoma (1), endometrial carcinoma (17), and breast carcinoma (1). The FLT1 gene encodes vascular endothelial growth factor receptor 1 (VEGFR-1). The vascular endothelial growth factor system is important to angiogenesis, which is regarded as key to the occurrence of malignant tumors (1). The over expression of FLT1 is associated with malignant melanoma and renal cell carcinoma (1). FLT1 has been considered an IRG in cervical cancer (18). It has been noted that FLT1 is a GC-related target (19).
In the TME of GC, the vascular endothelial growth factor C (VEGF-C)- vascular endothelial growth factor receptor 3 (VEGFR)-3/fms related receptor tyrosine kinase 4 (FLT4) axis could promote cell proliferation and migration by upregulating both VEGFC in an autocrine manner, which in turn could contribute to cancer progression (20). FLT4 is an OS-related differentially expressed IRG in lung squamous cell carcinoma patients (21). GFAP, which is a stem cell–related gene, is upregulated in the glioblastoma cells (22). The high expression of GFAP is related to poor OS in endometrial cancer patients (23). The high expression of PDGFRB is significantly related to the poor OS of oral squamous cell carcinoma patients (24). Additionally, PDGFRB serves as a prognostic biomarker of GC (1). PTGDR was found to be an IRG that predicted the recurrence of colorectal adenocarcinoma (1). The expression of SEMA5B is increased in clear cell renal cell carcinoma (1). SEMA5B is an IRG in hepatocellular, breast, and head and neck squamous cell carcinomas (1). TYK2 plays important roles in immune responses and inflammation (25). TYK2 serves as a prognostic biomarker and is related to immune infiltration in STAD (6). It is demonstrated that the risk score derived from above NOTCH1-associated IRGs can discriminate among risk patients.
In summary, NOTCH1 could play a crucial role in controlling the TIME. The prognostic signature derived from 8 NOTCH1-associated IRGs were independently predictive of OS in STAD. However, our study had some limitations. First, all these findings need to be validated in the large number of patients. Second, the mechanisms underpinning NOTCH1-medicated prognostic values of immune signatures should be further explored.
Supplementary
The article’s supplementary files as
Acknowledgments
Funding: This study was funded by Fujian Provincial medical innovation project (2019-CX-22), Joint Funds for the Innovation of Science and Technology, Fujian Province (2019Y9014), and the Fujian Provincial Natural Science Foundation Projects (2020J02050).
Ethical Statement: The authors are accountable for all aspects of the work in ensuring that questions related to the accuracy or integrity of any part of the work are appropriately investigated and resolved. The study was conducted in accordance with the Declaration of Helsinki (as revised in 2013).
Reporting Checklist: The authors have completed the TRIPOD reporting checklist. Available at https://jgo.amegroups.com/article/view/10.21037/jgo-22-685/rc
Conflicts of Interest: All authors have completed the ICMJE uniform disclosure form (available at https://jgo.amegroups.com/article/view/10.21037/jgo-22-685/coif). LL reports that this study was funded by Fujian Provincial medical innovation project (2019-CX-22), Joint Funds for the Innovation of Science and Technology, Fujian Province (2019Y9014), and the Fujian Provincial Natural Science Foundation Projects (2020J02050). The other authors have no conflicts of interest to declare.
(English Language Editor: L. Huleatt)
References
- 1.Marin JJG, Perez-Silva L, Macias RIR, et al. Molecular Bases of Mechanisms Accounting for Drug Resistance in Gastric Adenocarcinoma. Cancers (Basel) 2020;12:2116. 10.3390/cancers12082116 [DOI] [PMC free article] [PubMed] [Google Scholar]
- 2.Poorolajal J, Moradi L, Mohammadi Y, et al. Risk factors for stomach cancer: a systematic review and meta-analysis. Epidemiol Health 2020;42:e2020004. 10.4178/epih.e2020004 [DOI] [PMC free article] [PubMed] [Google Scholar]
- 3.Siegel RL, Miller KD, Jemal A. Cancer statistics, 2019. CA Cancer J Clin 2019;69:7-34. 10.3322/caac.21551 [DOI] [PubMed] [Google Scholar]
- 4.Zhang L, Li L, Mao Y, et al. VGLL3 is a prognostic biomarker and correlated with clinical pathologic features and immune infiltrates in stomach adenocarcinoma. Sci Rep 2020;10:1355. 10.1038/s41598-020-58493-7 [DOI] [PMC free article] [PubMed] [Google Scholar]
- 5.Huang Z, He A, Wang J, et al. The circadian clock is associated with prognosis and immune infiltration in stomach adenocarcinoma. Aging (Albany NY) 2021;13:16637-55. 10.18632/aging.203184 [DOI] [PMC free article] [PubMed] [Google Scholar]
- 6.Meng L, Ding L, Yu Y, et al. JAK3 and TYK2 Serve as Prognostic Biomarkers and Are Associated with Immune Infiltration in Stomach Adenocarcinoma. Biomed Res Int 2020;2020:7973568. 10.1155/2020/7973568 [DOI] [PMC free article] [PubMed] [Google Scholar]
- 7.Aguirre-Gamboa R, Gomez-Rueda H, Martínez-Ledesma E, et al. SurvExpress: an online biomarker validation tool and database for cancer gene expression data using survival analysis. PLoS One 2013;8:e74250. 10.1371/journal.pone.0074250 [DOI] [PMC free article] [PubMed] [Google Scholar]
- 8.Feng F, Zheng G, Wang Q, et al. Low lymphocyte count and high monocyte count predicts poor prognosis of gastric cancer. BMC Gastroenterol 2018;18:148. 10.1186/s12876-018-0877-9 [DOI] [PMC free article] [PubMed] [Google Scholar]
- 9.Lin B, Li H, Zhang T, et al. Comprehensive analysis of macrophage-related multigene signature in the tumor microenvironment of head and neck squamous cancer. Aging (Albany NY) 2021;13:5718-47. 10.18632/aging.202499 [DOI] [PMC free article] [PubMed] [Google Scholar]
- 10.Hong C, Yang S, Wang Q, et al. Epigenetic Age Acceleration of Stomach Adenocarcinoma Associated With Tumor Stemness Features, Immunoactivation, and Favorable Prognosis. Front Genet 2021;12:563051. 10.3389/fgene.2021.563051 [DOI] [PMC free article] [PubMed] [Google Scholar]
- 11.Jan I, Rather RA, Mushtaq I, et al. Helicobacter pylori Subdues Cytokine Signaling to Alter Mucosal Inflammation via Hypermethylation of Suppressor of Cytokine Signaling 1 Gene During Gastric Carcinogenesis. Front Oncol 2020;10:604747. 10.3389/fonc.2020.604747 [DOI] [PMC free article] [PubMed] [Google Scholar]
- 12.Zhu X, Xie X, Zhao Q, et al. Potential Prognostic Value and Mechanism of Stromal-Immune Signature in Tumor Microenvironment for Stomach Adenocarcinoma. Biomed Res Int 2020;2020:4673153. 10.1155/2020/4673153 [DOI] [PMC free article] [PubMed] [Google Scholar]
- 13.Morandi F, Yazdanifar M, Cocco C, et al. Engineering the Bridge between Innate and Adaptive Immunity for Cancer Immunotherapy: Focus on γδ T and NK Cells. Cells 2020;9:1757. 10.3390/cells9081757 [DOI] [PMC free article] [PubMed] [Google Scholar]
- 14.Chen Q, Hu L, Chen K. Construction of a Nomogram Based on a Hypoxia-Related lncRNA Signature to Improve the Prediction of Gastric Cancer Prognosis. Front Genet 2020;11:570325. 10.3389/fgene.2020.570325 [DOI] [PMC free article] [PubMed] [Google Scholar]
- 15.Zheng P, Luo Q, Wang W, et al. Tumor-associated macrophages-derived exosomes promote the migration of gastric cancer cells by transfer of functional Apolipoprotein E. Cell Death Dis 2018;9:434. 10.1038/s41419-018-0465-5 [DOI] [PMC free article] [PubMed] [Google Scholar]
- 16.Castaño-Rodríguez N, Kaakoush NO, Mitchell HM. Pattern-recognition receptors and gastric cancer. Front Immunol 2014;5:336. [DOI] [PMC free article] [PubMed] [Google Scholar]
- 17.Miceli F, Ranelletti FO, Martinelli E, et al. Expression and subcellular localization of CRH and its receptors in human endometrial cancer. Mol Cell Endocrinol 2009;305:6-11. 10.1016/j.mce.2009.02.013 [DOI] [PubMed] [Google Scholar]
- 18.Ding H, Fan GL, Yi YX, et al. Prognostic Implications of Immune-Related Genes' (IRGs) Signature Models in Cervical Cancer and Endometrial Cancer. Front Genet 2020;11:725. 10.3389/fgene.2020.00725 [DOI] [PMC free article] [PubMed] [Google Scholar]
- 19.Liu X, Wu J, Zhang D, et al. Network Pharmacology-Based Approach to Investigate the Mechanisms of Hedyotis diffusa Willd. in the Treatment of Gastric Cancer. Evid Based Complement Alternat Med 2018;2018:7802639. 10.1155/2018/7802639 [DOI] [PMC free article] [PubMed] [Google Scholar]
- 20.Yu JW, Wu SH, Lu RQ, et al. Expression and significances of contactin-1 in human gastric cancer. Gastroenterol Res Pract 2013;2013:210205. 10.1155/2013/210205 [DOI] [PMC free article] [PubMed] [Google Scholar]
- 21.Fu D, Zhang B, Yang L, et al. Development of an Immune-Related Risk Signature for Predicting Prognosis in Lung Squamous Cell Carcinoma. Front Genet 2020;11:978. 10.3389/fgene.2020.00978 [DOI] [PMC free article] [PubMed] [Google Scholar]
- 22.Thakuri PS, Liu C, Luker GD, et al. Biomaterials-Based Approaches to Tumor Spheroid and Organoid Modeling. Adv Healthc Mater 2018;7:e1700980. 10.1002/adhm.201700980 [DOI] [PMC free article] [PubMed] [Google Scholar]
- 23.Zhao L, Fu X, Han X, et al. Tumor mutation burden in connection with immune-related survival in uterine corpus endometrial carcinoma. Cancer Cell Int 2021;21:80. 10.1186/s12935-021-01774-6 [DOI] [PMC free article] [PubMed] [Google Scholar]
- 24.Lin LH, Lin JS, Yang CC, et al. Overexpression of Platelet-Derived Growth Factor and Its Receptor Are Correlated with Oral Tumorigenesis and Poor Prognosis in Oral Squamous Cell Carcinoma. Int J Mol Sci 2020;21:2360. 10.3390/ijms21072360 [DOI] [PMC free article] [PubMed] [Google Scholar]
- 25.Wöss K, Simonović N, Strobl B, et al. TYK2: An Upstream Kinase of STATs in Cancer. Cancers (Basel) 2019;11:1728. 10.3390/cancers11111728 [DOI] [PMC free article] [PubMed] [Google Scholar]
Associated Data
This section collects any data citations, data availability statements, or supplementary materials included in this article.
Supplementary Materials
The article’s supplementary files as


