

Abstract
Objective
The objective of the study was to investigate the expression of LAMTOR3 in kidney renal clear cell carcinoma (KIRC) and its clinical significance.
Methods
The expression of LAMTOR3 in KIRC and its relationship with clinical features were analyzed using the UALCAN online database. The results were verified using KIRC gene chip data and clinical specimens. The prognosis of KIRC patients was analyzed with the GEPIA2 database. GO, KEGG, and GSEA analyses were conducted to analyze the possible molecular mechanism of LAMTOR3 in KIRC. Immunohistochemical (IHC) and hematoxylin and eosin (H&E) staining were used for histopathological detection.
Results
UALCAN database analysis showed that LAMTOR3 expression in KIRC was significantly lower than in normal kidney tissues and correlated with the clinical stage, pathological grade, and tumor genotype (p < .05). GSE53757 dataset analysis consistently showed that the expression of LAMTOR3 in KIRC was significantly lower than in normal kidney tissues (p < .01). GEPIA2 database analysis indicated that patients with low LAMTOR3 expression had poor overall and disease‐free survival rates. GSEA analysis suggested that LAMTOR3 positively regulated the citrate cycle and drug metabolism cytochrome P450 and negatively regulated folate biosynthesis and olfactory transduction. The expression of LAMTOR3 in KIRC was also significantly correlated with immune cell infiltration. Finally, IHC showed that LAMTOR3 expression in the KIRC tissues was lower than in the adjacent normal tissues.
Conclusion
LAMTOR3 expression is significantly lower in KIRC. LAMTOR3 may be a potential marker for KIRC diagnosis and therapy.
Keywords: GSEA, immune, kidney renal clear cell carcinoma (KIRC), LAMTOR3, prognosis
LAMTOR3 protein was detected in human KIRC tissues using immunohistochemistry assay. (A) HE staining of normal renal tissues (magnifcation ×10); (B) HE staining of normal renal tissues (magnifcation ×40); (C) HE staining of KIRC tissues (magnifcation ×10); (D) HE staining of KIRC tissues (magnifcation ×40). (E) Positive staining of LAMTOR3 in normal renal tissue (magnifcation ×10). (F) Positive staining of LAMTOR3 in normal renal tissues (magnifcation ×40). (G) Positive staining of LAMTOR3 in KIRC tissues (magnifcation ×10). (H) Positive staining of LAMTOR3 in KIRC tissues (magnifcation ×40).

1. INTRODUCTION
Kidney renal clear cell carcinoma (KIRC) is a malignant tumor originating from renal parenchymal tubular epithelial cells 1 , 2 that accounts for 60% ~ 85% of all renal carcinoma. 3 There is a lack of early diagnosis and metastasis detection methods to assist clinicians during clinical practice. KIRC usually progresses rapidly, with reported metastatic rates of 30% at the initial diagnosis of KIRC. 4 It is well established that KIRC is not sensitive to chemotherapy and radiotherapy, and surgical resection remains the mainstay to cure KIRC. Nonetheless, the prognosis remains poor in patients with high rates of metastasis or recurrence. 5 Therefore, there is urgent to explore the specific diagnostic and prognostic markers of KIRC and identify new drug targets.
LAMTOR3 (late endosomal/lysosomal adaptor and MAPK and MTOR activator 3), also known as MAPKSP1, has been reported to play an essential role in tumorigenesis and development. LAMTOR3 acts as a scaffold protein complex located in the nucleus during anaphase mitosis. MAPK1/ERK2 is a specific polymeric mitogen‐activated protein kinase involved in the mitosis and growth of tumor cells. 6 In addition, circ_0075829 has been found to promote pancreatic cancer progression through miR‐1287‐5P/LAMTOR3 signaling pathways. 7 In breast cancer research, miR‐20a could promote the apoptosis of breast cancer cells by regulating the MTOR signaling pathway via sponging LAMTOR3. 8 However, the expression and biological function of LAMTOR3 in KIRC remains unknown, warranting further exploration.
In this study, the relationship between LAMTOR3 expression and survival of patients in KIRC was analyzed using TCGA (The Cancer Genome Atlas) and GEO Databases. GO, KEGG, and Gene Set Enrichment Analysis (GSEA) were used to investigate the potential molecular mechanism of LAMTOR3 in KIRC, to identify new indicators for early diagnosis and prognosis of KIRC, and to provide a theoretical basis for further study of LAMTOR3 in KIRC diagnosis, biology therapy, and prognosis.
2. MATERIALS AND METHODS
2.1. Materials
2.1.1. General materials
From March 2021 to March 2022, five pairs of paraffin‐embedded specimens and corresponding adjacent normal renal tissues were collected for clinical diagnosis of KIRC after nephrectomy. All cases were diagnosed as KIRC according to the 2016 WHO histological classification of renal tumors. The inclusion criteria consisted of (1) patients diagnosed with KIRC, and the patients and their families were contacted for surgical treatment; (2) patients with a histopathological diagnosis of KIRC; (3) patients aged from 38 to 79 years old. The exclusion criteria consisted of (1) patients with recurrent renal cell carcinoma; (2) patients with a history of surgery or who were not indicated for surgery before admission. The study was approved by the Ethics Committee of Pingxiang people's Hospital. The procedures used in this study adhere to the tenets of the Declaration of Helsinki (as revised in 2013).
2.1.2. Reagents
The main reagents were purchased from Fuzhou Maixin Biology Company by using quick‐use immunohistochemistry Max Vision Reagent Kit, Hematoxylin and DAB substrate chromogenic reagent kit Rabbit anti‐human LAMTOR3 (working concentration 1:100), and monoclonal antibody were purchased from Abcam biotech, Fuzhou Maixin Biotech, and PBS buffer was purchased from Beijing Solebo Technology Co., Ltd.
2.2. Methods
2.2.1. UALCAN, TIMER2.0, and GEPIA2 database
UALCAN (http://ualcan.path.uab.edu/index.html) is an online tool for analyzing multiple cancers based on RNA‐seq data from TCGA transcriptome data, providing users with visual information such as gene expression profiles and survival analysis. 9 TIMER2.0 (Tumor Immune Estimation Resource 2.0) (http://timer.cistrome.org/)is used to analyze the correlation between tumor genes and various immune cells. 10 GEPIA2 (http://gepia.cancer‐pku.cn/) is a newly developed web server for gene expression profiling interactive analysis, to analyze RNA sequencing expression data from 9736 tumors and 8587 normal samples from the TCGA and GTEX databases. 11 The key words “LAMTOR3” or “MAPKSP1” were entered into the search box, and the KIRC database was selected, the expression of LAMTOR3 and its clinical relevance were analyzed.
2.2.2. TCGA, GEO, and the human protein atlas database validation
UCSC Xena (http://xena.ucsc.edu/) website is a public database containing many tumor‐related genomic data. We downloaded the TCGA‐KIRC (HTSeq–FPKM [n = 607] GDC) transcriptome data from the site to provide data support for subsequent analysis. GSE53757 12 download KIRC gene chip data from the NCBI public data platform GEO database (https://www.NCBI.nlm.nih.gov/GEO/). The GSE53757 datasets were obtained from the Mayo Clinic and included 144 tissues, including 72 KIRC tissues and 72 paired normal kidney tissues. The downloaded gene expression profiling data were analyzed using R studio software, the limma, and affy packages were used to process the data. Then, the data were subsequently analyzed, and the expression level of LAMTOR3 at KIRC was verified. The Human Protein Atlas (https://www.proteinatlas.org/) online database provides information on the distribution of human proteins in tissues and cells. The distribution and expression of each protein in 48 kinds of normal human tissues, 20 kinds of tumor tissues, 47 cell lines, and 12 kinds of blood cells were detected by immunohistochemistry. The results of immunohistochemical staining were read and indexed by professional pathologists. 13 The expression of LAMTOR3 protein in human KIRC tissues and normal kidney tissues was verified by the human protein atlas database.
2.2.3. The Differential Expression of LAMTOR3
To determine the differential expression of LAMTOR3 in different cancer types, the TIMER2.0 and UALCAN databases were used to analyze genomic characteristics and pan‐cancer gene expression in various cancers. The distribution of LAMTOR3 expression levels for each cancer type compared with normal tissue was visualized by generating a box plot. In addition, the MAPKSP1 gene was entered into the UALCAN database, and the KIRC gene set was selected to analyze the expression of MAPKSP1 in different sample types (tumor and normal), different stages of KIRC (stage I‐IV), age, gender (male or female), tumor grade, and metastasis status. 14 We further analyzed the difference in survival between the high‐ and low‐expression groups. Gepia2 database was used to generate the overall survival (OS) and disease‐free survival (DFS) curves of patients with different LAMTOR3 expressions in KIRC to obtain the corresponding hazard ratio (HR) and log‐rank P (p value).
2.2.4. Co‐expression prediction and differentially expressed genes analysis
Co‐expression analysis was used to analyze LAMTOR3 expression in TCGA‐KIRC dataset using the limma, ggplot2, and other R packages. The screening criteria for differentially expressed genes (DEGs) of LAMTOR3 included an FDR = 1 and p = .05, and r > 0.6 and p < .001 for the Wilcoxon test. A heatmap was generated to visualize the results.
2.2.5. Biological function and enrichment pathways analysis
Analysis of biological function and enrichment pathways was based on TCGA‐KIRC data. The ID of the DGEs was annotated, and the GO and KEGG analyses were performed using the org.Hs.eg.db and clusterProfiler R packages (p < .05). The GO analyses included molecular function (MF), biological processes (BP), and cell components (CC) and were displayed in bubble plots. GSEA (http://software.broadinstitute.org/gsea/index.jsp) is a free data analysis tool for whole‐genome expression profiling used to assess gene distribution and determine their contribution to the phenotype. 15
2.2.6. Correlation between LAMTOR3 expression and immune infiltration
TIMER2.0 was used to screen the correlation of the LAMTOR3 gene with CD8 + T cell, CD4 + T cell, B cell, and macrophages in KIRC by several immune deconvolution methods (including TIMER, TIDE, CIBERSORT, CIBERSORT‐ABS, XCELL, QUANTISEQ, MCPCOUNTER, and EPIC algorithms). In addition, tumor purity was the main confounding factor during the analysis. Accordingly, we chose the “purity adjustment” option. 10
2.2.7. Immunohistochemistry
Immunohistochemistry was used to detect the expression of LAMTOR3 by streptavidin‐peroxidase (SP) method and operated strictly according to the manufacturer's instruction. The positively stained LAMTOR3 protein in KIRC was granular, exhibiting yellowish and brownish coloration. The immunohistochemical (IHC) score was derived by adding the scores for the percentage of positively stained cells and the nuclear staining intensity. The staining intensity score was evaluated as follows: no staining 0 points, light yellow 1 point, brown‐yellow 2 points, and brown 3 points. The percentage of positive cells was calculated as follows: 0 = the number of positive cells less than 10%, 1 = 11% ~ 25%, 2 = 26% ~ 50%, 3 = more than 50%. The expression of LAMTOR3 was positive in the ≥3 score and negative in the <3 score. 5–10 high‐power optical fields were selected, and the images were interpreted by two experienced pathologists independently.
3. RESULTS
3.1. Expression Landscape of LAMTOR3
Analysis of the expression of LAMTOR3 in various cancers using TIMER2.0 and UALCAN database showed that the expression of LAMTOR3 was lower in many cancers than in the corresponding normal tissues, including KIRC, bladder urothelial carcinoma (BLCA), colon adenocarcinoma (COAD), and head and neck squamous cell carcinoma (HNSC). However, LAMTOR3 was lower in normal tissue than in corresponding tumor tissue for cholangiocarcinoma (CHOL) and liver hepatocellular carcinoma (LIHC) (Figure 1A,B). The RNA‐seq data of KIRC in the UALCAN database showed that LAMTOR3 expression in KIRC tissues was significantly lower than in normal kidney tissues (p < 1E‐12) (Figure 1C). The GEPIA2 database showed that LAMTOR3 expression was high in normal kidney tissue but not statistically significant (Figure 1D). In addition, the verification of KIRC data in the GEO database showed that the expression of LAMTOR3 in the GSE53757 dataset was significantly lower than in normal tissue (p < .009) (Figure 1E). The Human Protein Atlas database showed that LAMTOR3 protein was mainly expressed in the glomerular cells of normal kidneys. LAMTOR3 protein was downregulated in KIRC compared with normal tissue (Figure 2A–C). Further, LAMTOR3 exhibited low‐expression levels in KIRC.
FIGURE 1.
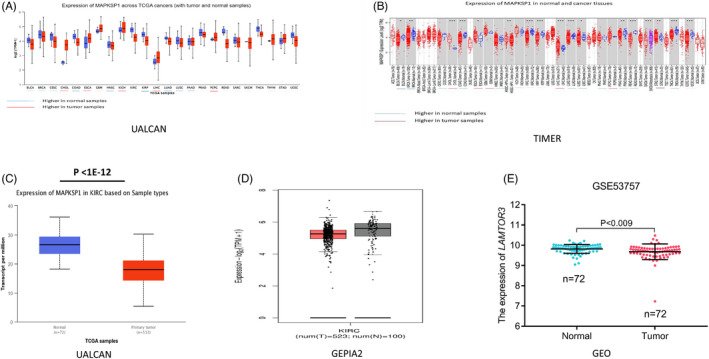
(A, B) Expression of LAMTOR3 in pan‐cancer. (C–E) The databases (UALCAN, GEPIA2, and GEO) showed that the LAMTOR3 expression was lower in the KIRC samples.
FIGURE 2.
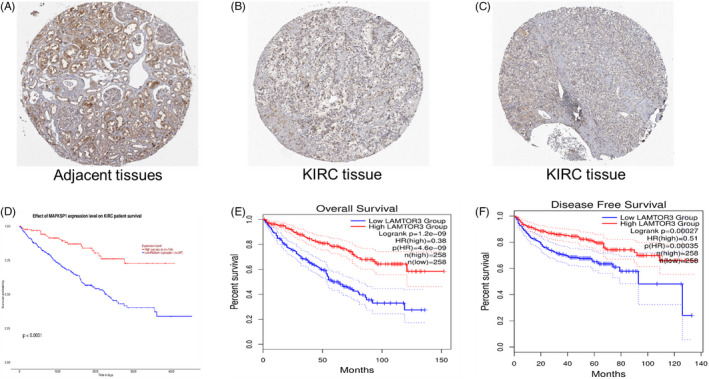
(A–C) It showed that the expression of LAMTOR3 was mainly concentrated in the glomerular cells of normal tissues, but it was low in KIRC. (D–F) Low expression of LAMTOR3 was significantly associated with poor prognosis.
3.2. The prognosis of LAMTOR3
UALCAN data analysis showed that low expression of LAMTOR3 was associated with poor prognosis (p < .001) (Figure 2D). The GEPIA2 database analysis showed that the expression of LAMTOR3 was correlated with the OS and DFS of KIRC. The overall survival of patients with low expression of LAMTOR3 was poor, and the prognosis of patients with high expression of LAMTOR3 was better [log‐rank p = 1.2e‐9, HR = 0.38, p (HR) = 4.6e‐9] (Figure 2E). Meanwhile, we found that the DFS of RCC patients with low expression of LAMTOR3 decreased significantly [log‐rank p = .00027, HR = 0.51, p (HR) = .00035] (Figure 2F). Overall, our findings showed that low expression of LAMTOR3 is associated with poor prognosis in patients with KIRC.
3.3. The relationship between LAMTOR3 expression and clinical features of KIRC
The expression of LAMTOR3 in KIRC patients was significantly lower than in normal subjects (p = 1.62E‐12, p < 1E‐12). However, there was no significant difference between the male and female groups (p > .05) (Figure 3A). The patients with KIRC were divided into four groups: 21–40, 41–60, 61–80, and 80–100 years old. LAMTOR3 expression in each group was significantly lower than in normal subjects (p = 1.62E‐12, 1.62E‐12, p < 1E‐12, p = 3.16E‐14). There was no significant difference among groups (p > .05) (Figure 3B). The patients with KIRC were divided into three groups: Caucasian, African Americans, and Asian. The expression level of LAMTOR3 in each group was significantly lower than in normal subjects (p = 1.63E‐12, 1.63E‐12, 4.96E‐7). There was no significant difference among groups (p > .05) (Figure 3C). LAMTOR3 expression was negatively correlated with the grade of KIRC (p < .05). There was no significant difference between grades 1 and 2 (p = .316) (Figure 3D). The expression of LAMTOR3 was correlated with the KIRC stage (Figure 3E). Finally, LAMTOR3 expression in CCA and CCB was significantly lower than normal renal tissues (p < 1E‐12, 1E‐12). CCB genotype KIRC was significantly lower than the CCA genotype (p = 1.763E‐4) (Figure 3F).
FIGURE 3.
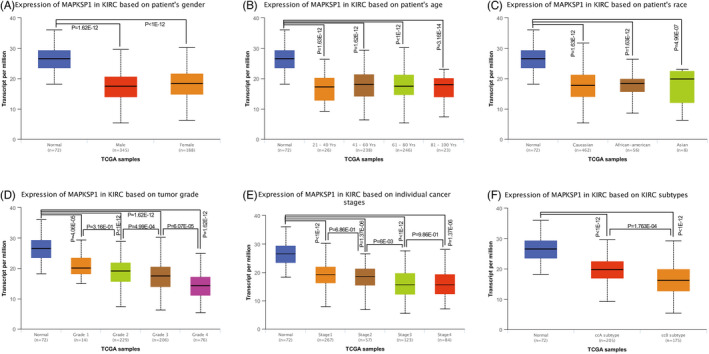
LAMTOR3 expression in different classifications. (A–C) There was no difference in LATMOR3 expression between the male and female. In addition, its expression was not different significantly among KIRC patients with different ages. There had also been no significant change in race (Caucasian, African Americans, and Asian). (D–F) Higher grade, stage, and CCB KIRC patients with lower expression of LATMOR3
3.4. Co‐expression and DGEs analysis
The results of co‐expression analysis showed a negative correlation between FBXO8 SCOC, SDHD, OCIAD1, UBE2D3, ARFIP1, and LAMTOR3. Moreover, TIMP1, SRM, BMP1, RIN1, and P3H1 exhibited a negative correlation (Figure 4A). In addition, a heatmap of the DEGs, including FGF23, EVX1, and KLK10, was generated (Figure 4B).
FIGURE 4.
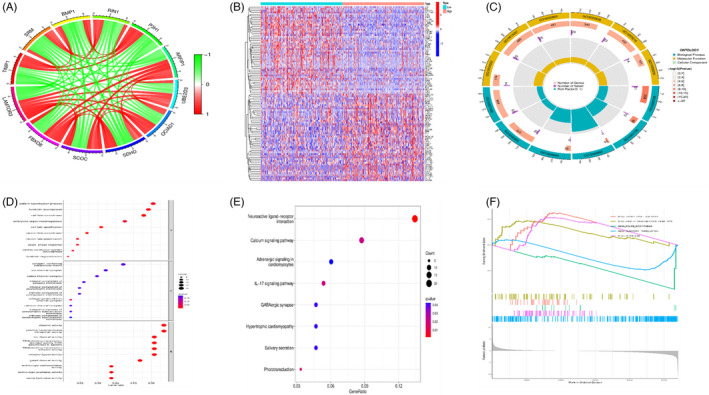
(A) Co‐expression analysis showed that FBXO8 SCOC, SDHD, OCIAD1, UBE2D3, and ARFIP1 were positively correlated with LAMTOR3. TIMP1, SRM, BMP1, RIN1, and P3H1 were negatively correlated with its expression. (B) DGEs analysis of LAMTOR3. (C–F) GO KEGG and GSEA predicted LAMTOR3‐related biological functions and pathways.
3.5. GO, KEGG, and GESA
GO analysis showed that LAMTOR3 was significantly enriched in biological processes such as cell fate commitment and specification and pattern specification process. In addition, DGEs were significantly enriched in molecular functions, including channel activity and passive transmembrane transporter activity (Table S1, Figure 4C,D). KEGG enrichment pathway analysis revealed neuroactive ligand–receptor interactions, IL‐17 signaling pathways, calcium signaling pathways, and other pathways (Table S2, Figure 4E). The GSEA analysis results showed that LAMTOR3 positively regulated citrate cycle, peroxisome, and drug metabolism cytochrome P450 (NES = 1.79, p = .0015; NES = 1.82, p < .001; NES = 1.57, p = .0019) and negatively regulated folate biosynthesis and olfactory transduction (NES = −1.71, p = .001; NES = −1.51, p < .001) (Figure 4F).
3.6. The significant correlation between LAMTOR3 and tumor‐infiltrating immune cells
To better understand the relationship between LAMTOR3 expression and tumor‐infiltrating immune cells, Timer 2.0 tool was used for analysis. There was a significant correlation between LAMTOR3 expression and different types of immune cells. The expression of LAMTOR3 was negatively correlated with the expression of CD8 T cells MCPCOUNTER (p = 7.29 e‐03), CD4 T cells XCELL (p = 3.55 e‐05), macrophages EPIC (p = 1.04 e‐05), and B cells XCELL (2.11 e‐02). (Figure 5A,C,E,G) However, it was positively correlated with CD8 T cells EPIC (p = 1.05e‐13), CD4 T cells EPIC (p = 2.04e‐25), macrophages TIMER (p = 1.65e‐09), and B cells QUANTISEQ (p = 1.18e‐03) (Figure 5B,D,F,H).
FIGURE 5.
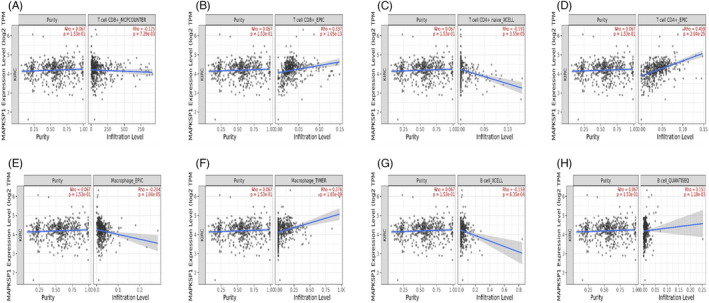
(A, C, E, G) Expression of LAMTOR3 was negatively correlated with the expression of CD8 T cells MCPCOUNTER, CD4 T cells XCELL, macrophages EPIC, and B cells XCELL. (B, D, F, H) CD8 T cells EPIC, CD4 T cells EPIC, macrophages TIMER, and B cells QUANTISEQ were positively correlated with it.
3.7. LAMTOR3 gene expression is downregulated in KIRC Tissues
In total, five pairs of KIRC and adjacent tissues were recruited in the current study, and the expression of LAMTOR3 protein was detected by hematoxylin and eosin staining and immunohistochemistry. During IHC staining, the brown color represented LAMTOR3‐positive IHC staining, and the staining density and intensity were lower in KIRC tissues than in normal renal tissues. Overall, our data indicated that LAMTOR3 protein is weakly expressed in human KIRC (Figure 6A–H).
FIGURE 6.
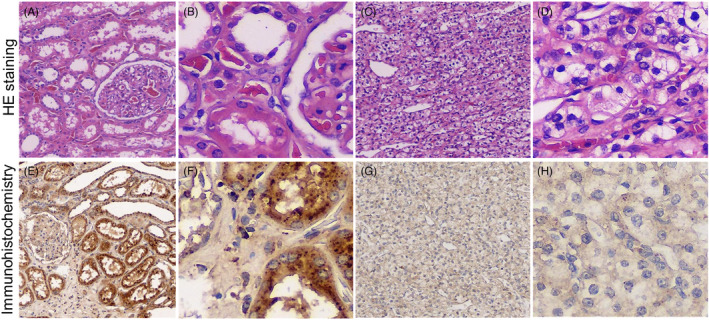
LAMTOR3 protein was detected in human KIRC tissues using immunohistochemistry assay. (A) HE staining of normal renal tissues (magnification ×10); (B) HE staining of normal renal tissues (magnification ×40); (C) HE staining of KIRC tissues (magnification ×10); (D) HE staining of KIRC tissues (magnification ×40). (E) Positive staining of LAMTOR3 in normal renal tissue (magnification ×10). (F) Positive staining of LAMTOR3 in normal renal tissues (magnification ×40). (G) Positive staining of LAMTOR3 in KIRC tissues (magnification ×10). (H) Positive staining of LAMTOR3 in KIRC tissues (magnification ×40).
4. DISCUSSION
Over the years, the role of LAMTOR3 in cancer has been gradually revealed. Current evidence suggests that PCNA‐associated factor (PAF) could promote the proliferation of pancreatic cancer cells via promoting the LAMTOR3 expression and the activation of the MAPK pathway. 16 Moreover, it has been shown that LAMTOR3/MAPK could participate in the chemotherapy resistance of lung cancer cells by inducing BCL‐2. 17 The interaction between LAMTOR3 and MAPK plays an important role in various cancers. Notably, apoptosis, the classical form of programmed death, is also regulated by LAMTOR3. MiR‐20a could promote breast cancer cell apoptosis by targeting LAMTOR3. 8 Interestingly, in recent years, noncoding RNAs have become increasingly important in regulating LAMTOR3. CircRNA is a potential diagnostic marker and therapeutic molecule for various diseases, especially cancer. Current evidence suggests that the CeRNA network composed of circRNA‐miRNA‐mRNA plays a key role in regulating carcinogenesis and development and regulates the biological characteristics of tumors. 18 Circ_0075829 has been found to regulate LAMTOR3 through the ceRNA network to promote pancreatic cancer progression, 7 suggesting that both ceRNA networks and noncoding RNAs (lncRNA, miRNA, and circRNA) can be further explored for cancer mechanisms based on LAMTOR3.
At present, there is still a lack of effective treatment for KIRC in clinical practice. Indeed, it is urgent to explore gene markers for gene‐targeted therapy to improve chemotherapy resistance and postsurgical recurrence rates. 19 LAMTOR3 has huge prospects as an important molecular marker for diagnosing and treating KIRC. First, the RNAseq data of KIRC from UALCAN, an online website based on the TCGA database, showed that LAMTOR3 expression was significantly lower in cancer tissues than in adjacent normal tissues. We then downloaded KIRC‐related gene chip data from the GEO database (dataset GSE53757), which confirmed the above results. In this study, the expression of LAMTOR3 was detected by immunohistochemical staining in five pairs of KIRC tumor tissues and normal tissues. The results showed that the expression of LAMTOR3 was significantly decreased in KIRC tissues and suggested that LAMTOR3 plays a regulatory role in the malignant progression of KIRC. Further analysis of the relationship between the expression level of LAMTOR3 and the clinicopathological features of KIRC showed that low expression of LAMTOR3 was closely related to the clinical stage, pathological grade, and race of patients with KIRC. Analysis of the effect of LAMTOR3 expression level on KIRC OS and DFS in the Gepia2 database showed that the low LAMTOR3 expression group had a worse prognosis and longer survival than the high expression group, suggesting that LAMTOR3 in bladder cancer plays a similar role of tumor suppressor genes, and its deletion or low expression will promote tumorigenesis and formation, suggesting that it may become new target for bladder cancer gene therapy.
The results of co‐expression analysis showed that FBXO8 was positively correlated with LAMTOR3. FBXO8 has been documented to inhibit the progression of colorectal cancer through ubiquitination of GSTP degradation. 20 Nonetheless, the role of FBXO8 in KIRC remains unknown. In the present study, we further explored its interaction with LAMTOR3. Intriguingly, it has been shown that BMP1 could promote the development of gastric cancer and reduce the survival time of patients. 21 This finding is consistent with our study's finding that LAMTOR3 is negatively correlated with BMP1. We also analyzed the molecular mechanisms of DEGs involved in LAMTOR3 by GO and KEGG and found that LAMTOR3 may be involved in channel activity, IL‐17 signaling pathways and calcium signaling pathways. Potassium channel activity has been revealed to regulate wnt/β‐catenin signaling and lead to the inhibition of breast cancer. 22 Recently, it was found that IL‐17RB could play a special role in promoting tumor proliferation and metastasis. 23 The calcium signaling pathway is reportedly involved in the tumor microenvironment (TME) and resistance to some anti‐cancer drugs. 24 Accordingly, we hypothesize that LAMTOR3 can suppress KIRC progression by modulating these signaling pathways. We found that the expression of LAMTOR3 in KIRC was also significantly correlated with immune cells, including CD8 + Tcell, CD4 + Tcell, macrophages, and B cells. The infiltration of immune cells suggests that LAMTOR3 could be used to treat cancer by regulating either the body's immune response or the tumor's immune escape. A limitation of this study is that analysis of LAMTOR3 expression in KIRC was based on data from TCGA and GEO databases; most subjects in TCGA were Caucasian, with a small sample of Asians, suggesting that racial discrepancies could lead to inconsistent results. Therefore, further studies are warranted to explore the role and molecular mechanism of LAMTOR3 in the progression of KIRC. LAMTOR3 may inhibit KIRC progression. LAMTOR3 may be regulated by miRNAs or other ncRNAs to inhibit the proliferation of KIRC cells. In addition, LAMTOR3 may regulate some classical cancer‐related pathways such as the PI3K/AKT, WNT, or MAPK pathways. The programmed cell death (PCD) is involved in the development of the tumor. LAMTOR3 may promote KIRC cells apoptosis. In addition, ferroptosis or autophagy processes may also be involved in it and deserve further validation. We examined the role of LAMTOR3 in KIRC from multiple perspectives.
In conclusion, our study showed that LAMTOR3 expression was significantly low in KIRC and correlated with clinical stage, pathological grade, and poor prognosis. This study revealed a hitherto undocumented potential diagnostic marker and gene therapy target for KIRC.
AUTHOR CONTRIBUTIONS
Z.L., Y.L. and L.D. conceptualized and designed the study. Y.G., Y.L., F.X. and Y.X. collected and assembled the data. All authors gave administrative support, analyzed and interpreted the data, wrote the article, and provided the study materials or patients, and also read and approved the final article.
FUNDING INFORMATION
This work was supported by General Program of Jiangxi Natural Science Foundation (20202BABL206100) and the Science and Technology Projects of Jiangxi Provincial Department of Education (GJJ190117).
CONFLICT OF INTEREST
The authors declare no competing financial interests.
Supporting information
Table S1
Table S2.
ACKNOWLEDGMENT
Not applicable.
Gong Y, Lv Y, Xu F, et al. LAMTOR3 is a prognostic biomarker in kidney renal clear cell carcinoma. J Clin Lab Anal. 2022;36:e24648. doi: 10.1002/jcla.24648
Yun Gong and Yue Lv have contributed equally to this work and share first authorship.
Contributor Information
Yinhui Lu, Email: 1307960615@qq.com.
Zan Liu, Email: liuzan@hrbmu.edu.cn.
Leihong Deng, 406521216109@email.ncu.edu.cn.
DATA AVAILABILITY STATEMENT
These data were derived from the following resources available in the public domain: GEPIA2 (http://gepia.cancer‐pku.cn/); TIMER2.0 (http://timer.cistrome.org/); UALCAN (http://ualcan.path.uab.edu/index.html); The Human Protein Atlas (https://www.proteinatlas.org/); GEO (https://www.NCBI.nlm.nih.gov/GEO/) and UCSC Xena (http://xena.ucsc.edu/).
REFERENCES
- 1. Gray RE, Harris GT. Renal Cell Carcinoma: Diagnosis and Management. Am Fam Physician. 2019;99(3):179‐184. [PubMed] [Google Scholar]
- 2. Wettersten HI, Aboud OA, Lara PN Jr, Weiss RH. Metabolic reprogramming in clear cell renal cell carcinoma. Nat Rev Nephrol. 2017;13(7):410‐419. [DOI] [PubMed] [Google Scholar]
- 3. Vuong L, Kotecha RR, Voss MH, Hakimi AA. Tumor microenvironment dynamics in clear‐cell renal cell carcinoma. Cancer Discov. 2019;9(10):1349‐1357. [DOI] [PMC free article] [PubMed] [Google Scholar]
- 4. Kumar A, Kumari N, Gupta V, Prasad R. Renal cell carcinoma: molecular aspects. Indian J Clin Biochem. 2018;33(3):246‐254. [DOI] [PMC free article] [PubMed] [Google Scholar]
- 5. Gul A, Rini BI. Adjuvant therapy in renal cell carcinoma. Cancer. 2019;125(17):2935‐2944. [DOI] [PubMed] [Google Scholar]
- 6. Teis D, Taub N, Kurzbauer R, et al. p14‐MP1‐MEK1 signaling regulates endosomal traffic and cellular proliferation during tissue homeostasis. J Cell Biol. 2006;175(6):861‐868. [DOI] [PMC free article] [PubMed] [Google Scholar]
- 7. Zhang X, Xue C, Cui X, et al. Circ_0075829 facilitates the progression of pancreatic carcinoma by sponging miR‐1287‐5p and activating LAMTOR3 signalling. J Cell Mol Med. 2020;24(24):14596‐14607. [DOI] [PMC free article] [PubMed] [Google Scholar]
- 8. Shi KY, Fan LY, Xu D, et al. MiR‐20a suppresses proliferation and facilitates apoptosis of breast cancer cells via the MTOR signaling pathway. Eur Rev Med Pharmacol Sci. 2020;24(22):11650‐11657. [DOI] [PubMed] [Google Scholar]
- 9. Chandrashekar DS, Bashel B, Balasubramanya SAH, et al. UALCAN: a portal for facilitating tumor subgroup gene expression and survival analyses. Neoplasia. 2017;19(8):649‐658. [DOI] [PMC free article] [PubMed] [Google Scholar]
- 10. Li T, Fu J, Zeng Z, et al. TIMER2.0 for analysis of tumor‐infiltrating immune cells. Nucleic Acids Res. 2020;48(W1):W509‐W514. [DOI] [PMC free article] [PubMed] [Google Scholar]
- 11. Tang Z, Kang B, Li C, Chen T, Zhang Z. GEPIA2: an enhanced web server for large‐scale expression profiling and interactive analysis. Nucleic Acids Res. 2019;47(W1):W556‐W560. [DOI] [PMC free article] [PubMed] [Google Scholar]
- 12. von Roemeling CA, Radisky DC, Marlow LA, et al. Neuronal pentraxin 2 supports clear cell renal cell carcinoma by activating the AMPA‐selective glutamate receptor‐4. Cancer Res. 2014;74(17):4796‐4810. [DOI] [PMC free article] [PubMed] [Google Scholar]
- 13. Liu XX, Liu FJ. Novel bioinformatic identification of differentially expressed tissue‐specific and cancer‐related proteins from the human protein atlas for biomarker discovery. Genet Mol Res. 2015;14(2):4557‐4565. [DOI] [PubMed] [Google Scholar]
- 14. Hao J, Cao Y, Yu H, Zong L, An R, Xue Y. Effect of MAP3K8 on prognosis and tumor‐related inflammation in renal clear cell carcinoma. Front Genet. 2021;12:674613. [DOI] [PMC free article] [PubMed] [Google Scholar]
- 15. Peng S, Yang S, Bo X, Li F. paraGSEA: a scalable approach for large‐scale gene expression profiling. Nucleic Acids Res. 2017;45(17):e155. [DOI] [PMC free article] [PubMed] [Google Scholar]
- 16. Jun S, Lee S, Kim HC, et al. PAF‐mediated MAPK signaling hyperactivation via LAMTOR3 induces pancreatic tumorigenesis. Cell Rep. 2013;5(2):314‐322. [DOI] [PMC free article] [PubMed] [Google Scholar]
- 17. Kwon OS, Hong SK, Kwon SJ, Go YH, Oh E, Cha HJ. BCL2 induced by LAMTOR3/MAPK is a druggable target of chemoradioresistance in mesenchymal lung cancer. Cancer Lett. 2017;403:48‐58. [DOI] [PubMed] [Google Scholar]
- 18. Liang ZZ, Guo C, Zou MM, Meng P, Zhang TT. circRNA‐miRNA‐mRNA regulatory network in human lung cancer: an update. Cancer Cell Int. 2020;20:173. [DOI] [PMC free article] [PubMed] [Google Scholar]
- 19. Craven RA, Vasudev NS, Banks RE. Proteomics and the search for biomarkers for renal cancer. Clin Biochem. 2013;46(6):456‐465. [DOI] [PubMed] [Google Scholar]
- 20. FeiFei W, HongHai X, YongRong Y, et al. FBX8 degrades GSTP1 through ubiquitination to suppress colorectal cancer progression. Cell Death Dis. 2019;10(5):351. [DOI] [PMC free article] [PubMed] [Google Scholar]
- 21. Hsieh YY, Tung SY, Pan HY, et al. Upregulation of bone morphogenetic protein 1 is associated with poor prognosis of late‐stage gastric cancer patients. BMC Cancer. 2018;18(1):508. [DOI] [PMC free article] [PubMed] [Google Scholar]
- 22. Breuer EK, Fukushiro‐Lopes D, Dalheim A, et al. Potassium channel activity controls breast cancer metastasis by affecting β‐catenin signaling. Cell Death Dis. 2019;10(3):180. [DOI] [PMC free article] [PubMed] [Google Scholar]
- 23. Wu HH, Tsai LH, Huang CK, et al. Characterization of initial key steps of IL‐17 receptor B oncogenic signaling for targeted therapy of pancreatic cancer. Sci Transl Med. 2021;13(583):eabc2823. [DOI] [PubMed] [Google Scholar]
- 24. Roberts‐Thomson SJ, Chalmers SB, Monteith GR. The calcium‐signaling toolkit in cancer: remodeling and targeting. Cold Spring Harb Perspect Biol. 2019;11(8):a035204. [DOI] [PMC free article] [PubMed] [Google Scholar]
Associated Data
This section collects any data citations, data availability statements, or supplementary materials included in this article.
Supplementary Materials
Table S1
Table S2.
Data Availability Statement
These data were derived from the following resources available in the public domain: GEPIA2 (http://gepia.cancer‐pku.cn/); TIMER2.0 (http://timer.cistrome.org/); UALCAN (http://ualcan.path.uab.edu/index.html); The Human Protein Atlas (https://www.proteinatlas.org/); GEO (https://www.NCBI.nlm.nih.gov/GEO/) and UCSC Xena (http://xena.ucsc.edu/).