Abstract
The high prevalence of oral squamous cell carcinoma (OSCC) in South Asia is associated with habitual areca nut chewing. Arecoline, a primary active carcinogen within areca nut extract, is known to promote OSCC pathological development. Dysregulation of N6‐methyladenosine (m6A) modification has begun to emerge as a significant contributor to cancer development and progression. However, the biological effects and molecular mechanisms of m6A modification in arecoline‐promoted OSCC malignance remain elusive. We reveal that chronic arecoline exposure substantially induces upregulation of fat mass and obesity‐associated protein (FTO), MYC, and programmed cell death‐ligand 1 (PD‐L1) in OSCC cells. Moreover, upregulation of PD‐L1 is observed in OSCC cell lines and tissues and is associated with areca nut chewing in OSCC patients. We also demonstrate that arecoline‐induced FTO promotes the stability and expression levels of PD‐L1 transcripts through mediating m6A modification and MYC activity, respectively. PD‐L1 upregulation confers superior cell proliferation, migration, and resistance to T‐cell killing to OSCC cells. Blockage of PD‐L1 by administration of anti‐PD‐L1 antibody shrinks tumor size and improves mouse survival by elevating T‐cell‐mediated tumor cell killing. Therefore, targeting PD‐L1 might be a potential therapeutic strategy for treating PD‐L1‐positive OSCC patients, especially those with habitual areca nut chewing.
Keywords: arecoline, FTO, oral carcinoma, PD‐L1, tumor immunology
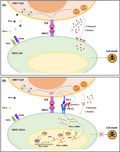
PD‐L1 expression is upregulated in arecoline‐exposed OSCC cell lines and tissues and is associated with areca nut exposure. FTO promotes the stability and expression levels of PD‐L1 transcripts through modulating m6A modification and MYC, respectively. PD‐L1 enhances OSCC proliferation and immune escape, and blockage of PD‐L1 attenuates OSCC tumorigenesis and prolongs mice survival.
1. INTRODUCTION
Oral squamous cell carcinomas (OSCC) are one of the most lethal cancers, with a 5‐year survival rate of around 50%. 1 The incidence of oral cancer is considerably high in Southeast Asia, accounting for 9%–40% of all malignancies compared to 2%–4% in Western countries (e.g., the United States of America and the United Kingdom). Chronic carcinogen exposure, such as smoking, alcohol consumption, and areca nut chewing, is closely related to oral cancer carcinogenesis. The fact that smoking and alcohol consumption are common habits worldwide and areca nut chewing is highly prevalent in Southeast Asia indicates a close link of areca nut chewing with OSCC occurrence. 2 Numerous studies have demonstrated that areca nut exposure can induce malignant transformation of normal oral tissues. 3 Arecoline is the main alkaloid of areca nut and is known as a potent carcinogen. Arecoline promotes 4‐nitroquinoline 1‐oxide (4‐NQO)‐induced oral tumorigenesis in C57BL/6JNarl mice. 4 Arecoline treatment induces upregulation of αvβ6 integrin, alpha‐smooth muscle actin (α‐SMA), and collagen, leading to oral submucosal fibrosis formation. 5 However, the detailed mechanism by which arecoline promotes OSCC transformation and progression still needs to be elucidated.
N6‐methyladenosine (m6A) is the most prevalent modification of mammalian RNA. Recent studies revealed that m6A modification in mRNA or non‐coding RNA plays critical roles in the regulation of cell death and differentiation, stem cell pluripotency, tissue development, and cancer tumorigenesis and progression. 6 , 7 , 8 M6A modification determines RNA fate and function by affecting mRNA stability, splicing, translation, and localization. M6A modification is catalyzed by multicomponent RNA methyltransferases, demethylase complexes, and m6A readers. 9 , 10 , 11 , 12 FTO, the first identified RNA demethylase, acts as an eraser of m6A on target transcripts. Emerging evidence demonstrates that FTO is robustly associated with cancer initiation, development, and progression. Upregulation of FTO has been identified in various cancer tissues, including leukemia, 13 breast cancer, 14 non‐small cell lung cancer, 15 hepatocellular carcinoma, 16 gastric cancer, 17 and glioblastoma. 18 Li et al 13 were the first to report that upregulated FTO plays an oncogenic role in acute myeloid leukemia through m6A modification. Several FTO inhibitors, such as R‐2‐hydroxyglutarate (R‐2HG), FB23, and FB23‐2, exert potent anti‐leukemic activity both in vitro and in vivo. 19 , 20
In a previous study, we described how FTO upregulation is pivotal for arecoline‐treated OSCC acquiring malignant phenotypes, 21 but the underlying molecular mechanism is unknown. In the current study, we aim to identify the critical mRNA target of FTO and to explore a potential targeted therapy to treat arecoline‐induced OSCC.
2. MATERIALS AND METHODS
2.1. Patient samples
Fifty‐eight OSCC tissues and 18 normal tissues (oral mucosa tissues) were collected in the Foshan Stomatology Hospital and Chenzhou No. 1 People’s Hospital from 2015 to 2020. Among 58 OSCC tissues, 28 OSCC tissues were obtained from patients with areca nut chewing habits, and 30 OSCC tissues were from patients who never chewed areca nut. All tissues were stained with H&E and were independently examined by two pathologists. All patients provided written informed consent, and the experimental procedures were approved by the Institutional Review Board of the Ethics Committee of the Foshan Stomatology Hospital.
2.2. RNA‐Seq assay and data analysis
RNA‐Seq was performed by Cloudseq Biotech (Shanghai, China) according to the procedure published previously. 22 The expression profiles of mRNA and differentially expressed mRNAs were defined as fold changes >2 and P‐value < 0.05.
2.3. Gene‐specific m6A quantitative PCR
Total RNA was extracted from cells using RNeasy kit (QIAGEN). Total mRNA was purified using TurboCapture mRNA Kits (Qiagen, CA, USA) following the manufacturer’s protocol. 1 µg mRNA was sonicated into around 200 nt fragments, and 5% of sheared mRNA was used for input. The m6A containing mRNA fragments were further enriched using an EpiMark N6‐Methyladenosine Enrichment Kit (New England Biolabs, MA, USA) according to the manufacturer’s instructions. The purified m6A containing mRNA was subjected to quantitative PCR (qPCR) analysis. The house‐keep gene HPRT1 was used as the internal control. The primer sequences are listed in Table S1.
2.4. RNA stability assays
Cells were seeded in a six‐well plate. The actinomycin D (SKU:02104658‐CF, MP Biomedicals, CA, USA), an mRNA transcriptional inhibitor, was added into the wells, and cells were collected at 0 h, 2 h, 4 h, and 6 h after treatment. Total RNA was extracted from cells using an RNeasy Kit (QIAGEN). The purified mRNA was subjected to qPCR analysis. The house‐keep gene HPRT1 was used as the internal control.
2.5. Real‐time cancer cell viability assessment using the CardioExcyte 96
For real‐time recording of cancer cell viability in co‐culture system, we adapted a non‐invasive, label‐free, and real‐time cellular impedance monitoring technology (CardioExcyte 96 system).
To analyze the killing of OSCC cells by activated CD8+ T‐cells, single suspended OSCC cells were seeded in an NSP‐96 plate mixed with or without IgG or anti‐PD‐L1 antibody. On the next day, activated human or mouse CD8+ T‐cells were added into each well containing targeted OSCC cells at an effector to target (E:T) ratio of 1:1. After that, we centrifuged the NSP‐96 plate for 15 min at 800 rpm and kept the plate in the incubator for 2 h. Then, the NSP‐96 plate was put on top of the CardioExcyte 96 cell impedance recording machine. The cell impedance value of each well was recorded at 3‐h intervals for at least 72 h. The cell culture medium alone was used as the background impedance value. For cell impedance curve generation, the cell impedance values from each group were normalized to the starting point of each group.
2.6. Mouse tumorigenesis and treatment
Wild‐type C57BL/6 mice aged 6 weeks were purchased from Guangdong Medical Science Experiment Center. MOC1‐A (5 × 10⁶, mixed with 100 µL Matrigel) were injected into the right flank of mice. Seven days post‐injection, MOC1‐A‐bearing mice were randomized into a control group (n = 10) and a treatment group (n = 10). Mice were then treated with intraperitoneal injection of isotype control IgG antibody (BioXCell, clone 2A3) (control group) or anti‐PD‐L1 antibody (200 µg, BioXCell, clone RMP1‐14) twice per week for a total of 10 injections. Tumor size was measured twice per week using a caliper, and tumor volume was calculated using the following formula: tumor volume (mm3) = width2 × length/2. Animal experiments were performed in accordance with the National Institutes of Health Guide for the Care and Use of Laboratory Animals and with the 1964 Declaration of Helsinki and its later amendments. The animal experimental protocol was approved by the Ethics Committee of the Foshan Stomatology Hospital.
2.7. Statistical analyses
Statistical analyses were carried out using GraphPad Prism software version 7. Student’s t‐test was used for determining the significance between two groups. Pearson correlation was applied to study the correlation between PD‐L1 and FTO as well as PD‐L1 and MYC in OSCC tissues. The correlations between PD‐L1 expression levels and clinicopathologic parameters were analyzed using the Mann–Whitney U‐test when comparing the differences between two groups and using the Kruskal–Wallis test when comparing the differences among three groups. Animal survival curves were constructed using the Kaplan–Meier method. P < 0.05 was considered statistically significant.
3. RESULTS
3.1. Programmed cell death‐ligand 1 is upregulated in arecoline‐exposure oral squamous cell carcinoma cell lines
Our previous study demonstrated that chronic low‐dose arecoline‐treated OSCC cell lines (hereinafter referred to as CAL27‐A and SCC25‐A) exhibit superior tumorigenic effects to original OSCC cell lines (CAL27 and SCC25), and FTO plays a vital role in chronic arecoline‐exposure‐promoted oncogenicity of OSCC cells. 21 To elucidate the potential molecular mechanism underlying arecoline‐promoted oral cancer malignance, we conducted an RNA‐seq transcriptome assay using CAL27‐A and CAL27 cells. A total of 188 genes and 370 genes were significantly (P < 0.05 and fold change >2 or <0.5) upregulated and downregulated in arecoline‐treated CAL27 (CAL27‐A) compared to CAL27, respectively (Figure 1A). The top 15 most upregulated genes are shown in Figure 1B. The upregulation of several genes (e.g., ALDH1A3, PD‐L1, B2 M, CCL5, and MYC) was further verified by RT‐qPCR assay, confirming the RNA‐seq transcriptome results (Figure 1C). Upregulation of PD‐L1 and MYC in CAL27‐A was also confirmed by Western blotting assay (Figure 1D). The fact that arecoline induces MYC upregulation has been reported previously. 23 However, the biological function role of PD‐L1 in arecoline‐exposure OSCC is unknown. Therefore, the PD‐L1 gene was chosen for further study.
FIGURE 1.
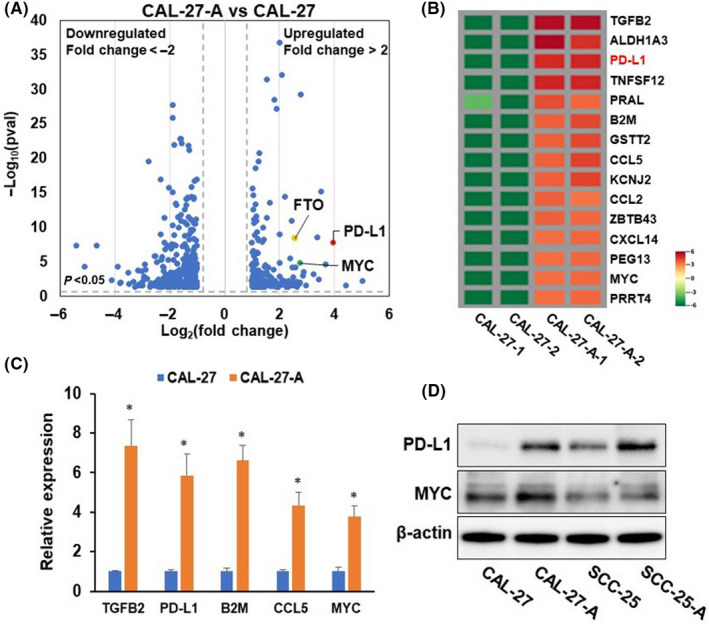
Programmed cell death‐ligand 1 (PD‐L1) is upregulated in chronic arecoline‐treated oral squamous cell carcinoma (OSCC) cells. (A) Volcano plot of RNA‐seq transcriptome data displaying the pattern of gene expression values for CAL27‐A to CAL‐27. Significantly differentially expressed genes are shown (P < 0.05, and fold change < −2 or >2). (B) Heatmap showing levels of top 15 significantly upregulated genes in CAL‐27‐A compared to CAL‐27. (C) The mRNA levels of indicated genes were determined by RT‐qPCR assay. (D) The protein levels of PD‐L1 and MYC were tested by western blot assay. *P < 0.05
3.2. Programmed cell death‐ligand 1 is upregulated in oral squamous cell carcinoma tissues and is associated with areca nut chewing habit
To investigate the expression profile of PD‐L1 in oral cancer, we first measured PD‐L1 expression in three OSCC cell lines and one normal oral keratinocyte (NHOK). Upregulation of PD‐L1 mRNA and protein levels was observed in all OSCC cell lines compared to normal oral keratinocytes (Figure 2A and B). Next, we analyzed The Cancer Genome Atlas (TCGA; http://software.broadinstitute.org/software/igv/tcga) databases, and we found that PD‐L1 mRNA levels are substantially enhanced in head and neck squamous cell carcinoma (HNSCC) tumor samples (n = 519) when compared with that in normal tissues (n = 44) (Figure 2C). Furthermore, we assessed PD‐L1 expression in 18 normal tissues (oral mucosa tissues) from healthy donors without an areca nut chewing habit and 58 OSCC tumor samples collected from OSCC patients, in which 28 patients had areca nut chewing habits. As illustrated in Figure 2D and E, PD‐L1 mRNA and protein levels were notably higher in OSCC tumor samples than in healthy tissues. More importantly, the PD‐L1 levels were markedly upregulated in OSCC samples with areca nut exposure compared to OSCC samples without areca nut exposure. These data implied that PD‐L1 might play a critical role in oral cancer development. Further investigation of the correlation of PD‐L1 expression with clinicopathologic parameters of OSCC patients revealed that PD‐L1 levels were associated with areca nut chewing habits and aggressive local or distant invasion and metastasis but were not related to other clinical‐pathological characteristics, such as gender, age, tumor stage, and nodal stage (Figure 2F). Moreover, PD‐L1 expression levels were positively correlated with FTO expression levels in OSCC tissues, suggesting that FTO may regulate PD‐L1 expression (Figure 2G).
FIGURE 2.
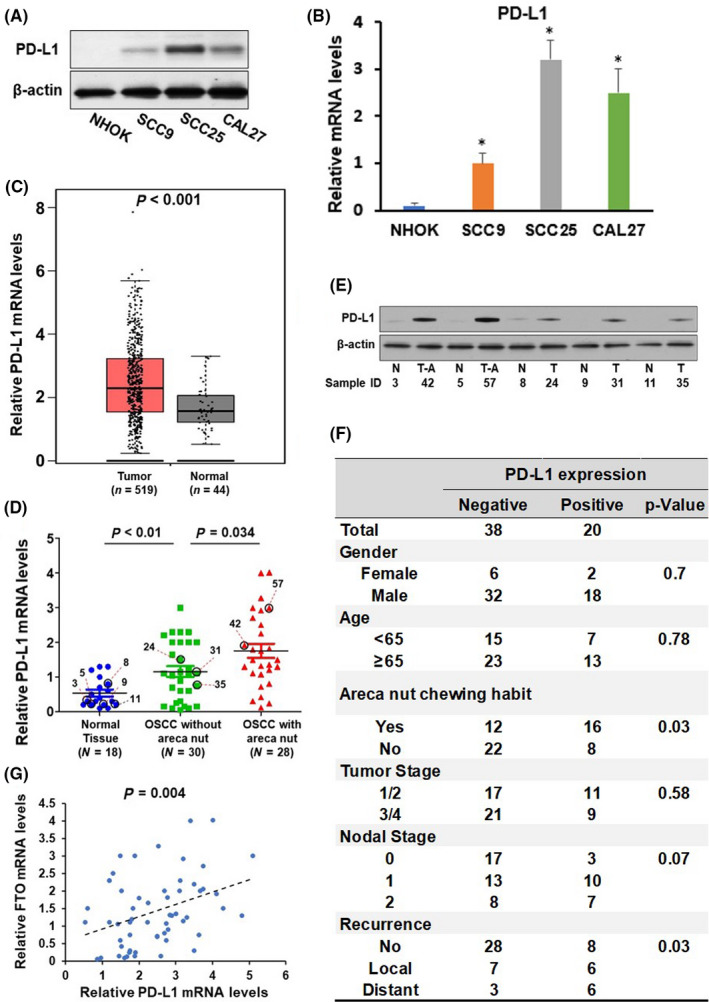
Upregulation of programmed cell death‐ligand 1 (PD‐L1) is associated with areca nut chewing habits and is correlated with fat mass and obesity‐associated protein (FTO) expression. (A–B) The protein (A) and mRNA (B) levels of PD‐L1 in NHOK, SCC9, CAL27, SCC25, and HSC2 cells were detected by western blotting and RT‐qPCR assay, respectively. (C) The expression levels of PD‐L1 in normal tissues (n = 44) and head and neck squamous cell carcinoma (HNSCC) tissues (n = 519) were compared and presented. (D) The expression levels of PD‐L1 in normal oral tissues (n = 18), oral squamous cell carcinoma (OSCC) without areca nut (n = 30), and oral squamous cell carcinoma (OSCC) with areca nut (n = 28) were determined by RT‐qPCR assay. (E) Representative of western blotting images showing expression of PD‐L1 and β‐actin in normal oral tissues (N), OSCC without areca nut (T), and OSCC with areca nut (T‐A). Sample IDs are shown (D and E). (F) The association between PD‐L1 expression and clinical parameters in 58 OSCC patients. (G) The correlation of FTO and PD‐L1 in 58 OSCC patients were analyzed by Pearson correlation analysis. *P < 0.05
3.3. Programmed cell death‐ligand 1 is a target gene of fat mass and obesity‐associated protein
We hypothesized that FTO augmentation is responsible for tFhe upregulation of PD‐L1 in arecoline‐treated OSCC cells. To verify this hypothesis, CAL27‐A and SCC25‐A were transduced with lentivirus carrying two individual shRNA (sh‐FTO‐1 or sh‐FTO‐2) or non‐sense control shRNA (sh‐NC). Knockdown of FTO dramatically reduced the expression levels PD‐L1 and MYC (Figure 3A). MYC, a well‐established target of FTO, was used as a positive control in the current study. 19 In contrast, forcing FTO expression promoted PD‐L1 and MYC levels in CAL27 and SCC25 cells (Figure 3B). Because of the comparable knockdown effect of sh‐FTO‐1 and sh‐FTO‐2, sh‐FTO‐1 was used in the following experiments.
FIGURE 3.
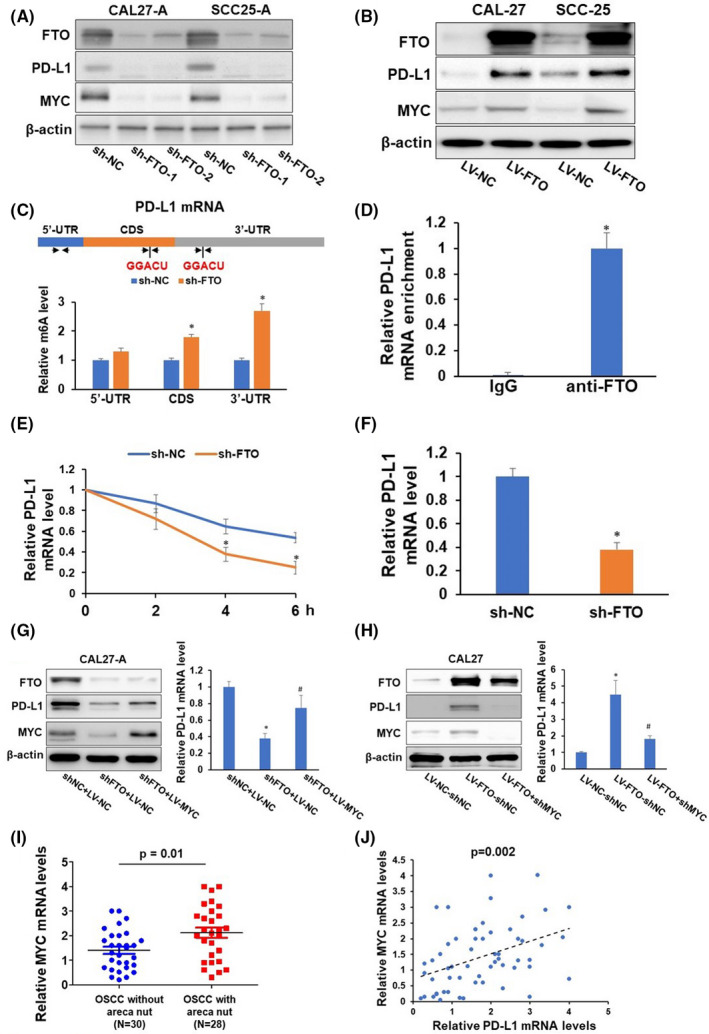
Fat mass and obesity‐associated protein (FTO) regulates programmed cell death‐ligand 1 (PD‐L1) via m6A modification and MYC‐mediated transcription. (A–B) CAL27‐A and SCC25‐A were infected with lentivirus carrying sh‐nonsense control (NC), sh‐FTO‐1, or sh‐FTO‐2 (A). CAL27 and SCC25 were infected with lentivirus carrying nonsense control (NC or FTO. The expression levels of FTO, PD‐L1, MYC, and β‐actin in these cells were determined by western blotting. (C) Two consensus m6A modification sites (GGACU) and three sets of quantitative (qPCR) primers are depicted in the 5′‐UTR, CDS, and 3′‐UTR regions of PD‐L1 mRNA. Methylated RNA in CAL‐27‐A cells with or without FTO knockdown was immunoprecipitated with the m6A antibody, followed by qPCR analyses with three sets of indicated primers. (D) RNA immunoprecipitation analyses of CAL27‐A cells were performed with an anti‐FTO antibody followed by qPCR analyses of PD‐L1 mRNA. (E–F) qPCR analyses of PD‐L1 mRNA stability (E) and mRNA level (F) in CAL‐27‐A cells with or without FTO knockdown. (G–H) CAL27‐A‐shNC cells or CAL27‐A‐shFTO cells were infected with indicated lentiviruses. The expression levels of FTO, PD‐L1, MYC, and β‐actin in these cells were determined by western blotting. The mRNA levels of PD‐L1 were assessed by RT‐qPCR. (I) The expression levels of MYC in oral squamous cell carcinoma (OSCC) without areca nut (n = 30), and OSCC with areca nut (n = 28) were determined by RT‐qPCR assay. (J) The correlation of MYC and PD‐L1 in 58 OSCC patients was analyzed by Pearson correlation analysis. *P < 0.05
Previous studies demonstrated that m6A modification typically occurs within the consensus motif (GGACU). 24 We identified two GGACU motifs located within coding sequence (CDS) and 3′‐untranslation region (3′UTR) regions of the transcript of PD‐L1. Three sets of primers were designed with two sets of primers flanked by the GGACU motif within CDS and 3′UTR regions, and one set of primers covered a region within the 5′UTR region. Methylated RNA immunoprecipitation with m6A antibody followed by PD‐L1‐specific qPCR analysis showed that the m6A levels were substantially increased in the CDS and 3′UTR regions of PD‐L1 transcripts following FTO depletion (Figure 3C). Furthermore, PD‐L1 mRNA was enriched in anti‐FTO antibody immunoprecipitated complex (Figure 3D). These results suggested that FTO binds to PD‐L1 mRNA, leading to a reduced m6A level of PD‐L1 mRNA. Since m6A modification profoundly affects mRNA stability and translation, we measured the PD‐L1 mRNA stability on CAL27‐A and SCC25‐A cells with or without FTO depletion. As illustrated in Figure 3E and F, FTO silencing decreased the mRNA stability of PD‐L1, leading to reduced PD‐L1 mRNA levels in CAL27‐A and SCC25‐A cells. These results indicate that FTO depletion enhanced m6A modification of PD‐L1 mRNA, leading to an accelerated RNA decay.
Fat mass and obesity‐associated protein has been shown to stabilize MYC mRNA and promote MYC expression by reducing m6A methylation of MYC in leukemia, 13 glioma, 25 cervical cancer, and gastric cancer cells. 26 Intriguingly, MYC is a cis‐acting transcriptional factor for PD‐L1 gene. 27 Therefore, we proposed that MYC also plays a critical role in FTO‐mediated PD‐L1 expression. Indeed, exogenous expression of MYC partially restored FTO‐depletion suppressed PD‐L1 expression, and knockdown of MYC blocked FTO‐induced PD‐L1 expression (Figure 3G and H). Notably, MYC mRNA levels were substantially upregulated in OSCC samples with areca nut exposure compared to OSCC samples without areca nut exposure (Figure 3I). More importantly, MYC mRNA levels were positively correlated with PD‐L1 mRNA levels in OSCC samples (Figure 3J). These results further confirmed that areca nut exposure induces MYC expression, and MYC positively mediates PD‐L1 expression. Collectively, these results prove that FTO can regulate PD‐L1 expression through m6A modification‐mediated PD‐L1 mRNA stability or MYC‐regulated PD‐L1 mRNA transcription.
3.4. Programmed cell death‐ligand 1 promotes oral squamous cell carcinoma cell proliferation, migration, and resistance to T‐cell killing
To assess the biological function of PD‐L1 in oral cancer cells, we applied gain‐ or loss‐of‐function analysis. As presented in Figure 4A–D, depletion of PD‐L1 suppressed cell proliferation and migration of CAL27‐A and SCC25‐A cells, whereas overexpression of PD‐L1 promoted cell proliferation and migration of CAL‐27 and SCC25 cells. These results suggested that arecoline‐induced PD‐L1 conferred cell growth and mobility advantages on oral cancer cells.
FIGURE 4.
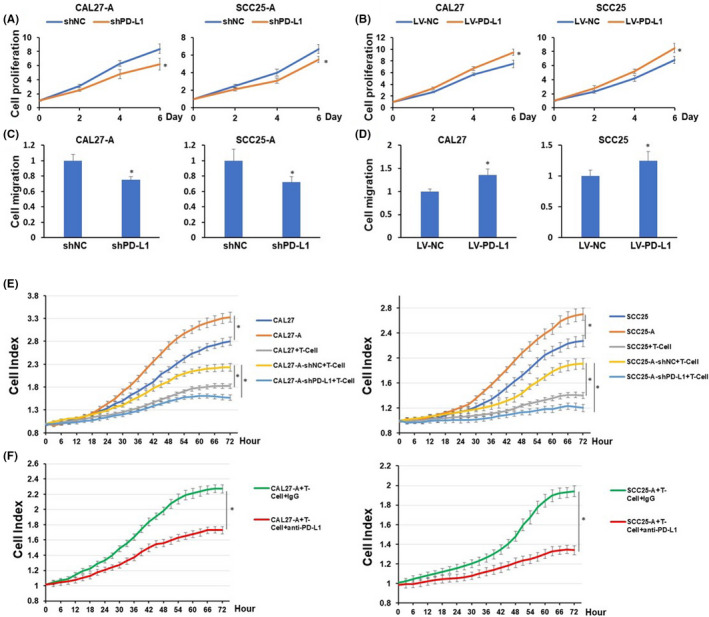
Programmed cell death‐ligand 1 (PD‐L1) depletion decreases cell proliferation, migration, and resistance to T‐cell killing of oral squamous cell carcinoma (OSCC). CAL27‐A and SCC25‐A cells with or without PD‐L1 depletion or CAL27 and SCC25 with or without PD‐L1 overexpression were subjected to cell proliferation assessment (A and B) and cell migration analysis (C and D). (E–F) CAL27, CAL27‐A, or CAL27‐A‐shPD‐L1 (left) or SCC25, SCC25‐A, or SCC25‐A‐shPD‐L1 (right) were cocultured with or without activated CD8 T cells at E:T ratio at 1:1 (E). CAL27‐A (left) or SCC25‐A (right) and CD8 T cell coculture (E:T ratio at 1:1) were treated with IgG or atezolizumab (F). Cell index curve of each group was generated using the CardioExcyte 96 system. *P < 0.05
Programmed cell death‐ligand 1 is known to play a pivotal role in T‐cell cytotoxicity to cancer cells. Therefore, we utilized cancer cells and the T‐cell co‐culture system to investigate the effects of PD‐L1 on T‐cell‐mediated OSCC apoptosis. The cell viability of OSCC was dynamically monitored using the CardioExcyte system. The cell growth curve for OSCC cells was reflected by the cell index curve. As exhibited in Figure 4E, arecoline‐treated OSCC cell lines exhibited more resistance to activated CD8 T‐cell killing than OSCC cell lines. Depletion of PD‐L1 significantly sensitized arecoline‐treated OSCC cell lines to CD8 T‐cell killing. Similarly, atezolizumab, an FDA‐approved anti‐PD‐L1 antibody, markedly enhanced CD8 T‐cell killing of arecoline‐treated OSCC cell lines (Figure 4F). These data suggested that arecoline‐induced PD‐L1 conferred immune escape ability to OSCC cell lines.
3.5. Programmed cell death‐ligand 1 enhances mouse oral squamous cell carcinoma cell proliferation, migration, and resistance to T‐cell killing
To further study the functional roles of PD‐L1 in arecoline‐exposure OSCC cell lines and explore potential treatment strategies for oral cancer patients with areca nut chewing habits, MOC1 and MOC2 cell lines were employed to establish chronic arecoline‐treated mouse oral cancer cell lines. After being treated with arecoline (1 µM) for 90 days, the arecoline‐exposure MOC1 and MOC2 were referred to as MOC1‐A and MOC2‐A, respectively. Consistent with our previous findings in arecoline‐exposure human OSCC cell lines, upregulation of mRNA and protein levels of PD‐L1 and FTO were observed in MOC1‐A and MOC2‐A compared to MOC1 and MOC2 (Figure S1A and B). Notably, the cell proliferation and migration were significantly enhanced in MOC1‐A and MOC2‐A when compared with MOC1 and MOC2, respectively (Figure S1C and D). Knockdown of PD‐L1 substantially reduced cell proliferation and migration of MOC1‐A and MOC2‐A cells (Figure 5A and B). Similarly, MOC1‐A and MOC2‐A were more resistant to activated T‐cell‐mediated apoptosis, and this effect was abolished by knockdown of PD‐L1 or treated with anti‐PD‐L1 mouse monoclonal antibody (Figure 5C and D).
FIGURE 5.
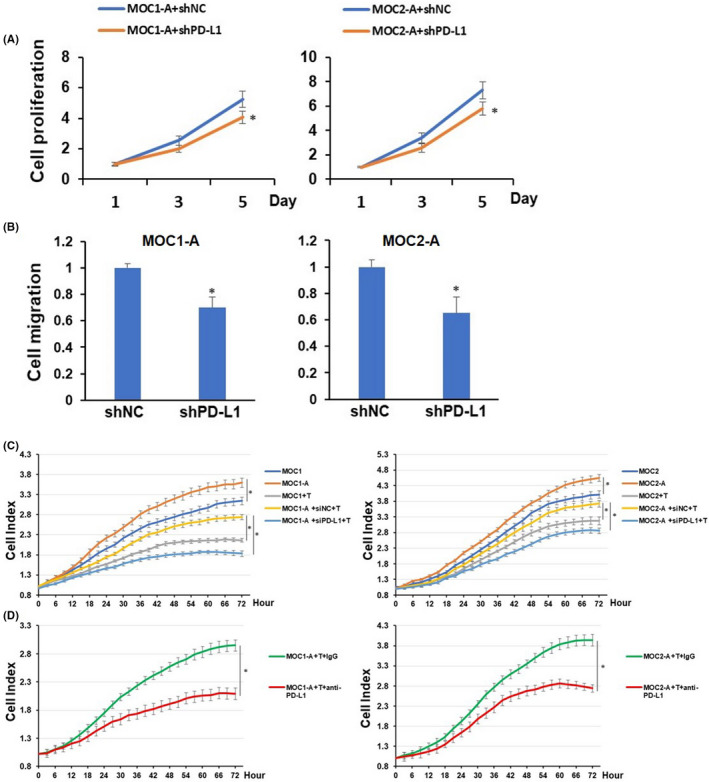
Programmed cell death‐ligand 1 (PD‐L1) knockdown reduces cell proliferation, migration, and resistance to T‐cell killing of mouse oral squamous cell carcinoma (OSCC) cells. (A) MOC1‐A and MOC2‐A cells with or without PD‐L1 depletion were cultured for the indicated periods of time and were harvested for assessment of cell proliferation. (B) The cell migration of MOC1‐A and MOC2‐A cells with or without PD‐L1 depletion were determined using Transwell migration assay. (C) MOC1, MOC1‐A, or MOC1‐A‐shPD‐L1 (left) or MOC2, MOC2‐A, or MOC2‐A‐shPD‐L1 (right) were cocultured with or without activated mouse CD8 T cells at an E:T ratio of 1:1. Cell index curves of each group were generated using the CardioExcyte 96 system. (D) MOC1‐A (left) or MOC2‐A (right) and CD8 T cells coculture (E:T ratio at 1:1) were treated with IgG or mouse anti‐PD‐L1 antibody. Cell index curve of each group was generated using CardioExcyte 96 system. *P < 0.05
3.6. Blockage of programmed cell death‐ligand 1 reduces oral squamous cell carcinoma tumor growth and prolongs mice survival
Because MOC1 and MOC2 tumors are recognized as highly and poorly immunogenic oral cancers, respectively. 28 Mice bearing MOC1 tumors typically exhibit strong immune responses and respond to immunotherapies. Therefore, MOC1‐A cells were selected for in vivo experiments. MOC1‐A‐bearing C57BL/6 mice were randomized and treated with IgG or anti‐PD‐L1 antibody twice per week for a total of 5 weeks (10 doses). The results in Figure 6A and B manifested that anti‐PD‐L1 intervention significantly delayed MOC1‐A tumor growth and prolonged mice survival. The total tumor‐infiltrated T‐cell (CD3+ T‐cells) population, composed of cytotoxic T‐cell (CD3+CD8+ T‐cells) and helper T‐cell (CD3+CD4+ T‐cells), were substantially upregulated in MOC1‐A tumor with anti‐PD‐L1 treatment compared to MOC1‐A tumors with IgG treatment (Figure 6C–E). Concurrently, anti‐PD‐L1 treatment resulted in remarkable upregulation of interferon gamma (IFN‐γ) and TNF‐α (two cytokines with cytotoxic activity) and interleukin‐2 (IL‐2, a T‐cell activation and expansion cytokine) in MOC1‐A tumor (Figure 6F). These results suggested that anti‐PD‐L1 treatment promoted T‐cell activation and infiltration and sensitized cancer cells to T‐cell killing, resulting in inhibited MOC1‐A tumor growth and prolonged mice survival.
FIGURE 6.
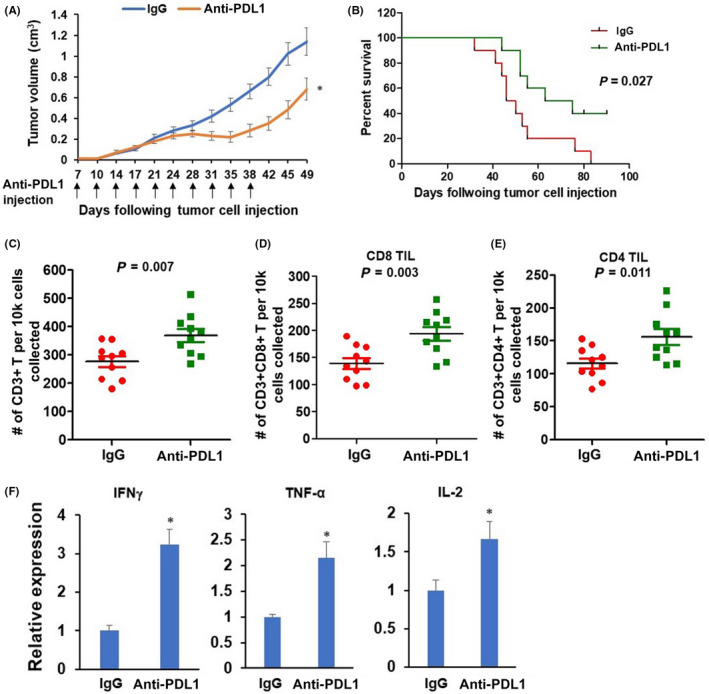
Anti‐programmed cell death‐ligand 1 (PD‐L1) antibody treatment delays tumor growth and improves survival of MOC1‐A tumor‐bearing mice. (A) Seven‐day post MOC1‐A tumor implantation. The MOC1‐A tumor‐bearing mice were treated with intraperitoneal injection of isotype control IgG antibody or anti‐PD‐L1 antibody for a total of 10 injections. Tumor volumes were recorded twice per week. (B) Kaplan–Meier survival analysis for IgG antibody or anti‐PD‐L1 antibody treated MOC1‐A tumor‐bearing mice (n = 10/group). (C–E) Flow cytometric characterization of the presence of total CD3+ T cells within tumors from MOC1‐A tumor‐bearing mice with IgG antibody or anti‐PD‐L1 antibody treatment (C). Cells shown in (C) were further gated CD8+ (D) or CD4+ (E). Absolute numbers of indicated cells per 1× 10⁴ cells collected are displayed (n = 10/group). (F) The expression levels of interferon gamma (IFN‐γ), TNF‐α, and interleukin‐2 (IL‐2) within tumors from MOC1‐A tumor‐bearing mice with IgG antibody or anti‐PD‐L1 antibody treatment were assessed by RT‐qPCR assay. *P < 0.05
4. DISCUSSION
In the present study, using an RNA‐seq transcriptome assay, we identified hundreds of upregulated or downregulated genes in CAL27‐A cells compared to CAL27. Three genes (FTO, MYC, and PD‐L1) were highlighted in the upregulated gene group. Studies have previously reported that arecoline enhances FTO and MYC expression, supporting the validity of our RNA‐seq results. PD‐L1 was chosen for further study because PD‐L1 is an immune checkpoint protein, and the role of PD‐L1 in arecoline‐induced OSCC was unknown.
PD‐L1, a ligand of PD‐1, is prevalently expressed in various types of cancers, including oral cancer. 29 Under normal physiological conditions, the cytotoxic T‐cells (CD8+ T‐cells) effectively eliminate cancer cells through recognizing neo‐antigens presented by cancer cells. PD‐1/PD‐L1 delivers negative regulatory signals to immune cells to prevent autoimmune reactions. However, when cancer cells overexpressing PD‐L1 bind to the PD‐1 receptor on T‐cells. 30 The activated PD‐1/PD‐L1 signaling pathway exerts immune‐suppression effects on T‐cells, enabling cancer cells to escape immune surveillance (Figure 7A and B). PD‐L1 is commonly expressed in OSCC tissues. Ngamphaiboon et al. showed that 83.9% of OSCC samples (n = 203) exhibited positive PD‐L1 expression. 31 In addition, three studies reported that 60%, 43.6%, and 23% of OSCC tissues had high PD‐L1 expression. 32 , 33 , 34 Consistent with these findings, we also confirmed that PD‐L1 was highly expressed in OSCC cells and tissues. More importantly, we revealed that PD‐L1 expression is positively associated with distant metastasis and areca nut chewing, implying that areca nut exposure might promote PD‐L1 expression.
FIGURE 7.
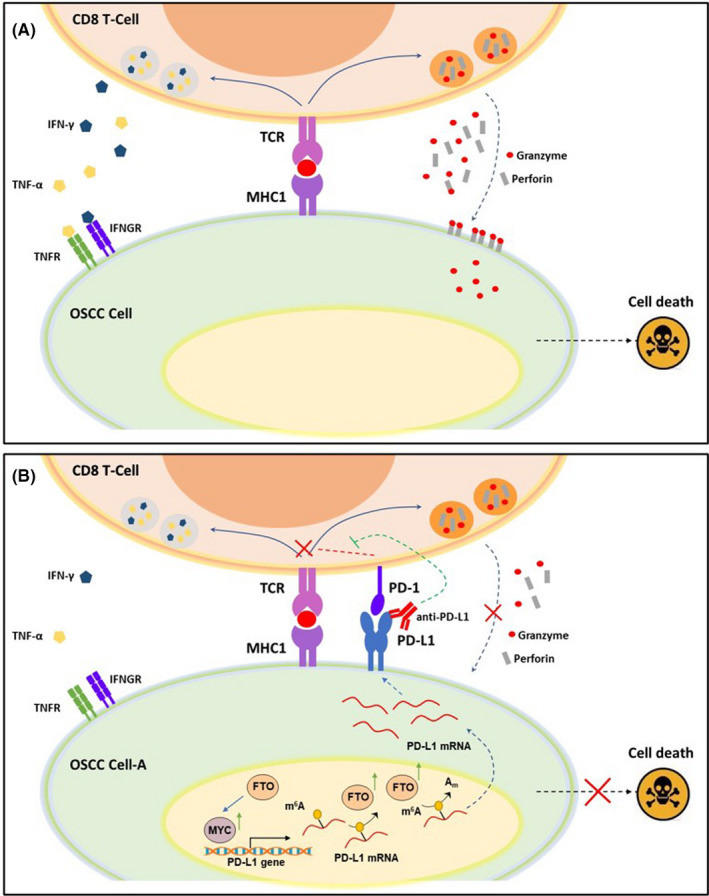
Model of programmed cell death 1 (PD‐1)/programmed cell death‐ligand 1 (PD‐L1) axis in oral squamous cell carcinoma (OSCC) cells and CD8 T cell coculture. (A) CD8+ T cells recognize cancer cells through TCR binding with neo‐antigenic peptides, presented by MHC1 on the surface of OSCC cells. The activated cytotoxic T cells kill cancer cells either directly, through secreting cytotoxic granules containing perforin and granzymes, or indirectly, through releasing cytotoxic cytokines, such as IFNγ and TNF‐α. (B) Chronic arecoline exposure induces PD‐L1 upregulation on OSCC cells. When the PD‐1 expressed on T cell surface binds to PD‐L1 on OSCC cells, the PD‐1/PD‐L1 signaling exerts negative regulatory effects on TCR signaling and blunts the anti‐tumor function of CD8 T cells. Therefore, anti‐PD‐L1 antibody blocks the interaction of PD‐1 and PD‐L1 and abolishes the PD‐1/PD‐L1‐mediated inhibitory effects on CD8+ T cells, thus restoring the target cell‐killing effect
Next, we found that knockdown of FTO abolished arecoline‐induced PD‐L1 expression in OSCC cells, suggesting that FTO was involved in the regulation of PD‐L1 expression. Recent studies demonstrated that FTO mediates m6A demethylation on the target mRNA, which can result in two different consequences. Li et al. reported that FTO reduces the m6A levels of ASB2 and RARA mRNA, accelerating mRNA decay and decreasing ASB2 and RARA expression. 13 In contrast, FTO‐induced m6A demethylation can promote mRNA stability and transcription. Examples of these genes include MYC, PD‐1 (PDCD1), CXCR4, and SOX10. 35 Our results showed that knockdown of FTO considerably enhanced the m6A abundance of PD‐L1 mRNA, especially in the CDS and 3′‐UTR region, and markedly decreased PD‐L1 mRNA stability. These results demonstrated that FTO‐induced upregulation of PD‐L1 is likely related to the enhanced stability of PD‐L1 transcripts. Noticeably, MYC is reported to be positively regulated by FTO, 19 , 25 , 26 and MYC also functions as a transcription factor for PD‐L1 gene. 27 Indeed, we found that knockdown of MYC abolished FTO‐induced PD‐L1 expression. Conversely, ectopically expressed MYC partially rescued FTO depletion‐inhibited PD‐L1 expression. Together, our data suggest that FTO regulates PD‐L1 expression through a direct m6A‐dependent mechanism and an indirect MYC‐dependent mechanism.
It is known that T‐cell receptor (TCR) expressed on the surface of CD8+ T cells recognizes neoantigen peptides presented by MHC Class I molecules (MHC‐I) expressed by cancer cells, leading to CD8+ T cell‐mediated cancer cell elimination. However, PD‐1/PD‐L1 signaling activation negatively regulates T cell‐mediated immune responses, leading to T‐cell dysfunction and tumor survival. 36 We revealed that PD‐L1 upregulation contributes to arecoline‐promoted malignance of OSCC. We showed that chronic arecoline treatment increased PD‐L1 expression in CAL27‐A and SCC25‐A cells, and knockdown of PD‐L1 decreased cell proliferation and migration of CAL27‐A and SCC25‐A cells. Similar results were also observed in mouse OSCC cell lines treated with or without arecoline. Not surprisingly, PD‐L1 upregulation‐promoted cell proliferation, migration/invasion, and epithelial‐to‐mesenchymal transition (EMT) have been reported in various types of cancers, including lung cancer, 37 cervical cancer, 38 hepatocellular carcinoma, 39 and head and neck squamous cell carcinoma. 40 PD‐L1 overexpressed in tumor cells is beneficial for evasion of immune response and formation of the immune suppression microenvironment. Indeed, arecoline‐exposed human and mouse OSCC cell lines were more resistant to CD8 T‐cell‐induced apoptosis than those in control groups. Moreover, anti‐PD‐L1 significantly sensitized arecoline‐treated OSCC cells to T‐cells killing. These results shed light on the possibility of treating arecoline‐induced OSCC with anti‐PD‐L1 therapy.
Currently, there are three FDA‐approved anti‐PD‐L1 therapies for the treatment of patients with certain types of cancers. 41 Atezolizumab (Tecentriq) was approved for urothelial carcinoma and non‐small cell lung cancer. Avelumab (Bavencio) and Durvalumab (Imfinzi) were approved for metastatic Merkel cell carcinoma and urothelial carcinoma, respectively. However, the question of whether anti‐PD‐L1 therapy is suitable for OSCC patients remains obscure. Of note, Pembrolizumab (Keytruda), an anti‐PD‐1 antibody, was approved for the treatment of melanoma, metastatic non‐small cell lung cancer, and HNSCC, 42 implying that targeting PD‐1/PD‐L1 signaling is a logical strategy to treat OSCC tissues with high levels of PD‐L1 expression. Thus, we hypothesized that anti‐PD‐L1 therapy might exert effective anti‐tumor effects on OSCC with arecoline exposure history. Intriguingly, the in vivo results illustrated that anti‐PD‐L1 treatment significantly suppressed tumor growth and prolonged the survival of MOC1‐A‐bearing mice. We revealed that anti‐PD‐L1‐treated tumor tissues exhibited substantially enhanced immune response, as demonstrated by markedly increased CD8+ and CD4+ T‐cell infiltration and TNF‐α, IFN‐γ, and IL‐2 secretion within tumor microenvironment.
Collectively, our current study demonstrated the critical roles of the FTO/MYC/PD‐L1 signaling pathway in arecoline‐promoted OSCC malignance. The results showed that arecoline‐induced FTO and MYC contributed to PD‐L1 upregulation in OSCC cells. FTO increased PD‐L1 mRNA stability through mRNA m6A modification, and MYC promoted PD‐L1 transcripts. The upregulated PD‐L1 confers advantages to OSCC cells, such as cell proliferation, migration, and resistance to T‐cell killing, and these beneficial effects were abolished by blockade of PD‐L1 (Figure 7A and B). Thus, our studies reveal a previously unidentified link between arecoline and immune‐response through regulating FTO/MYC/PD‐L1 signaling in oral cancer, which could lead to the development of strategies to promote cancer immune therapy efficacy.
CONFLICT OF INTEREST
The authors declare no conflict of interest.
Supporting information
Appendix S1
ACKNOWLEDGMENTS
We expressed our gratitude to Lixiang Xu and Long Zhen for their assistance in evaluating tissue sections. The study was supported by the Project of Stomatological Research of Foshan Finance Bureau 2020 NO. 27.
Li X, Chen W, Gao Y, et al. Fat mass and obesity‐associated protein regulates arecoline‐exposed oral cancer immune response through programmed cell death‐ligand 1. Cancer Sci. 2022;113:2962–2973. doi: 10.1111/cas.15332
Contributor Information
Xia Li, Email: fddentistlx@126.com.
Yilong Ai, Email: aiyilong@126.com.
REFERENCES
- 1. Cheraghlou S, Kuo P, Mehra S, Yarbrough WG, Judson BL. Untreated oral cavity cancer: Long‐term survival and factors associated with treatment refusal. Laryngoscope. 2018;128:664‐669. [DOI] [PubMed] [Google Scholar]
- 2. Johnson DE, Burtness B, Leemans CR, Lui VWY, Bauman JE, Grandis JR. Head and neck squamous cell carcinoma. Nat Rev Dis Prim. 2020;6:92. [DOI] [PMC free article] [PubMed] [Google Scholar]
- 3. Illeperuma RP, Kim DK, Park YJ, et al. Areca nut exposure increases secretion of tumor‐promoting cytokines in gingival fibroblasts that trigger DNA damage in oral keratinocytes. Int J Cancer. 2015;137:2545‐2557. [DOI] [PMC free article] [PubMed] [Google Scholar]
- 4. Chang NW, Pei RJ, Tseng HC, et al. Co‐treating with arecoline and 4‐nitroquinoline 1‐oxide to establish a mouse model mimicking oral tumorigenesis. Chem Biol Interact. 2010;183:231‐237. [DOI] [PubMed] [Google Scholar]
- 5. Chang YC, Tsai CH, Lai YL, et al. Arecoline‐induced myofibroblast transdifferentiation from human buccal mucosal fibroblasts is mediated by ZEB1. J Cell Mol Med. 2014;18:698‐708. [DOI] [PMC free article] [PubMed] [Google Scholar]
- 6. Wang X, Lu Z, Gomez A, et al. N6‐methyladenosine‐dependent regulation of messenger RNA stability. Nature. 2014;505:117‐120. [DOI] [PMC free article] [PubMed] [Google Scholar]
- 7. Alarcon CR, Lee H, Goodarzi H, Halberg N, Tavazoie SF. N6‐methyladenosine marks primary microRNAs for processing. Nature. 2015;519:482‐485. [DOI] [PMC free article] [PubMed] [Google Scholar]
- 8. Jia G, Fu Y, Zhao X, et al. N6‐methyladenosine in nuclear RNA is a major substrate of the obesity‐associated FTO. Nat Chem Biol. 2011;7:885‐887. [DOI] [PMC free article] [PubMed] [Google Scholar]
- 9. Vu LP, Pickering BF, Cheng Y, et al. The N(6)‐methyladenosine (m(6)A)‐forming enzyme METTL3 controls myeloid differentiation of normal hematopoietic and leukemia cells. Nat Med. 2017;23:1369‐1376. [DOI] [PMC free article] [PubMed] [Google Scholar]
- 10. Wang Y, Li Y, Yue M, et al. N(6)‐methyladenosine RNA modification regulates embryonic neural stem cell self‐renewal through histone modifications. Nat Neurosci. 2018;21:195‐206. [DOI] [PMC free article] [PubMed] [Google Scholar]
- 11. Abakir A, Giles TC, Cristini A, et al. N(6)‐methyladenosine regulates the stability of RNA:DNA hybrids in human cells. Nat Genet. 2020;52:48‐55. [DOI] [PMC free article] [PubMed] [Google Scholar]
- 12. Meyer KD, Jaffrey SR. The dynamic epitranscriptome: N6‐methyladenosine and gene expression control. Nat Rev Mol Cell Biol. 2014;15:313‐326. [DOI] [PMC free article] [PubMed] [Google Scholar]
- 13. Li Z, Weng H, Su R, et al. FTO Plays an Oncogenic Role in Acute Myeloid Leukemia as a N(6)‐Methyladenosine RNA Demethylase. Cancer Cell. 2017;31:127‐141. [DOI] [PMC free article] [PubMed] [Google Scholar]
- 14. Niu Y, Lin Z, Wan A, et al. RNA N6‐methyladenosine demethylase FTO promotes breast tumor progression through inhibiting BNIP3. Mol Cancer. 2019;18:46. [DOI] [PMC free article] [PubMed] [Google Scholar]
- 15. Li J, Han Y, Zhang H, et al. The m6A demethylase FTO promotes the growth of lung cancer cells by regulating the m6A level of USP7 mRNA. Biochem Biophys Res Comm. 2019;512:479‐485. [DOI] [PubMed] [Google Scholar]
- 16. Li J, Zhu L, Shi Y, Liu J, Lin L, Chen X. m6A demethylase FTO promotes hepatocellular carcinoma tumorigenesis via mediating PKM2 demethylation. Am J Transl Res. 2019;11:6084‐6092. [PMC free article] [PubMed] [Google Scholar]
- 17. Xu D, Shao W, Jiang Y, Wang X, Liu Y, Liu X. FTO expression is associated with the occurrence of gastric cancer and prognosis. Oncol Rep. 2017;38:2285‐2292. [DOI] [PubMed] [Google Scholar]
- 18. Cui Q, Shi H, Ye P, et al. m(6)A RNA methylation regulates the self‐renewal and tumorigenesis of glioblastoma stem cells. Cell Rep. 2017;18:2622‐2634. [DOI] [PMC free article] [PubMed] [Google Scholar]
- 19. Su R, Dong L, Li C, et al. R‐2HG Exhibits Anti‐tumor Activity by Targeting FTO/m(6)A/MYC/CEBPA Signaling. Cell. 2018;172:90‐105. doi: 10.1016/j.cell.2017.11.031 [DOI] [PMC free article] [PubMed] [Google Scholar]
- 20. Huang Y, Su R, Sheng Y, et al. Small‐molecule targeting of oncogenic FTO demethylase in acute myeloid leukemia. Cancer Cell. 2019;35:677‐691. [DOI] [PMC free article] [PubMed] [Google Scholar]
- 21. Li X, Xie X, Gu Y, et al. Fat mass and obesity‐associated protein regulates tumorigenesis of arecoline‐promoted human oral carcinoma. Cancer Med. 2021;10:6402‐6415. [DOI] [PMC free article] [PubMed] [Google Scholar]
- 22. Wang Y, Zeng L, Liang C, et al. Integrated analysis of transcriptome‐wide m(6)A methylome of osteosarcoma stem cells enriched by chemotherapy. Epigenomics. 2019;11:1693‐1715. [DOI] [PubMed] [Google Scholar]
- 23. Chuerduangphui J, Ekalaksananan T, Chaiyarit P, et al. Effects of arecoline on proliferation of oral squamous cell carcinoma cells by dysregulating c‐Myc and miR‐22, directly targeting oncostatin M. PLoS One. 2018;13:e0192009. [DOI] [PMC free article] [PubMed] [Google Scholar]
- 24. Dominissini D, Moshitch‐Moshkovitz S, Schwartz S, et al. Topology of the human and mouse m6A RNA methylomes revealed by m6A‐seq. Nature. 2012;485:201‐206. [DOI] [PubMed] [Google Scholar]
- 25. Xiao L, Li X, Mu Z, et al. FTO inhibition enhances the antitumor effect of temozolomide by targeting MYC‐miR‐155/23a cluster‐MXI1 feedback circuit in glioma. Can Res. 2020;80:3945‐3958. [DOI] [PubMed] [Google Scholar]
- 26. Yang Z, Jiang X, Zhang Z, et al. HDAC3‐dependent transcriptional repression of FOXA2 regulates FTO/m6A/MYC signaling to contribute to the development of gastric cancer. Cancer Gene Ther. 2021;28:141‐155. [DOI] [PubMed] [Google Scholar]
- 27. Casey SC, Tong L, Li Y, et al. MYC regulates the antitumor immune response through CD47 and PD‐L1. Science. 2016;352:227‐231. [DOI] [PMC free article] [PubMed] [Google Scholar]
- 28. Moore EC, Cash HA, Caruso AM, et al. Enhanced Tumor Control with combination mTOR and PD‐L1 inhibition in syngeneic oral cavity cancers. Cancer Immunol Res. 2016;4:611‐620. [DOI] [PMC free article] [PubMed] [Google Scholar]
- 29. Zandberg DP, Strome SE. The role of the PD‐L1:PD‐1 pathway in squamous cell carcinoma of the head and neck. Oral Oncol. 2014;50:627‐632. [DOI] [PubMed] [Google Scholar]
- 30. Waldman AD, Fritz JM, Lenardo MJ. A guide to cancer immunotherapy: from T cell basic science to clinical practice. Nat Rev Immunol. 2020;20:651‐668. [DOI] [PMC free article] [PubMed] [Google Scholar]
- 31. Ngamphaiboon N, Chureemas T, Siripoon T, et al. Characteristics and impact of programmed death‐ligand 1 expression, CD8+ tumor‐infiltrating lymphocytes, and p16 status in head and neck squamous cell carcinoma. Med Oncol. 2019;36:21. [DOI] [PubMed] [Google Scholar]
- 32. de Vicente JC, Rodriguez‐Santamarta T, Rodrigo JP, Blanco‐Lorenzo V, Allonca E, Garcia‐Pedrero JM. PD‐L1 expression in tumor cells is an independent unfavorable prognostic factor in oral squamous cell carcinoma. Cancer Epidemiol Biomark Prevent. 2019;28:546‐554. [DOI] [PubMed] [Google Scholar]
- 33. Yoshida S, Nagatsuka H, Nakano K, et al. Significance of PD‐L1 expression in tongue cancer development. Int J Med Sci. 2018;15:1723‐1730. [DOI] [PMC free article] [PubMed] [Google Scholar]
- 34. Lin YM, Sung WW, Hsieh MJ, et al. High PD‐L1 expression correlates with metastasis and poor prognosis in oral squamous cell carcinoma. PLoS One. 2015;10:e0142656. [DOI] [PMC free article] [PubMed] [Google Scholar]
- 35. Yang S, Wei J, Cui YH, et al. m(6)A mRNA demethylase FTO regulates melanoma tumorigenicity and response to anti‐PD‐1 blockade. Nat Commun. 2019;10:2782. [DOI] [PMC free article] [PubMed] [Google Scholar]
- 36. Ghosh C, Luong G, Sun Y. A snapshot of the PD‐1/PD‐L1 pathway. J Cancer. 2021;12:2735‐2746. [DOI] [PMC free article] [PubMed] [Google Scholar]
- 37. Zhang P, Ma Y, Lv C, et al. Upregulation of programmed cell death ligand 1 promotes resistance response in non‐small‐cell lung cancer patients treated with neo‐adjuvant chemotherapy. Cancer Sci. 2016;107:1563‐1571. [DOI] [PMC free article] [PubMed] [Google Scholar]
- 38. Dong P, Xiong Y, Yu J, et al. Control of PD‐L1 expression by miR‐140/142/340/383 and oncogenic activation of the OCT4‐miR‐18a pathway in cervical cancer. Oncogene. 2018;37:5257‐5268. [DOI] [PMC free article] [PubMed] [Google Scholar]
- 39. Xu GL, Ni CF, Liang HS, et al. Upregulation of PD‐L1 expression promotes epithelial‐to‐mesenchymal transition in sorafenib‐resistant hepatocellular carcinoma cells. Gastroenterol Rep. 2020;8:390‐398. [DOI] [PMC free article] [PubMed] [Google Scholar]
- 40. Eichberger J, Schulz D, Pscheidl K, et al. PD‐L1 Influences Cell Spreading, Migration and Invasion in Head and Neck Cancer Cells. Int J Mol Sci. 2020;21:8089. [DOI] [PMC free article] [PubMed] [Google Scholar]
- 41. Vaddepally RK, Kharel P, Pandey R, Garje R, Chandra AB. Review of indications of FDA‐approved immune checkpoint inhibitors per NCCN guidelines with the level of evidence. Cancers. 2020;12:738. [DOI] [PMC free article] [PubMed] [Google Scholar]
- 42. Shitara K, Van Cutsem E, Bang YJ, et al. Efficacy and safety of pembrolizumab or pembrolizumab plus chemotherapy vs chemotherapy alone for patients with first‐line, advanced gastric cancer: The Keynote‐062 phase 3 randomized clinical trial. JAMA Oncol. 2020;6:1571‐1580. [DOI] [PMC free article] [PubMed] [Google Scholar]
Associated Data
This section collects any data citations, data availability statements, or supplementary materials included in this article.
Supplementary Materials
Appendix S1


