

Abstract
Background
Gestational diabetes mellitus (GDM) and gestational diabetic nephropathy (GDN) have become an increasingly serious problem worldwide, which can cause a large number of adverse pregnancy consequences for mothers and infants. However, the diagnosis of GDM and GDN remains a challenge due to the lack of optimal biomarkers, and the examination has high requirements for patient compliance. We aimed to establish a simple early diagnostic model for GDM and GDN.
Methods
We recruited 50 healthy pregnant (HP), 99 GDM patients, 99 GDN patients at Daping Hospital. Renal function indicators and blood cell indicators were collected for all patients.
Results
Compared with HP, GDM, and GDN patients exhibited significantly higher urea/creatinine ratio and NEU. The diagnostic model1 based on the combination of urea/creatinine ratio and NEU was built using logistic regression. Based on receiver operating characteristic curve analysis, the area under the curve (AUC) of the diagnostic model was 0.77 (0.7, 0.84) in distinguishing GDM from HP, and the AUC of the diagnostic model was 0.94 (0.9, 0.97) in distinguishing GDN from HP. Meanwhile, the diagnostic model2 based on the combination of β2‐mG, PLT, and NEU in GDM and GDN patients was built using logistic regression, and the area under the ROC curve (AUC ROC) was 0.79 (0.73, 0.85), which was larger than the individual biomarker AUC.
Conclusion
Our study demonstrated that the diagnostic model established by the combination of renal function indicators and blood cell indicators could facilitate the differential diagnosis of GDM and GDN patients.
Keywords: biomarker, blood cell indicators, diagnostic model, gestational diabetes mellitus, gestational diabetic nephropathy, renal function indicators
The diagnostic model1 and model2 are with higher AUC compare with the individual immune indicator.
![]()
1. INTRODUCTION
Gestational diabetes mellitus (GDM) is an increasingly serious health problem worldwide. 1 It is one of the most common complications of pregnancy, with the implementation of China's new fertility policy the incidence rate of GDM is increasing. In 2019, an analysis showed that the incidence rate of GDM in China was up to 12.8%~16.7%. 2 GDM frequently causes fetal disorders during pregnancy and causes fetal mortality and morbidity. 3 Gestational diabetic nephropathy (GDN) is the progression of GDM and there is kidney damage at the same time. 4 It was reported that 20% to 40% of diabetic patients in the United States suffer from varying degrees of kidney injury, and diabetic nephropathy is the first cause leading to end‐stage renal disease (ESRD). 5 At the same time pregnancy in women with diabetic nephropathy had a higher risk of fetal/neonatal severe complications. 6
Early detection of GDM and GDN, timely control of blood glucose, and intervention of kidney injury are of great significance to reduce the risk of maternal and infant. At present, the 75 g oral glucose tolerance test (OGTT) is the diagnostic standard proposed by the international diabetes and pregnancy research group (IADPSG). However, the examination has higher requirements for patient compliance. 7 It is also more troublesome to check with requiring multiple blood. In addition, OGTT is carried out between 24–28 weeks of gestation, which makes it challenging to detect GDM at an early stage. 8 Meanwhile, there are many clinical indicators of kidney injury, such as urinary micro‐albumin (ALB), β 2‐microglobulin (β2‐mG), cystatin C (Cys‐C), urea, Crea et al., 9 in many cases with normal renal injury indicators, kidney damage has occurred. 10 , 11
In recent years, in the study of the relationship between inflammatory factors and microcirculation, it is found that inflammatory response plays an important role in the occurrence and development of GDM and GDN. 12 More and more studies have shown that the increase of leukocyte, PLT is associated with GDM and GDN. 13 , 14 , 15 , 16 Neutrophils, lymphocytes, and platelet are important observation indexes in blood cells classification. Neutrophil to lymphocyte ratio (NLR) and platelet to lymphocyte ratio (PLR) are new inflammatory indexes. Increased NLR has been reported in inflammatory bowel disease, diabetes mellitus, thyroiditis, and SARS Cov2 infection. 17 , 18 , 19 Similarly, PLR is associated with irritable bowel disease, type 2 diabetes mellitus, and COVID‐19 infection. 20 , 21 , 22 NLR and PLR are used to diagnose many diseases. 23 , 24 However, the combination of renal function and hemocyte indicators for the diagnosis of GDM and GDN is rarely reported.
Early diagnosis of GDM and GDN can improve the survival and health of mothers and infants. 25 , 26 Therefore, the present study aims to combine renal function index and hemocyte indicators to establish an early diagnostic model of GDM and GDN patients.
2. METHODS
2.1. Study design and participants selection
This was a case–control study. This study included patients between 18 and 45 years of age admitted to the obstetric outpatient of Daping Hospital located in Chongqing, China, from January 2019 to January 2021. Ethics approval was obtained from the Ethics Committee of Daping Hospital, Army Medical University. The patient data were collected from clinical tests within 24–28 gestational weeks. In this study, patients were classified into three cohorts, healthy pregnant (HP), patients with GDM, and patients with GDN by three obstetricians based on a retrospective analysis of the patient's clinical symptoms and examination results. The HP was from healthy volunteers and matched with patients in age and gestational weeks.
2.2. Inclusion and exclusion criteria
2.2.1. Inclusion criteria
Inclusion criteria of GDM refer to the international diabetes and pregnancy research group (IADPSG) on the diagnostic criteria and classification strategy for gestational hyperglycemia. All pregnant women were given an oral glucose tolerance test at 75 g, fasting blood glucose 5.1 mmol/L, 1 h blood glucose 10.0 mmol/L, 2 h blood glucose 8.5 mmol/L at 24–28 weeks of gestation. One of the above abnormalities is diagnosed as GDM and included in the GDM group. 27 The GDN group was included the patients who were diagnosed as GDN after 28 gestation weeks according to the consensus on prevention and treatment of diabetes nephropathy (2014 edition). One of the following can be used to diagnose diabetes nephropathy: heavy albuminuria (>0.3 g/24 h); diabetes retinopathy with any stage of chronic kidney disease. 28 , 29
2.2.2. Exclusion criteria
Patients who had previous diabetes, acute complications of diabetes, chronic inflammation, obstetric complications, acute cardiovascular and cerebrovascular diseases, autoimmune diseases, malignant tumors, hematological diseases, history of infection, trauma and other stressful conditions, acute and chronic glomerulonephritis, acute and chronic renal failure, and other primary kidney diseases, and so on were excluded.
2.3. Data collection
Data were collected between 24 and 28 weeks of gestation, including renal function indicators (urea, creatinine (Crea), urea/creatinine ratio, Cystatin C (Cys‐C), β2‐microglobulin (β2‐mG), estimated glomerular filtration rate (eGFR)) and blood cell indicators (platelets count (PLT), lymphocyte count (LYM), neutropenia count (NEU), neutrophil to lymphocyte ratio (NLR), platelet to lymphocyte ratio (PLR)). Renal function indicators were quantified with a UniCel DxC800 Synchron device (Beckman, USA). The blood cell indicators were measured using the Sysmex XE‐2100 automatic hematology analyzer (Sysmex, Japan).
2.4. Statistical analysis
Normally distributed variables are given as means ± SD, whereas non‐normally distributed variables were given as median (interquartile range, IQR). The comparison between continuous variables was performed using a t‐test if the continuous value is normal distribution and homogeneity of variance or Mann–Whitney U test if not. For the establishment of the diagnostic model, indicators with a statistical difference were selected and taken as candidates in multivariable logistic regression models. Then, the regression equation (diagnostic model) was obtained. The receiver operating characteristic (ROC) curve was plotted to evaluate the diagnostic performance of various indicators. The area under the ROC curve (AUC) was calculated, and the cutoff values with the largest Youden index (the sum of sensitivity and specificity) were calculated from the ROC curve. The area under the curve (AUC), sensitivity, specificity, positive predictive value (PPV), negative predictive value (NPV), positive likelihood ratio (PLR), negative likelihood ratio (NLR), and accuracy, as well as the corresponding 95% confidence interval (CI) were calculated. Statistical was analyzed with SPSS 25.0 statistical software, R v.4.1.1 Statistical Software, and GraphPad Prism9.0. In all statistical analyses, a p value <0.05 was considered statistically significant.
3. RESULTS
3.1. Participant characteristics
A total of 247 subjects were included in this study. Fifty HP, 99 GDM, and 98 GDN were consecutively enrolled from January 2019 to January 2021 at Daping Hospital. The demographic and biological data of all participants were summarized in (Table 1). There was no significant difference in scale of age and gestational weeks among these three groups. The mean age was around 30 years, and the median gestational weeks is 33 weeks.
TABLE 1.
Demographic and biological data of the population
| Variables | Total (n = 247) | p value | ||||
|---|---|---|---|---|---|---|
| HP (n = 50) | GDM (n = 99) | GDN (n = 98) | HP vs. GDM | HP vs. GDN | GDM vs. GDN | |
| Age (year) | 30.69 ± 4.71 | 30.90 ± 4.97 | 30.62 ± 4.50 | NS | NS | NS |
| Gestational weeks | 33.5 (30.18, 39.07) | 33 (30.29, 38.86) | 33.57 (30.25, 38.18) | NS | NS | NS |
| Urea (mmol/L) | 2.6 (2.14, 3) | 3.01 (2.42, 3.58) | 2.94 (2.4, 3.78) | 0.003 | 0.006 | 1 |
| Crea (μmol/L) | 42.2 (38.58, 46.95) | 41.6 (37.8, 47.1) | 43.55 (38.95, 47.55) | NS | NS | NS |
| Urea/Creatinine ratio | 15.65 (12.62, 17.23) | 17.83 (13.71, 21.67) | 16.9 (13.75, 20.98) | 0.003 | 0.021 | 1 |
| Cys‐C (mg/L) | 1.12 (0.88, 1.33) | 1 (0.85, 1.21) | 1.05 (0.87, 1.23) | NS | NS | NS |
| β2‐mG (mg/L) | 1.46 (1.24, 1.73) | 1.42 (1.19, 1.7) | 1.51 (1.31, 1.82) | 1 | 0.467 | 0.025 |
| eGFR (ml/min/1.73 m3) | 204.37 (175.72, 224.5) | 204.73 (177.2226.13) | 190.59 (171.37, 219.78) | NS | NS | NS |
| PLT (10^9/L) | 179.82 ± 48.42 | 177.94 ± 45.07 | 194.34 ± 52.96 | 0.815 | 0.107 | 0.02 |
| LYM (10^9/L) | 1.39 (1.21, 1.68) | 1.49 (1.27, 1.74) | 1.57 (1.3, 1.93) | 0.502 | 0.029 | 0.422 |
| NEU (10^9/L) | 5.48 (4.7, 5.78) | 6.12 (5.22, 6.78) | 7.46 (6.63, 8.72) | 0.001 | 0 | 0 |
| NLR | 3.7 (2.96, 4.27) | 4.05 (3.3, 5) | 4.7 (3.87, 6.17) | 0.184 | 0 | 0.001 |
| PLR | 117 (98.91, 154.36) | 117.56 (95.9137.89) | 114.51 (91.98, 150.86) | NS | NS | NS |
3.2. Biomarkers in HP, GDM, and GDN
We performed biomarkers analysis among HP, GDM, and GDN. It was observed that compared with HP, GDM patients showed significantly higher urea/creatinine ratio, urea, NEU; GDM patients showed significantly higher urea/creatinine ratio, urea, NEU, NLR, LYM; compared with GDM, GDN patients showed significantly higher β2‐Mg, PLT, NLR, NEU. And the NEU showed a clear gradual upward trend as GDN > GDM > HP. No significant difference in Crea, Cys‐C, eGFR, PLR, among these three groups (Figure 1).
FIGURE 1.

The result of biomarkers in HP, GDM, and GDN. (A) Violin plot showing the results of biomarkers in HP (n = 50), GDM (n = 99), and GDN (n = 98). Horizontal lines indicate the median and interquartile range. *p < 0.05, **p < 0.01, ***p < 0.001, ns, no significance (Mann–Whitney U test)
3.3. Establishing diagnostic Model of GDM and GDN
To investigate the possibility of combining different biomarkers to distinguish the status of GDM and GDN, we performed a Mann–Whitney U test and discovered the potential of the combination of these indexes to distinguish GDM and GDN from HP (Table 1). To establish the diagnostic model based on a combination for differentiating GDM and GDN from HP, all variables with statistical significance were used for multivariable logistic regression model (Table S1). The urea/creatinine ratio and NEU are included in model1. The diagnostic model1 was established as the follows: model1: P = 1/ [1 + e‐(−6.752 + 0.171 * urea/creatinine ratio + 0.883 * NEU)]. P, predictive value; e, natural logarithm.
3.4. Biomarker combinations for diagnosing GDM, GDN
Using the best cutoffs derived from the ROC analysis for each of the two biomarkers, we assigned each elevated biomarker a score of 1 (no elevated biomarker scored 0). The number of elevated biomarkers was summed to give a cumulative total (range 0–2). With this approach, an increase in the number of elevated biomarkers was associated with a progressive increase in the risk of GDM and GDN (Table 2). When the score ≥1, the sensitivity of diagnosing GDM is 74.75% (64.84%, 82.7%), and specificity is 80% (65.86%, 89.5%); the sensitivity of diagnosing GDN is 97.96% (92.11%, 99.65%), and specificity is 80% (65.86%, 89.5%); when the score = 2, the sensitivity of diagnosing GDM is 23.23% (15.58%, 33%), and specificity is 100% (91.11%, 100%); the sensitivity of diagnosing GDN is 25.51% (17.48%, 35.49%), and specificity is 100% (91.11%, 100%) (Table 3). When the combined markers were used (model1), the area under the ROC curve (AUC ROC) was 0.77 (0.7, 0.84) and 0.94 (0.9, 0.97); these were larger than individual biomarker AUC (Table S2, Figure 2).
TABLE 2.
Diagnostic performance of additive combination of the two markers between HP and GDM, HP and GDN
| Number of biomarkers | n | GDM | GDN |
|---|---|---|---|
| 0 | 67 | 25 (37.31%) | 2 (2.99%) |
| 1 | 132 | 51 (38.64%) | 71 (53.79%) |
| 2 | 48 | 23 (47.92%) | 25 (52.08%) |
TABLE 3.
The performance of number of biomarkers for distinguishing between HP and GDM, HP and GDN
| Number of biomarkers | Sensitivity (95% CI) | Specificity (95% CI) | PPV (95% CI) | NPV (95% CI) | PLR (95% CI) | NLR (95% CI) | Accuracy |
|---|---|---|---|---|---|---|---|
| GDM | |||||||
| ≥1 | 74.75% (64.84%, 82.7%) | 80% (65.86%, 89.5%) | 88.1% (78.75%, 93.83%) | 61.54% (48.62%, 73.09%) | 3.74 (2.12, 6.58) | 0.32 (0.22, 0.45) | 76.51% |
| 2 | 23.23% (15.58%, 33%) | 100% (91.11%, 100%) | 100% (82.19%, 100%) | 39.68% (31.2%, 48.81%) | — | 0.77 (0.69, 0.86) | 48.99% |
| GDN | |||||||
| ≥1 | 97.96% (92.11%, 99.65%) | 80% (65.86%, 89.5%) | 90.57% (82.93%, 95.13%) | 95.24% (82.58%, 99.17%) | 4.9 (2.81, 8.53) | 0.03 (0.01, 0.1) | 91.89% |
| 2 | 25.51% (17.48%, 35.49%) | 100% (91.11%, 100%) | 100% (83.42%, 100%) | 40.65% (32%, 49.89%) | — | 0.74 (0.66, 0.84) | 50.68% |
FIGURE 2.
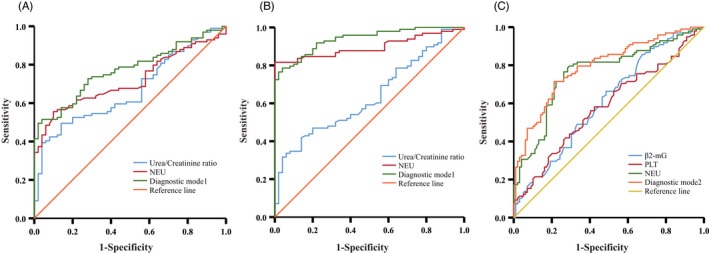
Performance of potential indicators and diagnostic models in differentiating HP, GDM and GDN. (A) ROC analysis showing the performance of various indicators in discriminating GDM patients from HP. (B) ROC analysis showing the performance of various indicators in discriminating GDN patients from HP. (C) ROC analysis showing the performance of various indicators in discriminating GDN patients from GDM. AUC, area under the curve; GDM, Gestational diabetes mellitus; GDN, Gestational diabetic nephropathy; HP, Healthy Pregnancy
3.5. Establishing diagnostic Model of GDN
As with the above method, we performed a Mann–Whitney U test and discovered the potential of the combination of these indexes to distinguish GDN from GDM (Table 1). To establish the diagnostic model based on a combination for differentiating GDN from GDM, all variables with statistical significance were used for multivariable logistic regression (Table S3). The β2‐mG, PLT, and NEU are included in model2. The diagnostic model2 was established as the follows: model2: P = 1/ [1 + e‐(−7.636 + 1.216 * β2‐mG + 0.009 * PLT + 0.605 * NEU)]. P, predictive value; e, natural logarithm.
3.6. Biomarker combinations for diagnosing GDN
Same as above, using the best cutoffs derived from the ROC analysis for each of the three biomarkers, and assigned each elevated biomarker a score of 1 (no elevated biomarker scored 0). The number of elevated biomarkers was summed to give a cumulative total (range 0–3). With this approach, an increase in the number of elevated biomarkers was associated with a progressive increase in the risk of GDN (Table 4). When the score ≥1, the sensitivity of diagnosing GDN is 97.96% (92.11%, 99.65%), and specificity is 12.12% (6.69%, 20.59%); when the score ≥2, the sensitivity of diagnosing GDN is 86.73% (78.03%, 92.47%), and specificity is 57.58% (47.24%, 67.32%); when the score ≥3, the sensitivity of diagnosing GDN is 38.78% (29.26%, 49.18%), and specificity is 90.91% (83.01%, 95.5%) (Table 5). With the increase of scores, sensitivity decreased, and specificity increased. When the combined markers were used (model2), the area under the ROC curve (AUC ROC) was 0.79 (0.73, 0.85), this was larger than the individual biomarker AUC (Table S4, Figure 2).
TABLE 4.
Diagnostic performance of additive combination of the two markers between GDM and GDN
| Number of biomarkers | n | GDN |
|---|---|---|
| 0 | 21 | 2 (9.52%) |
| 1 | 56 | 11 (19.64%) |
| 2 | 80 | 47 (58.75%) |
| 3 | 47 | 38 (80.85%) |
TABLE 5.
The performance of number of biomarkers for distinguishing between GDM and GDN
| Number of biomarkers | Sensitivity (95% CI) | Specificity (95% CI) | PPV (95% CI) | NPV (95% CI) | PLR (95% CI) | NLR (95% CI) | Accuracy |
|---|---|---|---|---|---|---|---|
| ≥1 | 97.96% (92.11%, 99.65%) | 12.12% (6.69%, 20.59%) | 52.46% (44.98%, 59.83%) | 85.71% (56.15%, 97.49%) | 1.11 (1.03, 1.21) | 0.17 (0.04, 0.77) | 54.82% |
| ≥2 | 86.73% (78.03%, 92.47%) | 57.58% (47.24%, 67.32%) | 66.93% (57.95%, 74.87%) | 81.43% (69.98%, 89.36%) | 2.04 (1.6, 2.6) | 0.23 (0.14, 0.39) | 72.08% |
| 3 | 38.78% (29.26%, 49.18%) | 90.91% (83.01%, 95.5%) | 80.85% (66.27%, 90.35%) | 60% (51.67%, 67.81%) | 4.27 (2.18, 8.34) | 0.67 (0.57, 0.79) | 64.97% |
4. DISCUSSION
In this study, we constructed an early diagnostic model of GDM and GDN by combining renal function indicators with blood cell indicators. The diagnostic model1 is used to distinguish GDM/GDN patients from HC with higher AUC (0.77 (0.7, 0.84)), (0.94 (0.9, 0.97)) Compare with the individual immune indicator. The diagnostic model2 is used to distinguish GDN with higher AUC (0.74[0.63, 0.84]) compare with the individual immune indicator.
Hyperglycemia during pregnancy is a severe complication in women during pregnancy. At the same time, hyperglycemia during pregnancy is also the main cause of other complications during pregnancy. 13 When GDM is complicated with renal impairment and developed into GDN, the maternal‐fetal risks will be further increased. So early diagnosis of GDM and GDN is very important. At present, the diagnosis of GDM relies on the OGTT test with poor compliance. In the meantime, the diagnosis of GDN relies on renal substantial damage and renal function indicators, but when these indicators appear warning, kidney damage has occurred for a period of time. At present, there are no clear and unified indicators for early diagnosis. It has been reported in the literature that neutrophil gelatinase‐associated lipocalin (NGAL) and kidney injury molecule‐1 (KIM‐1) expression are associated with early renal injury; however, the clinical implementation rate of these projects is not high. 30 Combined with clinical work and research paper results, we established an early diagnosis model that combined renal function indicators and blood cell indicators, showing higher sensitivity and specificity compared with single indicators.
An interesting finding is that when urea/creatinine ratio and NEU are combined in the diagnosis of GDM, it is found that when at least one of the two indicators is early warning, the diagnostic accuracy is (76.51%) higher model1 (66.44%). When urea/creatinine ratio and NEU are combined in the diagnosis of GDN, it is found that when at least one of the two indicators is early warning, the diagnostic accuracy is (91.89%) higher model1 (86.49%). This discovery shows the special use of joint diagnosis, and it is feasible to diagnose diseases according to the number of marker warnings.
This study is a single‐center study, and the sample size is not large enough. To obtain more stable results, multicenter cooperation should be carried out, and more cases are needed.
In conclusion, our findings suggest that the diagnostic model based on the combination of renal function indicators and blood cell indicators may be an adjunctive but useful method in the diagnosis of GDM and GDN.
AUTHOR CONTRIBUTIONS
Huimin Chong and Jingmi Li analyzed the data and wrote the draft; Kejun Zhang and Dan Liao conceived and designed the study, analyzed the data, and finalized the draft; Caigui Chen and Wan Wang collected the samples, analyzed the data, and participated in the drafting. All authors read and approved the final manuscript.
FUNDING INFORMATION
This study was supported by Chongqing Clinical Key Specialty Construction Project, Chongqing, China.
CONFLICT OF INTEREST
The authors declare that they have no known competing financial interests or personal relationships that could have appeared to influence the work reported in this paper.
Supporting information
TablesS1
Chong H, Li J, Chen C, Wang W, Liao D, Zhang K. The diagnostic model for early detection of gestational diabetes mellitus and gestational diabetic nephropathy. J Clin Lab Anal. 2022;36:e24627. doi: 10.1002/jcla.24627
Huimin Chong and Jinmi Li, these authors contributed equally to this work.
Contributor Information
Dan Liao, Email: 806577190@qq.com.
Kejun Zhang, Email: kejunzhang@tmmu.edu.cn.
DATA AVAILABILITY STATEMENT
The data that support the findings of this study are available in the supplementary material of this article.
REFERENCES
- 1. Nguyen‐Ngo C, Jayabalan N, Salomon C, Lappas M. Molecular pathways disrupted by gestational diabetes mellitus. J Mol Endocrinol. 2019;63(3):R51‐r72. [DOI] [PubMed] [Google Scholar]
- 2. Gao C, Sun X, Lu L, Liu F, Yuan J. Prevalence of gestational diabetes mellitus in mainland China: a systematic review and meta‐analysis. J Diabetes Investig. 2019;10(1):154‐162. [DOI] [PMC free article] [PubMed] [Google Scholar]
- 3. Yasuda S, Iuchi T, Goto A, et al. Weight control before and during pregnancy for patients with gestational diabetes mellitus. J Diabetes Investig. 2019;10(4):1075‐1082. [DOI] [PMC free article] [PubMed] [Google Scholar]
- 4. Umanath K, Lewis JB. Update on diabetic nephropathy: Core curriculum 2018. Am J Kidney Dis. 2018;71(6):884‐895. [DOI] [PubMed] [Google Scholar]
- 5. Perkovic V, Jardine MJ, Neal B, et al. Canagliflozin and renal outcomes in type 2 diabetes and nephropathy. N Engl J Med. 2019;380(24):2295‐2306. [DOI] [PubMed] [Google Scholar]
- 6. Spotti D. Pregnancy in women with diabetic nephropathy. J Nephrol. 2018;32(3):379‐388. [DOI] [PubMed] [Google Scholar]
- 7. Kim SH, Park TS, Jin HY. Rethinking the accuracy of 75g glucose used in the oral glucose tolerance test in the diagnosis and management of diabetes. Prim Care Diabetes. 2017;11(6):555‐560. [DOI] [PubMed] [Google Scholar]
- 8. Rayis DA, Ahmed ABA, Sharif ME, ElSouli A, Adam I. Reliability of glycosylated hemoglobin in the diagnosis of gestational diabetes mellitus. J Clin Lab Anal. 2020;34(10):e23435. [DOI] [PMC free article] [PubMed] [Google Scholar]
- 9. Papadopoulou‐Marketou N, Kanaka‐Gantenbein C, Marketos N, Chrousos GP, Papassotiriou I. Biomarkers of diabetic nephropathy: a 2017 update. Crit Rev Clin Lab Sci. 2017;54(5):326‐342. [DOI] [PubMed] [Google Scholar]
- 10. Macisaac RJ, Jerums G. Diabetic kidney disease with and without albuminuria. Curr Opin Nephrol Hypertens. 2011;20(3):246‐257. [DOI] [PubMed] [Google Scholar]
- 11. Zoccali C, Mallamaci F. Nonproteinuric progressive diabetic kidney disease. Curr Opin Nephrol Hypertens. 2019;28(3):227‐232. [DOI] [PubMed] [Google Scholar]
- 12. Kim IY, You SH, Kim YW. Neutrophil‐lymphocyte ratio predicts pathologic tumor response and survival after preoperative chemoradiation for rectal cancer. BMC Surg. 2014;14:94. [DOI] [PMC free article] [PubMed] [Google Scholar]
- 13. Plows JF, Stanley JL, Baker PN, Reynolds CM, Vickers MH. The pathophysiology of gestational diabetes mellitus. Int J Mol Sci. 2018;19(11):3432. [DOI] [PMC free article] [PubMed] [Google Scholar]
- 14. Huang Y, Chen X, You ZS, et al. The value of first‐trimester platelet parameters in predicting gestational diabetes mellitus. J Matern Fetal Neonatal Med. 2020;35(11):1‐5. [DOI] [PubMed] [Google Scholar]
- 15. Pan L, Ye Y, Wo M, et al. Clinical significance of hemostatic parameters in the prediction for type 2 diabetes mellitus and diabetic nephropathy. Dis Markers. 2018;2018:5214376. [DOI] [PMC free article] [PubMed] [Google Scholar]
- 16. Sahbaz A, Cicekler H, Aynioglu O, Isik H, Ozmen U. Comparison of the predictive value of plateletcrit with various other blood parameters in gestational diabetes development. J Obstet Gynaecol. 2016;36(5):589‐593. [DOI] [PubMed] [Google Scholar]
- 17. Bilgin S, Aktas G, Zahid Kocak M, et al. Association between novel inflammatory markers derived from hemogram indices and metabolic parameters in type 2 diabetic men. The Aging Male. 2019;23(5):923‐927. [DOI] [PubMed] [Google Scholar]
- 18. Khalid A, Ali Jaffar M, Khan T, et al. Hematological and biochemical parameters as diagnostic and prognostic markers in SARS‐COV‐2 infected patients of Pakistan: a retrospective comparative analysis. Hematology. 2021;26(1):529‐542. [DOI] [PubMed] [Google Scholar]
- 19. Fu, W. , Fu H., Ye W., Han Y., Liu X., Zhu S., et al., Peripheral blood neutrophil‐to‐lymphocyte ratio in inflammatory bowel disease and disease activity: a meta‐analysis. Int Immunopharmacol, 2021. 101(Pt B): p. 108235. [DOI] [PubMed] [Google Scholar]
- 20. Bertani L, Rossari F, Barberio B, et al. Novel prognostic biomarkers of mucosal healing in ulcerative colitis patients treated with anti‐TNF: neutrophil‐to‐lymphocyte ratio and platelet‐to‐lymphocyte ratio. Inflamm Bowel Dis. 2020;26(10):1579‐1587. [DOI] [PubMed] [Google Scholar]
- 21. Atak B, Aktas G, Duman TT, Erkus E, Kocak MZ, Savli H. Diabetes control could through platelet‐to‐lymphocyte ratio in hemograms. Rev Assoc Med Bras (1992). 2019;65(1):38‐42. [DOI] [PubMed] [Google Scholar]
- 22. Aktas, G. , Hematological predictors of novel coronavirus infection. Rev Assoc Med Bras (1992), 2021. 67 Suppl 1(Suppl 1): p. 1–2. [DOI] [PubMed] [Google Scholar]
- 23. Diem S, Schmid S, Krapf M, et al. Neutrophil‐to‐lymphocyte ratio (NLR) and platelet‐to‐lymphocyte ratio (PLR) as prognostic markers in patients with non‐small cell lung cancer (NSCLC) treated with nivolumab. Lung Cancer. 2017;111:176‐181. [DOI] [PubMed] [Google Scholar]
- 24. Qin B, Ma N, Tang Q, et al. Neutrophil to lymphocyte ratio (NLR) and platelet to lymphocyte ratio (PLR) were useful markers in assessment of inflammatory response and disease activity in SLE patients. Mod Rheumatol. 2016;26(3):372‐376. [DOI] [PubMed] [Google Scholar]
- 25. Huhn EA, Fischer T, Göbl CS, et al. Screening of gestational diabetes mellitus in early pregnancy by oral glucose tolerance test and glycosylated fibronectin: study protocol for an international, prospective, multicentre cohort trial. BMJ Open. 2016;6(10):e012115. [DOI] [PMC free article] [PubMed] [Google Scholar]
- 26. Bozkurt L, Göbl CS, Pfligl L, et al. Pathophysiological characteristics and effects of obesity in women with early and late manifestation of gestational diabetes diagnosed by the International Association of Diabetes and Pregnancy Study Groups criteria. J Clin Endocrinol Metab. 2015;100(3):1113‐1120. [DOI] [PMC free article] [PubMed] [Google Scholar]
- 27. Buse JB, Wexler DJ, Tsapas A, et al. Update to: Management of Hyperglycemia in type 2 diabetes, 2018. A consensus report by the American Diabetes Association (ADA) and the European Association for the Study of diabetes (EASD). Diabetes Care, 2020. 2019;43(2):487‐493. [DOI] [PMC free article] [PubMed] [Google Scholar]
- 28. Mooyaart AL, Zutinic A, Bakker SJ, et al. Association between CNDP1 genotype and diabetic nephropathy is sex specific. Diabetes. 2010;59(6):1555‐1559. [DOI] [PMC free article] [PubMed] [Google Scholar]
- 29. Zhao H, Shu L, Huang W, Wang W, Song G. Difference analysis of related factors in macrovascular and microvascular complications in Chinese patients with type 2 diabetes mellitus: a case‐control study protocol. Diabetes Metab Syndr Obes. 2019;12:2193‐2200. [DOI] [PMC free article] [PubMed] [Google Scholar]
- 30. Močnik M, Marčun Varda N. Current knowledge of selected cardiovascular biomarkers in pediatrics: kidney injury Molecule‐1, Salusin‐α and ‐β. Uromodulin, and Adropin Children (Basel). 2022;9(1):102. [DOI] [PMC free article] [PubMed] [Google Scholar]
Associated Data
This section collects any data citations, data availability statements, or supplementary materials included in this article.
Supplementary Materials
TablesS1
Data Availability Statement
The data that support the findings of this study are available in the supplementary material of this article.