

Abstract
Objective:
Irrational medicine use results in diseases worsening, disability, death, and wastage of limited resources. This study was predominantly aimed to evaluate the rationality of medicine use patterns by assessing prescribing, patient-care, and facility indicators at Debre Tabor Comprehensive Specialized Hospital by using World Health Organization core drug use indicators.
Methods:
A cross-sectional design was conducted to collect prescribing indicator data from 780 prescriptions retrospectively from 1 July 2020 to 30 June 2021 at outpatient pharmacy of the hospital and exit interview was held prospectively on 150 patients to evaluate patient-care indicators. In addition, indicators for health-facility were assessed by actual observation of the presence of different guidelines. Descriptive analysis of the collected data was computed using SPSS version 25.
Result:
Totally, 1521 drugs were prescribed to 780 encounters. On average, 1.95 drugs were prescribed per prescription. Percentage of encounters by generic name, encounters with antibiotics and injection, and drugs from essential drug list were 99.9%, 35.4%, 15.3%, and 100%, respectively. From healthcare provider–related information, the names of prescribers and dispensers were correctly written in 93.59% and 77.69%, respectively. Frequency (97.18%) and route (86.15%) of drug administration were better stated in the reviewed encounters, whereas dosage form is poorly stated (7.44%). Labeling of dispensed medicine was obtained for only 10% of patients and patient knowledge for correct dose was 94%. Availability of facility indicators was 95%.
Conclusion:
From the results of this study, it is possible to conclude that the prescribing, patient-care, and facility indicators did not fulfill many World Health Organization standards. Therefore, it is important if all prescribers, dispensers, patients themselves, and the governing bodies take an action to improve the prescribing and patient-care indicators for the best of the end users.
Keywords: Patient-care indicators, prescribing indicators, health-facility indicators, Ethiopia
Introduction
Medicines need special concern to be used in safe, effective, and rational manner. One of the factors that affect safe, effective, and rational use of drugs is prescribing pattern. 1 To say the medicine is rationally used, “Patients should receive drugs for the right diagnosis, in the appropriate dose, for adequate duration, and at the reasonable cost.”2–5 Medicines are vital entities to prevent, alleviate, treat, or cure diseases and are pillars for the well-being of communities.4,6 However, the overuse, underuse, or misuse of medicines (referred to as irrational medicine use) results with negative consequences like diseases worsening, disability, even premature death, and, in addition, it results in wastage of limited resources that further threatens future public health gains.4,7,8 Various studies conducted both in developed and developing countries revealed that irrational drug use is a global phenomenon regarding the safe and effective use of drugs. Hence, “Medicines are nothing unless used in a rational way with reason & prudence.”4,9
Greater than 50% of medicines in the world are prescribed, dispensed, or sold in an inappropriate way and of these 50% of patients did not take the drugs as prescribed. In addition, there is scarcity of essential medicines as evidenced through inaccessibility to one-third of the world’s population. 10 The inappropriate use of medicines may occur at any of the main stages of the medicines-use cycle (diagnosis, prescribing, dispensing, and patient adherence).11,12
When there is irrational medicine use, health conditions may be worsened, adverse events may be increased, which in turn results in unnecessary higher morbidity and mortality. It is also responsible for the occurrence of ineffective and unsafe treatment outcomes, exacerbation of health conditions, distress and damage to the patient, and incurs catastrophic health costs,13,14 and antibiotics overprescribing is the major driving force for the emergence of antibiotics resistance. 15 The commonest types of irrational medicines’ use are as follows: abusing antibiotics for non-bacterial infections, polypharmacy, lower dosage, and repetitive use of injections instead of effective oral formulations, failure to stick to the guidelines during prescribing, and incorrect self-medication of non-over-the-counter (OTC) drugs.13,16
For the purpose of assessing the rational drug use improvement, the World Health Organization (WHO) has set “core drug use indicators.” As to this, the performance of prescribers is measured by prescribing indicators, whereas patient-care indicators measure the time spent by prescribers and dispensers for each patient. Patients are expected to receive well-labeled medications and can understand how to take each drug. Rational prescribing and dispensing are measured by facility indicators and may be influenced by different factors in the settings.14,17
The irrational prescribing practice is still high in Ethiopia even though the governmental and different nongovernmental organizations are applying different strategies to decrease the irrational prescribing one of which is providing trainings for both prescribers and dispensers. 8 Many Ethiopian hospitals lack timely updated standard treatment guidelines, adequate capacity and systems that monitor and regulate medicine use, as well as appropriately educated healthcare providers. Due to such critical issue, it is very important to assess drug use situation, identifying problems, and designing intervention strategies that can be carried out to reduce identified problems in drug utilization.18,19 Even though several studies are available on prescription indicators in Ethiopian hospitals, most of them lack patient-care and facility indicators. Specifically, there was no a well-organized study conducted on rational drug use previously at Debre Tabor Comprehensive Specialized Hospital (DTCSH). Hence, this study is predominantly aimed at assessing the completeness of prescriptions and rational medicine use patterns at DTCSH by using WHO core drug use indicators (prescribing, patient-care, and facility indicators).
Methods
Study setting
This study was conducted at DTCSH, from 1 July 2020 to 30 June 2021. Debre Tabor is the capital city of South Gondar administrative zone which is 666 km from Addis Ababa, and the hospital was established in 1923. 20 Within DTCSH, there are five pharmacy outlets: outpatient department (OPD) pharmacy, in-patient pharmacy, anti-retro viral (ART) pharmacy, gynecology/obstetrics pharmacy, and emergency pharmacy. The OPD pharmacy has also three units: Store, Compounding, and Dispensing utilities which all are organized depending on Auditable Pharmaceutical Transactions and Services. Currently, the hospital is serving for more than 2.5 million people with these dispensaries. 21
Study design
A hospital-based cross-sectional study design was conducted both retrospectively and prospectively in DTCSH, Northwest Ethiopia. Retrospectively, the prescriptions were systematically selected from drug prescriptions retained at the dispensary of OPD pharmacy. Prospectively, 150 patients were selected to assess the patient-care indicators while observation was held to assess health-facility indicators. In the year, a total of 52,800 prescriptions were dispensed in the dispensary OPD. After determining the sample size, sampling interval was determined by dividing the total prescriptions to the sample size, which is 67. Then systematic random sampling was used and one prescription is taken in every 67 interval. The following formula was used to determine the sample size
where n is the sample size, p is the estimate of proportion of prescriptions with inappropriate prescription pattern, 0.5 since there is no research finding regarding estimate of inappropriate drug prescribing pattern in DTCSH, d is the margin of sampling error tolerated to be 3.5%, and z is the standard normal value at confidence interval of 95% = 1.96.
Hence, the sample size was calculated as
Therefore, systematically, 784 prescriptions were selected from OPD pharmacy. According to the WHO guideline, which recommends at least 600 encounters for such study, this number is enough. 22
Inclusion criteria
Prescriptions prescribed in the facility containing specific drugs and which are complete, clear, within a time frame (1 July 2020 to 30 June 2021), and with legible hand writing were included in the study. In addition, patients who are cooperative and able to talk were included for the prospective study.
Exclusion criteria
This study excluded all prescriptions (3 in number) that contain only medical supplies, prescriptions copied from other dispensaries, prescriptions from around health facilities, and prescriptions of nutritional supplements. In addition, prescriptions which are incomplete (0), unclear (0), prescribed beyond the indicated time (0), and with illegible hand writing were excluded (1). Similarly, for the prospective study, patients who were unable to talk, not willing to participate, and who were severely ill were excluded.
Statistical analysis
The tool to collect the data was prepared from different articles,1,22–25 and the data on prescribing indicators were collected retrospectively by five well-trained pharmacy professionals using written prescription papers from OPD pharmacy. The specific types of data necessary to measure the prescribing indicators were recorded for each patient’s encounter and entered directly into prescribing indicator form. 22 Out of 784 randomly selected prescriptions, data were collected from only 780 prescriptions retrospectively even if more than 52,800 prescriptions were written for a 1 year period (1 July 2020 to 30 June 2021). The data necessary to evaluate the prescribing indicators were written down for each patient’s encounter and were fed to a prepared ordinary prescribing recording format to be analyzed using Statistical Package for Social Sciences, version 25.
Prospectively, an exit interview and on-practice observation were conducted for 150 patients within five consecutive days, with 30 patients per day to obtain data on average dispensing time, average consultation time, percentage of drugs actually dispensed, patient’s knowledge of correct dosage, and percentage of drugs adequately labeled. 18 This number (150) was selected as per the WHO/International Networks for Rational Use of Medicines (INRUD) guidelines. 14 The patients were selected conveniently on the basis of the patient’s ability to communicate easily with the interviewer until the required sample size was attained. 26
Facility indicators like availability of essential drug list (EDL), essential medicine formulary (EMF), standard treatment guideline (STG), and other standard operating procedures (SOP) were checked by observation and by consulting with unit focal persons from all service delivery units. Finally, the statistical analysis, frequencies, averages/means, and percentages were computed.
Prescribing indicators
According to WHO guideline, prescribing indicators 22 used in this study are described as follows.
1. Average number of drugs per encounter: It is calculated to evaluate the presence or absence of polypharmacy. It is calculated by dividing the total amount of prescribed products to the number of surveyed encounters.
2. Percentage of drugs prescribed by generic name: This parameter is calculated to evaluate prescribing tendency whether it is by generic name or not. It is obtained by dividing the total number of drug generic names to the total number of prescribed drugs and then multiplied by 100.
3. Percentage of encounters in which an antibiotic was prescribed: It is applied to measure the pattern of overused and costly drugs.
It is calculated as follows:
4. Percentage of encounters with an injection prescribed: It is used to measure the level of commonly overused and costly drugs. It is the ratio of the number of prescribed encounters having injection and the total encounters surveyed, and then multiplied by 100.
5. Percentage of drugs prescribed from within an EDL: It is a measure of the closeness of the practices to the national drug policy as indicated in the national drug list of Ethiopia. This percentage was calculated by dividing number of products from EDL by the total number of drugs prescribed and then multiplied by 100.
6. Percentages of drugs actually dispensed: It is computed by dividing the number of drugs dispensed by the total number of prescribed drugs presented for dispensing. The actually dispensed drugs were obtained by critical observation on each encounter with no an “x” signs in front of the drug.
7. Average consultation time: It is calculated as follows
8. Average dispensing time: It is calculated as follows
9. Percentage of drugs actually dispensed: It is calculated as follows
10. Percentage of drugs adequately labeled: It is calculated as follows
11. Patient’s knowledge of correct dosage: This parameter is calculated using the following formula
Completeness of prescription indicators
1. Patient information
Name, sex, age, weight, ID, address, and diagnosis were observed in each prescription.
2. Treatment information
Drug name, dose, frequency, and duration of therapy were analyzed.
3. Information of prescribers
Name of the prescribing clinician, profession, date, and signature completeness were seen to be analyzed.
4. Information of dispensers
The completeness of name of the pharmacist/druggist, profession, date, and signature was checked.
Operational definitions
Rational drug use
It is the practice of prescribing the right drug, at the right time, in an adequate dose for the sufficient duration of time and to the right indication of the patient at affordable cost. 4
Generic name
It is an internationally accepted nonproprietary name of a drug described in the EDL, 4th Edition 2010, EMF-2nd Edition 2013, or STG-3rd Edition, 2016.
Prescription
It is a written information for ordering one or more medication(s), instructing how to dispense the drug. 8
Antibiotics
Antibiotics are medicines which are obtained from living things and used to prevent or treat bacterial diseases. 27
Indicators
These are variables created and validated by the WHO as they are approved to measure rational drug use over the most important irrational drug use in health facilities. 28
Results
A total of 780 encounters were assessed retrospectively and 150 patients were interviewed prospectively for patient-care indicators, and facility indicators were assessed in DTCSH from 1 July 2020 to 30 June 2021.
Prescribing indicators
One thousand five hundred twenty one drugs were obtained being prescribed on 780 encounters. The average number of drugs per prescription was 1.95 with a range between 1 and 7 drugs. The total number of drugs prescribed by generic name and within EDL of Ethiopia were 1519 (99.9%) and 1521 (100%), respectively. It was depicted in Table 1.
Table 1.
Prescribing indicators at DTCSH 1 July 2020 to 30 June 2021 (N = 780).
| Prescribing indicators assessed | Number of drugs | Percentage (%) | WHO standard or ideal value 29 |
|---|---|---|---|
| Average number of drugs per encounter | 1521 | 1.95 | 1.6–1.8 |
| Percentage of drugs prescribed by generic name | 1519 | 99.9 | 100% |
| Percentage of encounters with antibiotics | 276 | 35.4 | 20.0%–26.8% |
| Percentage of encounters with injection | 119 | 15.3 | 13.4%–24.1% |
| Percentage of drugs from essential drug list | 1521 | 100 | 100% |
WHO: World Health Organization.
The numbers of drugs prescribed in each encounter in this study were stated in Figure 1. From 780 encounters, 316 (40.51%) and 14 (1.8%) encounters contained one drug and ⩾5 drugs, respectively.
Figure 1.
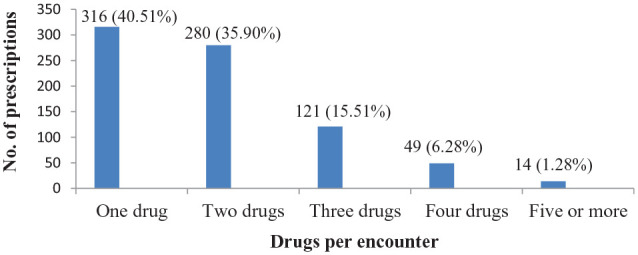
Number of drugs per encounter at DTCSH 1 July 2020 to 30 June 2021 (N = 780).
As indicated in Table 2, the number of standard prescriptions was 769 (98.59%). Specific information on the patients, prescribers, and dispensers are also explained in Table 2.
Table 2.
Completeness of prescription papers on specific information on the patient, prescribers, and dispensers at DTCSH, 1 July 2020 to 30 June 2021 (N = 780).
| Information | Frequency | Percentage (%) |
|---|---|---|
| Number of standard prescription | 769 | 98.59 |
| Patient-related information on the prescription | ||
| Name of the patient | 780 | 100 |
| Sex of the patient | 775 | 99.36 |
| Age of the patient | 777 | 99.62 |
| Weight of the patient | 0 | 0 |
| ID of the patient | 779 | 99.87 |
| Diagnosis of the patient | 706 | 90.51 |
| Address of the patient | 22 | 2.82 |
| Prescriber-related information on the prescription | ||
| Name of the prescriber | 730 | 93.59 |
| Profession of the prescriber | 476 | 61.03 |
| Signature of the prescriber | 756 | 96.92 |
| Date of prescribing | 124 | 15.9 |
| Dispenser-related information on the prescription | ||
| Name of the dispenser | 606 | 77.69 |
| Profession of the dispenser | 345 | 44.23 |
| Signature of the dispenser | 615 | 78.85 |
| Date of dispensing | 512 | 65.64 |
Completeness of encounters with different medicine information filled by prescribers was depicted in Figure 2. Frequency of drug administration (97.18%) followed by route of the administration (88.85%) was the leading filled information. Whereas dosage form of the prescribed drugs was the least information obtained from the encounters.
Figure 2.

Completeness of encounters at DTCSH, 1 July 2020 to 30 June 2021 (N = 780).
Patient-care indicators
In Table 3, patient-care indicators are stated.
Table 3.
Patient-care indicators at DTCSH, 1 July 2020 to 30 June 2021 (N = 150).
| Patient-care indicators | Outcome | Percentage (%) |
|---|---|---|
| Percentage of drugs adequately labeled | 15 | 10 |
| Percentage of drugs actually dispensed | 141 | 94.01 |
| Patients’ knowledge of correct dosage | 94 | 62.67 |
| Percentage of patient satisfaction | 134 | 89.33 |
| Average dispensing time | 38.22 |
From 150 patients who were assessed prospectively on their knowledge of medication profiles, 141 (94%) and only 5 (3.33%) patients had knowledge on “the correct dose of dispensed medicines” and “the names of dispensed medicines,” respectively (Figure 3).
Figure 3.

Patients’ knowledge on medicines at DTCSH, 1 July 2020 to 30 June 2021 (N = 150).
Health-facility indicators
During data collection period, health-facility indicators were assessed for the availability of guidelines. The guidelines that were available in at least one copy at the service delivery unit for proper use were STG-2016, EMF-2013, Facility Specific Drug Lists, Good prescribing and dispensing manuals, Drug and Therapeutic Committee SOP, Drug Information Service SOP, and EDL. In addition, ART guideline, tuberculosis guideline, and mother and child health guidelines were also in place in the hospital. Percentage availability of essential documents was 95% during data collection period.
Discussion
In Ethiopian hospitals, several studies are conducted on prescription indicators. But most of them lack patient-care and facility indicators in some health facilities. This study was conducted to fill this gap in DTCSH.
The average number of drugs per encounter, 1.95, is acceptable when compared with WHO standard (1.6–1.8) derived as ideal scenario and with other research results.3,18,30,31 This result is lower when compared with studies conducted in Eastern Ethiopia, 32 and Arba Minch General Hospital. 12 But this result is higher comparatively with studies conducted at Tibebe-Ghion Comprehensive Specialized Hospital (TGCSH), 25 Dessie Referral Hospital, 33 and two district Hospitals in Northwest Ethiopia. 34 Keeping the mean number of drugs per encounter as low as possible is always important to reduce the risk of drug–drug interaction, dispensing errors, development of drug resistance, poor knowledge of the dosage regimen, adverse drug reactions, and missing of desired therapeutic outcomes.
The percentage of drugs prescribed by generic names in DTCSH was found to be 99.9%, which is almost similar to the WHO standard (100%). This result is similar where compared with studies carried out at Hawassa University Teaching and Referral Hospital (98.7%), 3 Lumame Primary Hospital (97.9%), 24 Arba Minch General Hospital (100%), 12 and at selected health facilities in Eastern Ethiopia (97%). 32 But lower results were reported in studies at government and private hospitals in Eastern Ethiopia (89.01%),7,35 selected hospitals of West Ethiopia (79.2%), 9 and TGCSH (85.78%), 25 and even lower result was reported at Secondary Care Referral Hospitals of South India (42.9%). 36 Promoting generic prescribing has advantages to rationalize the use and reduce the cost of treatment, to improve access to medicines, and consequently, to increase patient compliance. 37
The percentage of encounters containing one or more injectable drugs was 15.3%, which is within WHO acceptable range. Results within WHO acceptable ranges were obtained at Ayder Referral hospital (23.6%) 13 and at University of Gondar Comprehensive Specialized Hospital (20%). 32 However, encounters with injectable medications with more than WHO acceptable ranges and the current study were reported in studies conducted at four selected hospitals of West Ethiopia (28.3%), 9 Mekele General hospital (42.2%), 8 TGCSH (25%), 25 Dessie Referral hospital (31%), 33 and at government hospitals in Eastern Ethiopia (26.5%). 35 But lower results were reported at Lumame Primary Hospital and health facilities in Eastern Ethiopia (11.2%).24,32 However, percentage of patients who received antibiotics was 35.4%, which is higher compared to the WHO standard (20.0%–26.8%). Even if unacceptable result is reported in this study, it was supported by other studies conducted at Selected hospitals of West Ethiopia (54.7%), 9 Mekele General hospital (58.6%), 8 Lumame primary hospital (48.8%), 24 and Dessie Referral hospital (52.8%). 33 Although there is a decrement in antibiotic use at DTCSH, it needs further improvements.
Another factor affecting the quality of healthcare is patient-care practices. The average consultation time for patients was 38.22 s. This was very lower where compared with studies conducted at Southern and Eastern Ethiopian hospitals31,32 and at Secondary Care Referral Hospital of South India. 36 Although clear communication of patients with healthcare providers helps them to get enough information about their medications and enhance their adherence, the patient load might mask it and might be a major reason for low consultation periods. 38
The percentage of drugs actually dispensed and adequately labeled were 94.01% and 10%, respectively. Other studies reported higher results of clear labeling31,32 and strict labeling was practiced in India (99.3%). 36 But availability of medicines which was measured by actual dispensing was relatively acceptable. The same actual dispensing results were reported in researches held at South India 36 and at Lumame Primary hospital. 34
The knowledge of patients on correct dose was 94% in DTCSH. This result is higher when compared with researches conducted at health facilities in Eastern Ethiopia, 32 Lumame Primary hospital, 34 and TGCSH. 25 This might be the reason why patients lack adequate knowledge about their medications in all aspects.
The study has limitations
The selection method of samples for prospective study was convenient sampling which may not be representative and power calculation for sample size determination was not computed. In addition, the questionnaire was not pilot tested.
Conclusion
It is possible to conclude that almost all WHO standards in most encounters were not complete. The study showed the availability of standard prescription papers, availability of health-facility indicators, prescribing from facility-specific medicine list, percentage of drugs prescribed by generic names, and percentage of encounters with injectable drugs were within the ranges of WHO standards. On the contrary, some indicators, such as percentage of encounters with an antibiotic, date of prescribing and dispensing, and address and weight of the patient, deviated from the standards recommended by the WHO. Other patient-care indicators like dispensing time, counseling time, and labeling of medicines were also lower than the standards. Finally, it is important if all the concerned bodies take an action to improve the prescribing and patient-care indicators for the best of the end users.
Supplemental Material
Supplemental material, sj-docx-1-smo-10.1177_20503121221122422 for Evaluation of prescription completeness, rational drug-use patterns using WHO prescribing, patient-care and facility indicators in Debre Tabor Comprehensive Specialized Hospital, Ethiopia: A cross-sectional study by Yohannes Shumet Yimer, Getu Tesfaw Addis and Muluken Adela Alemu in SAGE Open Medicine
Acknowledgments
The authors would like to acknowledge DTCSH.
Footnotes
Authors’ Contribution: All authors made significant contributions to this work. All the authors are involved in the conception, execution, study design, acquisition of data, analysis and interpretation, drafting, revising or critically reviewing, and approving final draft, and agree to be accountable for all aspects of the work.
Availability of data and materials: The datasets are available from the corresponding author upon reasonable request.
Declaration of conflicting interests: The author(s) declared no potential conflicts of interest with respect to the research, authorship, and/or publication of this article.
Funding: The author(s) received no financial support for the research, authorship, and/or publication of this article.
Ethical approval: Ethical Approval Letter was obtained from Ethical Review Committee of Debre Tabor University, College of Health sciences with reference number of DTU1564/2020 and verbal informed consent was obtained from each subject for prospective data collection. The contents of the consent were first approved by Ethical Review Committee of Debre Tabor University, College of Health Sciences. In addition, a written formal letter was obtained from the medical director of the hospital with a reference number DTH2148/2020.
Informed consent: Verbal informed consent was obtained from all subjects before the study. The contents of the consent were first approved by Ethical Review Committee of Debre Tabor University, College of Health Sciences.
ORCID iDs: Yohannes Shumet Yimer  https://orcid.org/0000-0001-5871-3589
Getu Tesfaw Addis
https://orcid.org/0000-0002-4495-8566
Supplemental material: Supplemental material for this article is available online.
References
- 1. Bergicho M, Mohammed MA, Wabe NT. Assessment of the pattern of drug prescribing in pediatrics ward in tertiary setting hospital in Addis Ababa, Ethiopia. Gaziantep Med J 2012; 18(2): 61–65. [Google Scholar]
- 2. SIAPS. Strengthening Pharmaceutical Systems Program. Promoting the Rational Use of Medicines. Arlington, VA: Management Sciences for Health, 2015. [Google Scholar]
- 3. Desalegn AA. Assessment of drug use pattern using WHO prescribing indicators at Hawassa University teaching and referral hospital, South Ethiopia: a cross-sectional study. BMC Health Serv Res 2013; 13(1): 1–6. [DOI] [PMC free article] [PubMed] [Google Scholar]
- 4. World Health Organization. The rational use of drugs. Report of a conference of experts Nairobi, 25-29 November 1985. Geneva: World Health Organization, 1985. [Google Scholar]
- 5. Alam K, Mishra P, Prabhu M, et al. A study on rational drug prescribing and dispensing in outpatients in a tertiary care teaching hospital of Western Nepal. Kathmandu Univ Med J 2006; 4(4): 436–443. [PubMed] [Google Scholar]
- 6. Bantie L. Assessment of drug prescription practice using WHO prescribing indicators in Felege Hiwot Referral Hospital (FHRH) outpatient department, North Ethiopia. Int J Pharm 2014; 4: 89–94. [Google Scholar]
- 7. Warsame MS. Drug use pattern using WHO prescribing indicators at Sheikh Sultan Hassan Yabere Referral Hospital, Eastern Ethiopia: a cross sectional study. J Drug Deliv Ther 2020; 10(4-s): 34–38. [Google Scholar]
- 8. Yilma Z, Liben M. Assessment of drug prescription pattern in Mekelle General Hospital, Mekelle, Ethiopia, using World Health Organization prescribing indicators. Biomed Res Int 2020; 2020: 3809157. [DOI] [PMC free article] [PubMed] [Google Scholar]
- 9. Lenjisa JL, Fereja TH. A retrospective analysis of prescribing practices through WHO prescribing indicators at four selected hospitals of West Ethiopia. J Bioanal Biomed 2014; 6(2): 29. [Google Scholar]
- 10. Blum N. Drug information development a case study Nepal. Rational pharmaceutical management project, United States Pharmacopoeia. 2000. (Online). [Google Scholar]
- 11. Management Sciences for Health. MDS-3: Managing access to medicines and health technologies. Arlington, VA: Management Science for Health, 2012. [Google Scholar]
- 12. Mensa MT, Tadesse A, Ayele A. Assessment of drug use pattern by using WHO core drug use indicators at public hospitals in Ethiopia. J Community Med Health Educ 2017; 7(559): 2161–2711. [Google Scholar]
- 13. Demeke B, Molla F, Assen A, et al. Evaluation of drugs utilization pattern using WHO prescribing indicators in Ayder Referral Hospital, Northern Ethiopia. IJPSR 2015; 6(2): 343–347. [Google Scholar]
- 14. WHO. Promoting rational use of medicines: core components. Geneva: World Health Organization, 2002. [Google Scholar]
- 15. Worku F, Tewahido D. Retrospective assessment of antibiotics prescribing at public primary healthcare facilities in Addis Ababa, Ethiopia. Interdiscip Perspect Infect Dis 2018; 2018:4323769. [DOI] [PMC free article] [PubMed] [Google Scholar]
- 16. WHO. The pursuit of responsible use of medicines: sharing and learning from country experiences. Geneva: World Health Organization, 2012. [Google Scholar]
- 17. Kaiser BM. World Health Organization’s essential medicines list: from idea to implementation. Geneva: World Health Organization, 2019. [Google Scholar]
- 18. Angamo MT, Wabe NT, Raju NJ. Assessment of patterns of drug use by using World Health Organization’s prescribing, patient care and health facility indicators in selected health facilities in Southwest Ethiopia. J Appl Pharm Sci 2011: 1: 62–66. [Google Scholar]
- 19. Sisay M, Mengistu G, Molla B, et al. Evaluation of rational drug use based on World Health Organization core drug use indicators in selected public hospitals of Eastern Ethiopia: a cross sectional study. BMC Health Serv Res 2017; 17(1): 1–9. [DOI] [PMC free article] [PubMed] [Google Scholar]
- 20. Damtie S, Workineh L, Kiros T, et al. Hematological abnormalities of adult HIV-infected patients before and after initiation of highly active antiretroviral treatment at Debre Tabor Comprehensive Specialized Hospital, northcentral Ethiopia: a cross-sectional study. HIV AIDS 2021; 13: 477–484. [DOI] [PMC free article] [PubMed] [Google Scholar]
- 21. Tesfaw A, Eshetu M, Teshome F, et al. Prevalence of head injury among trauma patients at Debre Tabor Comprehensive Specialized Hospital, North Central Ethiopia. Open Access Surg 2021; 14: 47. [Google Scholar]
- 22. Action Programme on Essential Drugs and Vaccines (World Health Organization). How to investigate drug use in health facilities: selected drug use indicators. EDM Research Series, no. 7, 1993. Geneva: World Health Organization. [Google Scholar]
- 23. Desalegn AA. Assessment of drug use pattern using WHO prescribing indicators at Hawassa University teaching and referral hospital, South Ethiopia: a cross-sectional study. BMC Health Serv Res 2013; 13(1): 1–6. [DOI] [PMC free article] [PubMed] [Google Scholar]
- 24. Alehegn AA, Aklilu RG, Tadesse KA, et al. Assessment of drug use practices using standard WHO indicators in Lumame Primary Hospital. Drug healthc Patient Saf 2021; 13: 59. [DOI] [PMC free article] [PubMed] [Google Scholar]
- 25. Yilma Z, Mekonnen T, Siraj EA, et al. Assessment of prescription completeness and drug use pattern in Tibebe-Ghion comprehensive specialized hospital, Bahir Dar, Ethiopia. Biomed Res Int 2020; 2020: 8842515. [DOI] [PMC free article] [PubMed] [Google Scholar]
- 26. Etikan I, Bala K. Sampling and sampling methods. Biom Biostat Int J 2017; 5(6): p00149. [Google Scholar]
- 27. Bhattacharjee MK. Chemistry of antibiotics and related drugs. New York: Springer, 2016, 1–25. [Google Scholar]
- 28. Masoud A, Noori Hekmat S, Dehnavieh R, et al. An investigation of prescription indicators and trends among general practitioners and specialists from 2005 to 2015 in Kerman, Iran. Int J Health Policy and Managt 2018; 7(9): 818. [DOI] [PMC free article] [PubMed] [Google Scholar]
- 29. Atif M, Sarwar MR, Azeem M, et al. Assessment of WHO/INRUD core drug use indicators in two tertiary care hospitals of Bahawalpur, Punjab, Pakistan. J Pharm Policy Pract 2016; 9: 27–28. [DOI] [PMC free article] [PubMed] [Google Scholar]
- 30. Ayalew Getahun K, Sitotie Redia A, Jemere Aragaw T. Evaluation of medicine-use pattern using World Health Organization’s core drug-use indicators and completeness of prescription at University of Gondar Comprehensive Specialized Hospital, Gondar, Ethiopia: cross-sectional study. Integr Pharm Res Pract 2020; 9: 219–227. [DOI] [PMC free article] [PubMed] [Google Scholar]
- 31. Gidebo KD, Summoro TS, Kanche ZZ, et al. Assessment of drug use patterns in terms of the WHO patient-care and facility indicators at four hospitals in Southern Ethiopia: a cross-sectional study. BMC Health Serv Res 2016; 16(1): 1–8. [DOI] [PMC free article] [PubMed] [Google Scholar]
- 32. Bilal AI, Osman ED, Mulugeta A. Assessment of medicines use pattern using World Health Organization’s prescribing, patient care and health facility indicators in selected health facilities in Eastern Ethiopia. BMC Health Serv Res 2016; 16(1): 1–8. [DOI] [PMC free article] [PubMed] [Google Scholar]
- 33. Assen A, Abrha S. Assessment of drug prescribing pattern in Dessie Referral Hospital, Dessie. Int J Pharm Sci Res 2014; 5(11): 777–781. [Google Scholar]
- 34. Wubetu M, Derebe D, Belete TM, et al. Assessment of drug prescription pattern in two district hospitals, Northwest Ethiopia. J Health Educ Res Dev 2018: 6; 246. [Google Scholar]
- 35. Gashaw T, Sisay M, Mengistu G, et al. Investigation of prescribing behavior at outpatient settings of governmental hospitals in Eastern Ethiopia: an overall evaluation beyond World Health Organization core prescribing indicators. J Pharm Policy Pract 2018; 11: 26–11. [DOI] [PMC free article] [PubMed] [Google Scholar]
- 36. Prasad PS, Rudra J T, Vasanthi P, et al. Assessment of drug use pattern using World Health Organization core drug use indicators at Secondary Care Referral Hospital of South India. CHRISMED J Health Res 2015; 2(3): 223. [Google Scholar]
- 37. Shrestha R, Shrestha S, Sapkota B, et al. Generic medicine and generic prescribing in Nepal: an implication for policymakers. J Multidiscip Healthc 2022; 15: 365–373. [DOI] [PMC free article] [PubMed] [Google Scholar]
- 38. Ahmad BA, Khairatul K, Farnaza A. An assessment of patient waiting and consultation time in a primary healthcare clinic. Malays Fam Physician 2017; 12(1): 14–21. [PMC free article] [PubMed] [Google Scholar]
Associated Data
This section collects any data citations, data availability statements, or supplementary materials included in this article.
Supplementary Materials
Supplemental material, sj-docx-1-smo-10.1177_20503121221122422 for Evaluation of prescription completeness, rational drug-use patterns using WHO prescribing, patient-care and facility indicators in Debre Tabor Comprehensive Specialized Hospital, Ethiopia: A cross-sectional study by Yohannes Shumet Yimer, Getu Tesfaw Addis and Muluken Adela Alemu in SAGE Open Medicine