Figure 7.
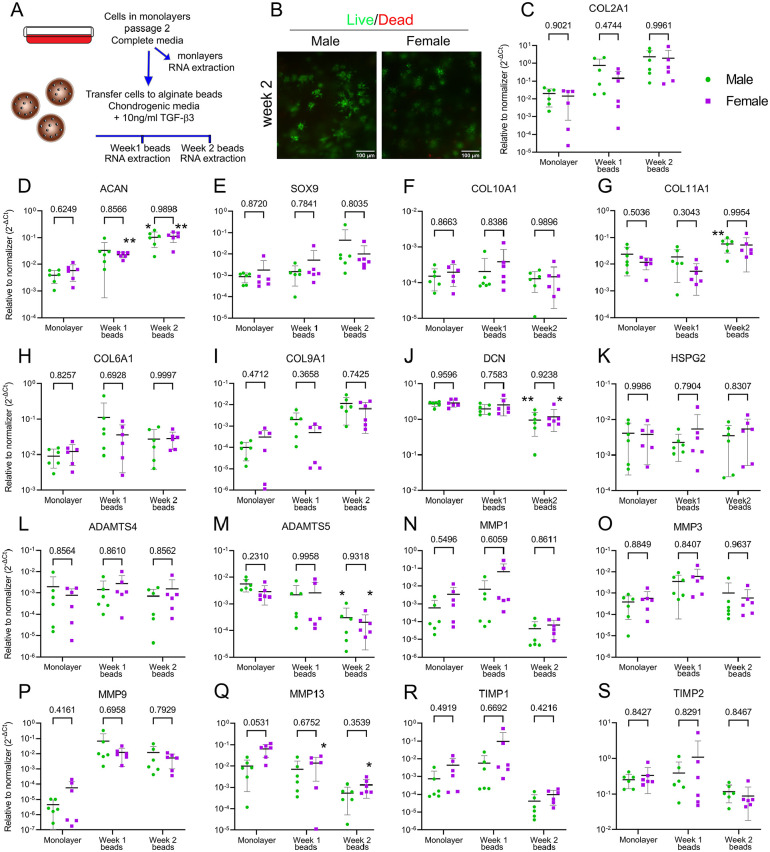
No dimorphism was detected in chondrocyte regenerative function. (A) Schematics of the experimental design. (B) Representative images showing high viability of cells kept for up to 2 weeks in alginate beads in the presence of 10 ng/ml of TGF-β3. Live cells are in green (calcein) and dead are in red (ethidium homodimer-1; scale bar, 100 µm). (C-S) A qPCR analysis was done on the expression of COL2A1, ACAN, SOX9, COL6A1, COL9A1, COL10A1, COL11A1, MMP1, MMP3, MMP9, MMP13, ADAMTS4, ADAMTS5, TIMP1, and TIMP2. Data are shown as mean ± SD of relative quantity to normalizer (18S and SDHA were used as normalizers). Males are shown as green circles and females as purple squares. Cells originate from 6♂ + 6♀ in passage 2. Shown P values indicate comparison between sexes per time point (two-way ANOVA with Sidak’s test for multiple comparisons). The * indicates P < 0.05 and ** indicates P < 0.001 comparing relative quantities of Week 1 to monolayer and Week 2 to monolayer per sex (repeated measures two-way ANOVA with Dunnett’s test for multiple comparisons). TGF-β3 = transforming growth factor β3; qPCR = quantitative polymerase chain reaction; MMP = metalloprotease; ADAMTS = a disintegrin and metalloproteinase with thrombospondin motifs; ACAN = agreccan; COL = collagen; SOX9 = SRY (sex determining region Y)-Box 9; HSPG2 = heparan sulfate proteoglycan 2 (perlecan); SDHA = succinate dehydrogenase complex flavoprotein subunit A; TIMP = tissue inhibitor of metalloproteases; ANOVA = analysis of variance.

