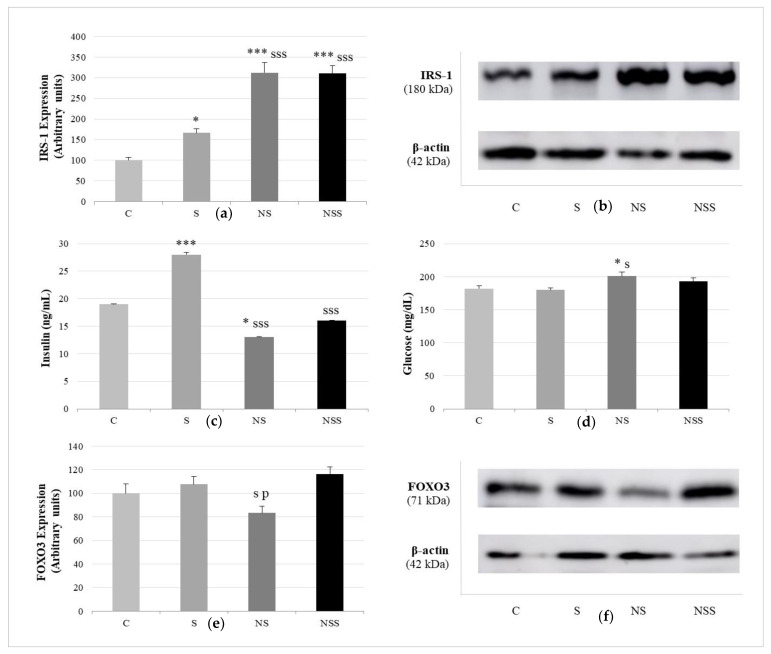
Figure 5.
Pro-adipogenic pathways: insulin signaling and FOXO3a-autofaghy. Expression of IRS-1 (expressed as percent arbitrary relative units, referring to values in control animals, which were defined as 100%) (a). Representative Western blot for the expression of IRS-1 and β-actin (as load control) (b). Insulin levels (c). Glucose levels (d). Expression of FOXO3 (expressed as percent arbitrary relative units, referring to values in control animals, which were defined as 100%) (e). Representative Western blot for the expression of FOXO3 and β-actin (as load control) (f). The results were expressed as means ± SEMs and analyzed using a multifactorial one-way ANOVA followed by Tukey’s test. The number of animals in each group was 6. SEM: standard error of the mean. Groups: C, control group; S, low-selenite group; NS, low-selenite-nanoparticle group; NSS, moderate-selenite-nanoparticle group. Significance: vs. C, * p < 0.05, *** p < 0.001; vs. S, s p < 0.05, sss p < 0.001; vs. NP, p p < 0.05.

