Abstract
Background
Berberine (BBR), an isoquinoline alkaloid isolated from Rhizoma Coptis, is widely used in the treatment of hyperlipidemia (HLP) in China. At present, the efficacy of BBR against HLP is relatively clear, but there are few researches on its mechanism. The purpose of this study was to evaluate the potentially beneficial role of BBR in HLP hamster models, as well as investigate its possible mechanisms and potential lipid biomarkers in combination with network pharmacology.
Methods
HLP hamster model was induced by high-fat diet. Hematoxylin—eosin (HE) staining was used to determine the degree of hepatic pathological injury. Liquid chromatography-mass spectrometry was used to analyze lipid metabolism profiles of liver samples, and multiple statistical analysis methods were used to screen and identify lipid biomarkers. The possible molecular mechanism was unraveled by network pharmacology.
Results
The results showed that 13 metabolites, including CE (16:1), HexCer (D18:1/19:0) and LPC (O-22:0) were biomarkers of BBR regulation. CHPT1, PLA2G4A, LCAT and UGCG were predicted as the lipid-linked targets of BBR against HLP, whilst glycerophospholipid and sphingolipid metabolism were the key pathways of BBR against HLP.
Conclusions
In summary, this study provides new insights into the protective mechanism of BBR against HLP through network pharmacology and lipidomic approaches.
Supplementary Information
The online version contains supplementary material available at 10.1186/s12967-022-03623-0.
Keywords: Berberine, Hyperlipidemia, Lipidomics, Network pharmacology
Introduction
Hyperlipidemia (HLP) is a metabolic disease caused by abnormal fat metabolism, which is mainly manifested by an abnormal increase of Total cholesterol (TC), Triglyceride (TG) and low-density lipoprotein-cholesterol (LDL-C) levels in the blood [1]. The incidence of HLP has increased rapidly due to improved lifestyles and an increase in high-energy diets, which has been identified as a major risk factor for various cardiovascular diseases [2]. Therefore, it is particularly important to strengthen the effective prevention and regular treatment of the disease. At present, statins are the first choice for regulating abnormal blood lipids and lowering lipids, but long-term use of statins has muscle toxicity and liver toxicity. Phytotherapy has be considered an interesting tool in the treatment of diseases, which involves the use of active ingredients or plant extracts [3]. The active ingredients of traditional Chinese medicine have attracted increasing attention of researchers due to their advantages of stable curative effect and few side effects.
Berberine (BBR) is an isoquinoline alkaloid isolated from Coptidis Rhizoma, which has traditionally been used to treat diarrhea. Modern pharmacological studies have shown that BBR can relieve dyslipidemia and glucose metabolism. BBR has an anti-HLP effect, which enhances LDL receptor (LDLR) expression through stabilizing the LDLR mRNA [4] and suppressing transcription of proprotein convertase subtilisin/kexin type 9 (PCSK9) [5]. BBR could improve insulin resistance and maternal–fetal outcomes of gestational diabetes mellitus rats through modulation of IKK/NF-kB, JNK, and IRS-1/AKT signaling pathways in the liver [6]. BBR could also increase adipose triglyceride lipase in 3T3-L1 adipocytes through the adenosine monophosphate (AMP)-activated protein kinase (AMPK) pathway to maintain lipid homeostasis [7]. Chang demonstrated that BBR could alter circulating ceramides to improve nonalcoholic fatty liver disease [8]. However, there is no characterization of lipid metabolism before and after berberine treatment with HLP.
Lipids are involved in various physiological processes and play an important role in energy conversion, cell signal transduction, cell differentiation and apoptosis [9]. The liver plays a major role in lipid metabolism, and abnormal hepatic lipid metabolism is closely related to the occurrence and development of HLP [10]. Lipidomics is a new omics research technique that can determine lipid composition and identify lipid biomarkers at the molecular level to study the pathogenesis of lipid metabolism-related diseases [11]. Network pharmacology is a new discipline to understand the interaction between drugs and diseases from a new perspective and guide the development of new drugs. Under the guidance of Systems Biology, the network construction method of "drug ingredients-action target-signal pathway-treatment mechanism" is used to intuitively display the pathways and pathways of the effective drug ingredients in treating related diseases, which is helpful to promote the study of the material basis and molecular mechanism of the effectiveness of Traditional Chinese Medicine [12].
In this study, we developed a novel integrated strategy to explore the biological mechanisms of BBR therapy for HLP based on lipidomics and network pharmacology. First, lipid biomarkers and pathways were analyzed by lipidomics and multivariate data analysis based on UHPLC-QTRAP-MS/MS. Secondly, the potential targets of BBR for HLP treatment were predicted through network pharmacology. Finally, the common goals of lipidomics and network pharmacology were analyzed to investigate the therapeutic mechanisms of BBR. This study is helpful to establish the relationship between biomarkers and hub genes, and provides a scientific basis for accurate screening of biomarkers. This study also provides a new idea for the clinical treatment of HLP and the systematic study of the effective ingredients of Traditional Chinese medicine.
Materials and methods
Chemicals and reagents
BBR (061002, purity > 98%) was obtained from Sichuan Xieli Pharmaceutical Co. Ltd. (Sichuan, China). Serum biochemistry kits for determining the levels of serum total cholesterol (TC), total triglyceride (TG) and low-density lipoprotein cholesterol (LDL-C) were supplied by Zhongsheng Beikong Biotechnology Co., Ltd. (Beijing, China). Methanol, acetonitrile, isopropanol and formic acid were provided by Merck. (Frankfurt, Germany). The reference standards were purchased from Shanghai ZZ biotechnology Co., Ltd. (Shanghai, China).
Animal experiments
Golden Syrian Hamsters (120 ± 10 g) were purchased from Hebei INVIVO Biotech Co. Ltd. The animal experiments were processed according to the Guidelines for Animal Experimentation of Hebei INVIVO Biotechnology Co., Ltd. Before the experiment, the animals were put in a temperature friendly room with free food and water for at least a week.
Eighteen male Golden Syrian Hamsters aged 8–10 weeks were randomly selected. After one week of adaptive feeding, they were randomly divided into three groups: Normal-fat diet group (NFD), high-fat diet group (HFD), and BBR administration group (BBR), with six hamsters in each group. The NFD group was fed with standard laboratory rat chow, and the HFD group was fed with diet of 40% fructose, 20% lard, 0.5% cholesterol and 39.5% standard laboratory rat chow (Hebei INVIVO Biotech Co. Ltd). After two weeks of continuous feeding, there were significant differences in serum lipid indexes between NFD group and HFD group, and the HLP model was successfully established. Then the BBR group was given BBR (200 mg/kg) [13, 14] by gavage while feeding on diet of HFD group, once a day for 14 consecutive days. The hamsters in the other groups were given the same dose distilled water by gavage.
Biochemical indexes and hepatic histopathological analysis
The serum concentrations of total cholesterol (TC), triglyceride (TG) and low-density lipoprotein (LDL-C) were analyzed by automatic biochemical analyzer (CMax Plus). Hematoxylin and eosin staining (H&E) staining was carried out to assess hepatic vacuolization according to a standard procedure of the previous reports [15]. Meanwhile, the frozen sections were stained with Oil Red O (ORO) to further validate quantify lipid droplets.
Liver lipidomics analysis
Liver tissues (50 mg) were homogenized in a 2 mL lipid extract mixture (methyl tert-butyl ether: methanol = 3:1, V/V), including 54 kinds of internal standard substances (Table 1). After homogenization, the mixture was vortexed for 2 min and then centrifuged at 12,000 rpm at 4 ℃ for 10 min. 200 μL supernatant was absorbed and evaporated to dryness under a stream of N2. Finally, the lipid extracts were redissolved in 200 μL lipid complex solution (acetonitrile: isopropanol = 1:9, V/V) for LC–MS/MS analysis. Additionally, the quality control (QC) samples were prepared by mixing equal amounts of supernatant from all samples.
Table 1.
The internal standard information
| Serial number | Classification | Glass | Name | Internal standard concentration μM (μmol/L) |
|---|---|---|---|---|
| 1 | Phosphatidylcholine | PC | PC(16:0/16:0)-d9 | 0.2 |
| 2 | Oxidized lipids | Eicosanoid | 5S-HETE-d8 | 0.04 |
| 3 | Free fatty acid | FFA | Arachidonic Acid-d8 | 0.2 |
| 4 | Acyl carnitine | CAR | CAR(16:0)-d3 | 0.04 |
| 5 | Cholesterol ester | CE | CE(18:1)-d7 | 2 |
| 6 | ceramide | Cer | Cer(d18:1/15:0)-d7 | 0.1 |
| 7 | ceramide | Cer | Cer(d18:1-d7/16:0) | 0.1 |
| 8 | ceramide | Cer | Cer(d18:1-d7/18:0) | 0.1 |
| 9 | ceramide | Cer | Cer(d18:1-d7/24:0) | 0.1 |
| 10 | ceramide | Cer | Cer(d18:1-d7/24:1) | 0.1 |
| 11 | phytoceramide | Cert | Cer(t18:0/22:0-d3) | 0.1 |
| 12 | Ceramide 1-phosphate | CerP | CerP(d18:1/8:0) | 0.4 |
| 13 | cholesterol | Cho | cholesterol-d7 | 5 |
| 14 | Coenzyme Q | CoQ | CoQ10-d9 | 0.2 |
| 15 | diglyceride | DG | DG(17:0/17:0)-d5 | 0.2 |
| 16 | Free fatty acid | FFA | FFA(16:0)-d31 | 0.2 |
| 17 | Bile acid | BA | GCDCA-d4 | 0.2 |
| 18 | Sugar sheath fat | HexCer | HexCer(d18:1-d5/18:0) | 0.4 |
| 19 | Lysophosphatidic acid | LPA | LPA(17:0) | 0.5 |
| 20 | Lysophosphatidylcholine | LPC | LPC(15:0)-d5 | 0.2 |
| 21 | Lysophosphatidylcholine | LPC | LPC(16:0)-d31 | 0.2 |
| 22 | Lysophosphatidylcholine | LPC | LPC(17:0)-d5 | 0.2 |
| 23 | Lysophosphatidylcholine | LPC | LPC(18:1)-d7 | 0.2 |
| 24 | Lysophosphatidylethanolamine | LPE | LPE(15:0)-d5 | 0.2 |
| 25 | Lysophosphatidylethanolamine | LPE | LPE(18:1)-d7 | 0.2 |
| 26 | Lysophosphatidyl glycerol | LPG | LPG(15:0)-d5 | 0.2 |
| 27 | Lysophosphatidyl glycerol | LPG | LPG(17:1) | 0.2 |
| 28 | Lysophosphatidylinositol | LPI | LPI(17:1) | 0.2 |
| 29 | Lysophosphatidylserine | LPS | LPS(17:1) | 0.2 |
| 30 | monoglyceride | MG | MG(18:1-d7) | 0.5 |
| 31 | Phosphatidic acid | PA | PA(17:0/17:0) | 0.5 |
| 32 | Phosphatidylcholine | PC | PC(15:0/18:1(d7)) | 0.2 |
| 33 | Phosphatidylcholine | PC | PC(16:0-d31/18:1) | 0.2 |
| 34 | Phosphatidylcholine | PC | PC(14:0/14:0)-d9 | 0.2 |
| 35 | Phosphatidylethanolamine | PE | PE(15:0/18:1(d7)) | 0.2 |
| 36 | Phosphatidylethanolamine | PE | PE(16:0-d31/18:1) | 0.2 |
| 37 | Phosphatidylethanolamine | PE | PE(17:0/14:1)-d5 | 0.2 |
| 38 | Phosphatidylethanolamine | PE | PE(17:0/18:1)-d5 | 0.2 |
| 39 | Phosphatidylethanolamine | PE | PE(17:0–22:4)-d5 | 0.2 |
| 40 | Phosphatidyl glycerol | PG | PG(15:0/18:1(d7)) | 0.4 |
| 41 | Phosphatidyl glycerol | PG | PG(16:0/d31/18:1) | 0.4 |
| 42 | Phosphatidylinositol | PI | PI(16:0-d31/18:1) | 0.2 |
| 43 | Phosphatidyl methanol | PMeOH | PMeOH(16:0/16:0) | 0.1 |
| 44 | Phosphatidylserine | PS | PS(15:0/18:1(d7)) | 0.4 |
| 45 | Phosphatidylserine | PS | PS(16:0(d31)/18:1) | 0.4 |
| 46 | Phosphatidylserine | PS | PS(16:0/16:0)-d9 | 0.4 |
| 47 | sphingomyelin | SM | SM(d18:1/18:1)-d9 | 0.2 |
| 48 | sphingomyelin | SM | SM(d18:1/20:1)-d9 | 0.2 |
| 49 | sphingomyelin | SM | SM(d18:1/22:1)-d9 | 0.2 |
| 50 | sphingomyelin | SM | SM(d18:1-d9/15:0) | 0.2 |
| 51 | sphingosine | SPH | SPH(18:1)-d7 | 0.04 |
| 52 | triglycerides | TG | TG(14:0/16:1/14:0)-d5 | 0.2 |
| 53 | triglycerides | TG | TG(16:0–15:1–16:0)-d5 | 0.2 |
| 54 | triglycerides | TG | TG(17:0/17:1/17:0)-d5 | 0.2 |
Chromatography-mass spectrometry acquisition conditions
Data acquisition instrument system mainly includes Ultra Performance Liquid Chromatography (UPLC) (ExionLC™ AD, https://sciex.com.cn/) and Tandem Mass Spectrometry (MS/MS) (QTRAP® 6500+, https://sciex.com.cn/).
The liquid chromatography was performed on the Thermo Accucore™C30 column (2.6 μm, 2.1 mm × 100 mm I.D.). Mobile phase A: acetonitrile/water (60/40, V/V) (containing 0.1% formic acid, 10 mmol/L ammonium formate). Mobile phase B: acetonitrile/isopropyl alcohol (10/90, V/V) (containing 0.1% formic acid, 10 mmol/L ammonium formate). Gradient elution procedure: 0–2 min, 20–30%B; 2–4 min, 30–60%B; 4–9 min,60–85%B; 9–14 min, 85–90%B; 14–15.5 min, 90–95%B; 15.5–17.3 min, 95%B; 17.3–17.5 min, 95–20%B; 17.5–20 min, 20%B. The flow rate was 0.35 mL/min. Column temperature was 45 °C. The injection volume was 2 μL.
The mass spectrometry conditions are as follows: Electrospray Ionization (ESI) temperature was 500 ℃, mass spectrometry voltage was 5500 V in positive ion mode and − 4500 V in negative ion mode. Ion sources gas 1, 45 psi; Gas 2, 55 psi; Curtain gas, 35 psi. In the triple quadrupole mass spectrometry, each ion pair was scanned according to the optimized Declustering Potential and Collision Energy. Multiple response monitoring (MRM) was used for qualitative and quantitative analysis of lipid spectrum.
Target acquisition
In order to discover the targets of BBR, we applied the TCMSP database (https://old.tcmsp-e.com/tcmsp.php), Swiss Target Prediction (http://www.swisstargetprediction.ch/), Pubchem Server (https://pubchem.ncbi.nlm.nih.gov/) and PharmMapper Server (http://www.lilab-ecust.cn/pharmmapper/). In addition, the related disease targets were searched and analyzed by inputting the keywords “Hyperlipidemia” into GeneCards Database (http://www.genecards.org/), DrugBank (https://go.drugbank.com/), OMIM Database (http://omim.org/) and DisGeNET database (https://www.disgenet.org/). Then, the false-positive and duplicate targets were deleted and integrated. Finally, the targets of BBR and the targets of HLP were intersected to obtain the potential targets of BBR treating HLP.
Network construction
The potential lipid biomarkers regulated by BBR were imported into Metscape to generate a metabolite-reaction-enzyme-gene network. The predicted targets of BBR and lipid targets were combined to import into STRING 11.5 database, the minimum interaction threshold was set as “Highest confidence > 0.9” to obtain the protein–protein interaction (PPI) network. Based on the PPI results, we focused on their linked targets to discover the underlying mechanisms. Thus, the network containing relationships among BBR, metabolites and related genes was established in Metscape. Through the analysis of this network, key targets in the interaction network were screened for analysis [16].
Further validation of the targets
Immunohistochemical methods were used to further validate the targets in the liver of each group of hamsters. After the liver tissue was deparaffinized, it was immersed in xylene I and xylene II for 5 min in sequence, hydrated in gradient alcohol for 10 min each, and antigen was recovered at a high temperature. Then, 3% H2O2 was added dropwise to incubate the specimen in a humidified chamber at room temperature for 30 min. The goat serum working solution was added for blocking dropwise and incubated in a humidified box at room temperature for 40 min. Add the primary antibodies CHPT1 (1:100, bioss), LCAT (1:200, servicebio), PLA2G4A (1:200, servicebio) and UGCG (1:100, ABclonal) respectively, and place them in a humid chamber at 4 ºC and incubate overnight. Add biotin working solution dropwise, and incubate in a humid chamber at room temperature for 35 min. Streptomycin working solution labeled with horseradish peroxidase was added and incubated for 35 min in a wet box at ambient temperature. After DAB color rendering, dehydration and transparency, the tissue sections were fixed with neutral gum and analyzed by light microscopy. The mean optical density was quantified by Image-Pro Plus 6.0 software.
Statistical methods
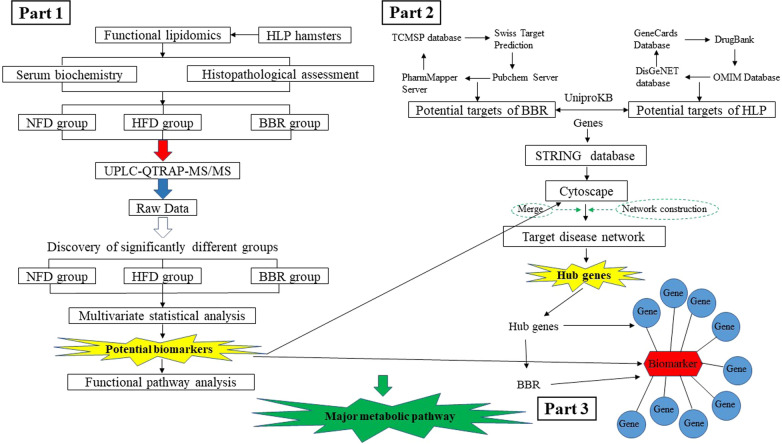
All data were expressed as mean ± standard deviation (X ± SD). GraphPad Prism 8.0 software was used for graphing and SPSS26.0 software was used for statistical analysis. Differences between groups were compared by one-way ANOVA, and the criterion of p < 0.05 was adopted for statistical significance. The screening criteria for significantly different lipid metabolites were fold change (FC ≥ 2, FC ≤ 0.5, VIP > 1 and p < 0.05). A flow chart of the scheme for this research is shown in Fig. 1.
Fig. 1.
Flowchart of the integrated strategy platform. Part 1: The mechanism of berberine (BBR) in the treatment of hyperlipidemia (HLP) was comprehensively described based on targeted lipidomics. Part 2: The network pharmacology approach was developed to identify targets of BBR for the treatment of HLP. Part 3: Potential links between biomarkers and hub genes
Results
Analysis of Biochemical indexes and body weight
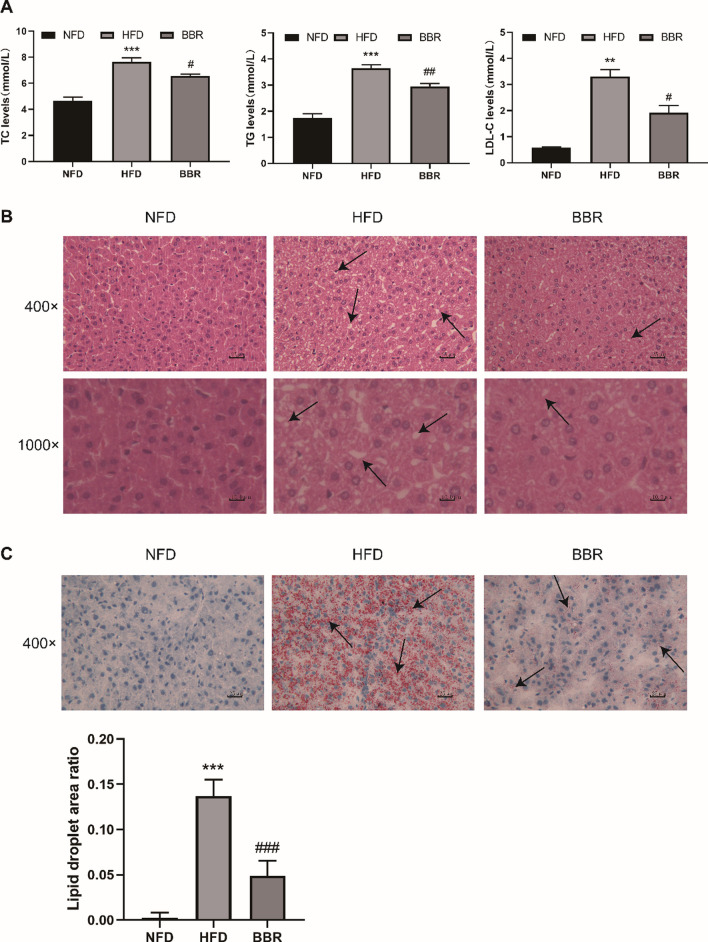
The main characteristic of HLP was abnormal levels of serum TC, TG, LDL-C. As shown in Fig. 2A. The hamsters of HFD group had sharply increased serum TC, TG and LDL-C levels compared with NFD group. However, there was a significant reduction of serum TC, TG and LDL-C levels compared to those in the HFD group after BBR administration. The changes in body weight by HFD and BBR treatment were shown in Fig. S1 (Additional file 1).
Fig. 2.
Effects of BBR on serum TC, TG and LDL-C concentrations (A). Compared with NFD group, *p < 0.05, **p < 0.01, ***p < 0.001; Compared with HFD group, #p < 0.05, ##p < 0.01). Data are presented as mean ± SD (n = 6). Liver H&E staining (magnification, 400 × and 1000 ×) (B). Liver Oil red O staining (magnification, 400 ×) and the quantification of lipid droplet area ratio assessed by Oil red O staining (C). Black arrows indicate the cytoplasmic vacuolation and the aggregation of red lipid droplets, respectively. Compared with NFD group, ***p < 0.001; Compared with HFD group, ###p < 0.001)
Hepatic histological analysis
The HE staining results of the hamster liver in each group are shown in Fig. 2B. The hamster hepatic cells in the NFD group have regular shapes, clear cell boundaries, and no fat droplets in the cytoplasm. Hepatocytes in the HFD group were swollen and inconsistent in size, and a large number of fat vacuoles were seen in the cytoplasm of different sizes, while fat vacuoles were reduced in the BBR group. For Oil Red O staining, the area ratio of lipid droplet in each visual field was determined by Image-Pro Plus 6.0 with red-dyed as positive staining for statistical analysis. As shown in Fig. 2C, the hamsters fed a HFD showed more extensive red-dyed lipid droplets with a higher percentage of lipid droplets. Interestingly, the proportion of lipid droplets was significantly decreased in the BBR group. These histological results implied that BBR could reduce lipid droplet accumulation in liver tissue, which alleviated the degree of hepatic steatosis.
Lipidomics analysis
Lipidomics data analysis
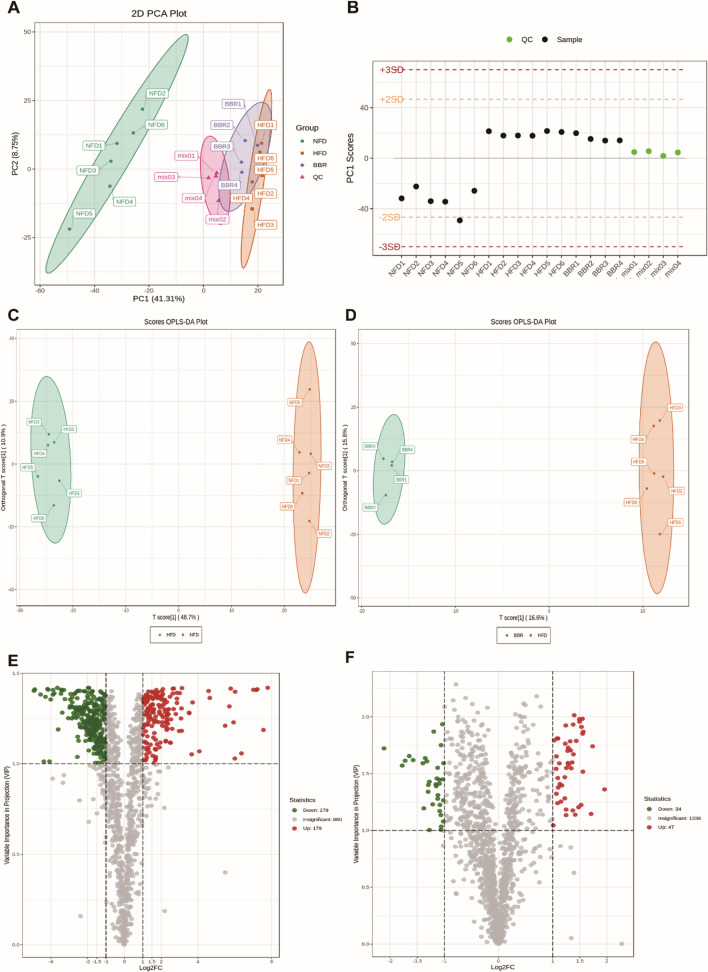
The unsupervised PCA model was used to observe the dispersion trend. Quality control (QC) samples are used to verify the repeatability and stability of the instrument. PCA scores (Fig. 3A) showed that QC samples had obvious clustering, indicating that the instrument was functioning well. PCA plots also showed an evident separation trend between NFD group and HFD group, and the BBR group was closer to NFD group. The results indicated that there was a significant difference between NFD group and HFD group in the level of lipid metabolites, and the level of lipid metabolites tended to the normal level after BBR administration, suggesting that BBR has the effect of reducing the abnormal lipid metabolites induced by HFD. Based on the ion peaks detected in each sample, the QC samples were monitored by the PCA model established above to determine whether the instrument state was stable. As shown in Fig. 3B, the PC1 of the quality control samples was within the normal range of plus or minus 3 standard deviations (SD). The OPLS-DA analysis was applied to determine the lipid profile changes in the HLP model. The validation parameters of two multivariate OPLS-DA models included fitness (R2X = 0.596 and R2Y = 0.998) and predictability (Q2 = 0.982) of NFD vs HFD (Fig. 3C), and fitness (R2X = 0.982) 0.416 and R2Y = 0.999) and predictability (Q2 = 0.548) of HFD vs BBR, which illustrated that the model had the good fitness and could be regarded as a predictable model (Fig. 3D). Volcano plot analysis was used to screen out the lipid biomarkers candidates based on the criteria of FC ≥ 2 or ≤ 0.5 and VIP ≥ 1, which showed that 458 significantly different lipid species were identified in NFD vs HFD (Fig. 3E) and 81 lipids were significantly changed in HFD vs BBR (Fig. 3F).
Fig. 3.
Lipidomics analysis of liver samples. Principal component analysis (PCA) score plots of hepatic lipid profiling among all groups (A). Score plots of PCA analysis of QC samples along PC1 axis (B). OPLS-DA scores plots C, D and volcano plot E, F analysis of NFD vs HFD and HFD vs BBR, respectively
Identification of the biomarkers
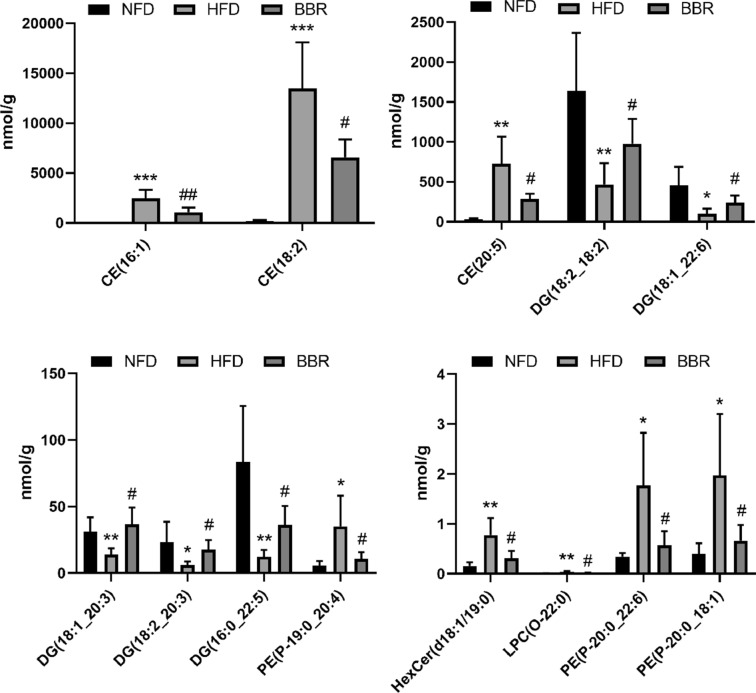
As shown in Fig. 4, we screened out the final potential lipid biomarkers among the three groups (p < 0.05). The contents of three CEs (CE(16:1), CE(18:2), CE(20:5)), HexCer (HexCer(d18:1/19:0)), LPC-O (LPC(O-22:0)) and three PE-Ps (PE(P-20:0_22:6), PE(P-20:0_18:1), PE(P-19:0_20:4)) in the HFD group were significantly enhanced compared to the NFD group, while BBR supplementation significantly decreased the content of these lipids (p < 0.05). While the five DGs (DG(18:2_18:2), DG(18:1_20:3), DG(18:2_20:3), DG(16:0_22:5), DG(18:1_22:6)) in the HFD group was significantly lower than that in the NFD group, while the content of them in the BBR group was significantly increased. Therefore, these results suggest that the 13 lipids, including 3 CE, 1 HexCer, 1 LPC-O, 3 PE-P, and 5 DG, might be the potential biomarkers for the lipid-lowering effect of BBR.
Fig. 4.
The potential lipid biomarkers responsible for anti-HLP effects of BBR. A total of 13 significantly differential lipid species were selected out by using the criteria of FC ≥ 2 or ≤ 0.5, VIP ≥ 1 and p < 0.05. CE cholesteryl esters, PE phosphatidylethanolamine, LPC lysophosphatidylcholine, HexCer Hexosylceramide. Compared with NFD group, *p < 0.05, **p < 0.01, ***p < 0.001; Compared with HFD group, #p < 0.05, ##p < 0.01). Data are presented as mean ± SD (n = 6)
Pathway analysis
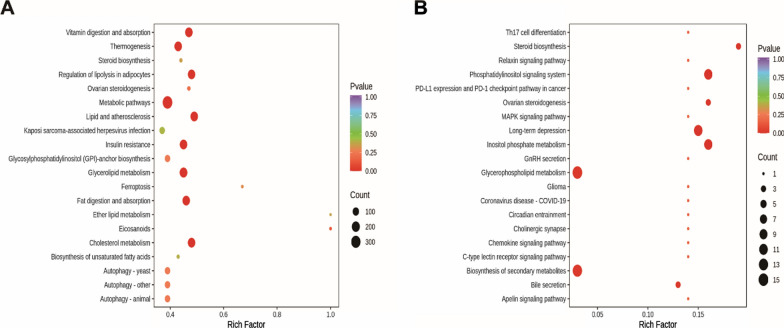
Pathway enrichment analysis can provide some indication of biochemical and signal transduction pathways in which differential lipids may be involved. As shown in Fig. 5A, B, the hamsters in HFD group were clearly damaged the pathways of thermogenesis, regulation of lipolysis in adipocytes, fat digestion and absorption, steroid biosynthesis and cholesterol metabolism compared with the NFD group, whereas BBR supplementation ameliorated the pathways of steroid biosynthesis, phosphatidylinositol signaling system, inositol phosphate metabolism and glycerophospholipid metabolism.
Fig. 5.
Lipid metabolic pathway analysis based on significantly differential lipid species in NFD versus HFD A and HFD versus BBR (B). Degree of enrichment was analyzed by a rich factor, P-value and the number of lipid metabolites that enriched in each pathway. The size of bubble means the amount of significantly differential lipid species which are enriched in this pathway, and the point with different gradation of color represents the scope of P-value. The higher value of rich factor stands for the higher degree of enrichment, and the lower P-value represents the more significant degree of enrichment
Network pharmacology
Targets prediction of BBR against HLP and lipid metabolite targets
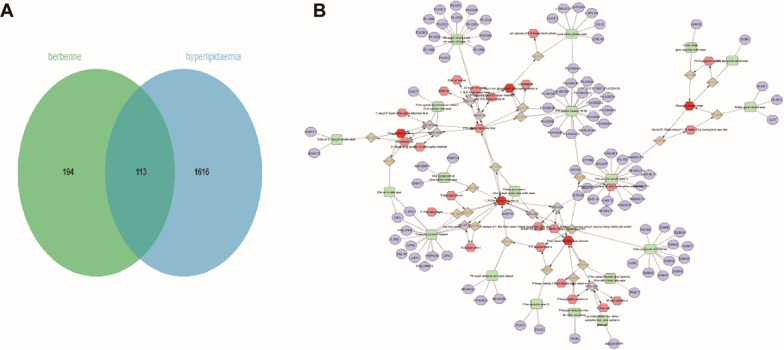
In the present work, a total of 307 targets of BBR were predicted based on the TCMSP database, Swiss Target Prediction, Pubchem Server and PharmMapper Server. The target genes related to HLP were searched in the GeneCards Database, DrugBank, OMIM Database and DisGeNET database, which were taken the intersection with the 1776 active targets. After the deletion and integration of false positive targets and repeat targets, 113 potential targets of BBR against HLP were obtained (Fig. 6A). In addition, the BBR-regulated lipid metabolites were introduced into Metscape to generate a metabolite-reaction-enzyme-gene network (Fig. 6B). Finally, 94 lipid biomarker targets were obtained (Table 2).
Fig. 6.
Screening of targets of BBR against HLP and lipid metabolite targets. Distribution of BBR and HLP target genes (A). BBR-regulated lipid metabolite-reaction-enzyme-gene network (B)
Table 2.
94 lipid biomarker target information
| ALG3 |
| PEMT |
| LYPLA1 |
| CEL |
| B3GNT2 |
| FUT9 |
| B4GALT7 |
| PLCD3 |
| LYPLA2 |
| CLC |
| PLA2G4E |
| DGKK |
| DGKA |
| DGKB |
| DGKG |
| DGKH |
| DGKQ |
| B3GNT6 |
| STT3B |
| PLCH1 |
| PLCL2 |
| PLCB1 |
| CLCF1 |
| LYPLA3 |
| PISD |
| PLA2G4F |
| PLA2G2D |
| GBA |
| GBGT1 |
| B4GALT1 |
| GLB1 |
| PLA2G4D |
| LGALS13 |
| PLA2G2E |
| MOGAT3 |
| STT3A |
| LCAT |
| LCT |
| LIPA |
| LIPB |
| LIPC |
| PLA2G3 |
| PLCE1 |
| GALNT7 |
| PLA2G1B |
| PLA2G2A |
| PLA2G4A |
| PLA2G5 |
| PLCB2 |
| PLCB3 |
| PLCB4 |
| PLCD1 |
| PLCG1 |
| PLCG2 |
| PLD1 |
| PLD2 |
| PNLIP |
| PNLIPRP1 |
| PNLIPRP2 |
| AGK |
| CHPT1 |
| AASDHPPT |
| PLA2G2F |
| SOAT1 |
| UGCG |
| ALG12 |
| GLB1L |
| PNPLA3 |
| PLA2G12A |
| PLA2G6 |
| PLA2G10 |
| SOAT2 |
| PLA2G12B |
| DGAT2 |
| PLCD4 |
| LIPF |
| DGKZ |
| DGKE |
| DGKD |
| ALG2 |
| PLA2G4C |
| PPAP2A |
| PPAP2C |
| PPAP2B |
| LOC100137047-PLA2G4B |
| DGAT1 |
| B4GALT4 |
| B4GALT3 |
| B4GALT2 |
| PLCZ1 |
| DGKI |
| B4GALT5 |
| LIPG |
| PLCH2 |
Network analysis
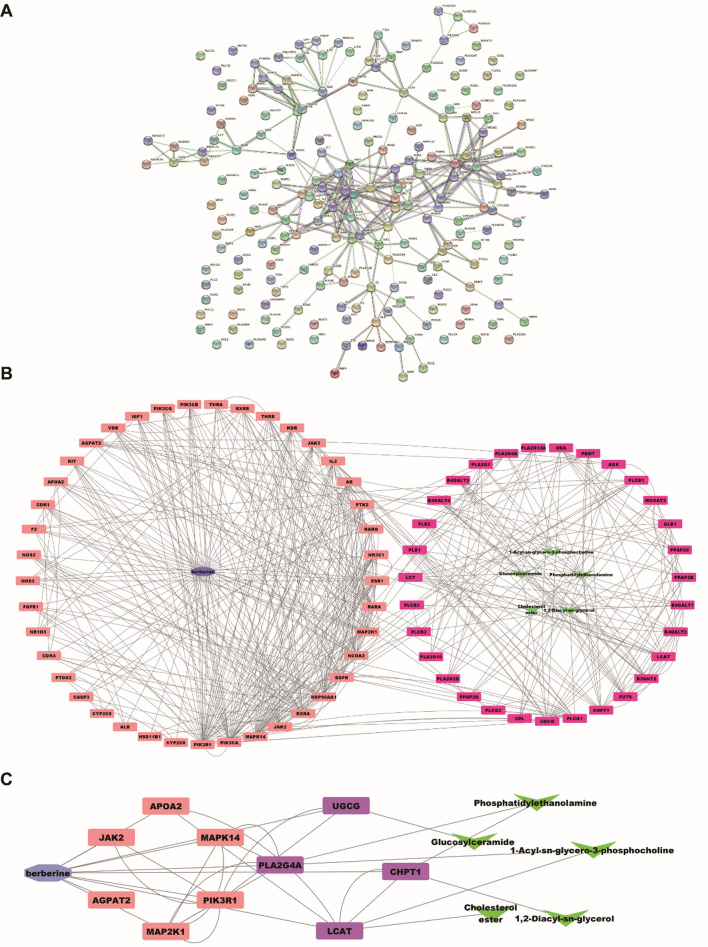
We linked the 94 lipid metabolite targets with 113 predicted targets of BBR against HLP using STRING 11.5 to build the PPI network (Fig. 7A). According to the results of the PPI network analysis, the connected targets was established to clarify the underlying mechanism of BBR treating HLP. The BBR-metabolite-target network was generated by Cytoscape 3.9.1. The two important parameters of betweenness and degree were used to evaluate the key lipid metabolites and the key targets regulated by BBR. As shown in Fig. 7B, we screened 37 targets belonging to BBR against HLP and 44 targets belonging to lipid metabolite targets based on the criterion that both degree and betweenness value were greater than the median. Based on the above screening, the targets with the top 10 of betweenness values were selected as the key targets (Fig. 7C). The main predicted targets of BBR were JAK2, AGPAT2, MAP2K1, PIK3R1, MAPK14 and APOA2, and the predicted targets linked lipids targets were UGCG, PLA2G4A, LCAT and CHPT1.
Fig. 7.
PPI network of BBR and lipid markers targets against HLP (A). The “BBR-target-metabolite” network (B). The “screened key BBR-predicted target-lipid target” network. (Blue: BBR, Orange: predicted-targets, Purple: lipid metabolite targets, Green: metabolites) (C)
Further validation of the targets
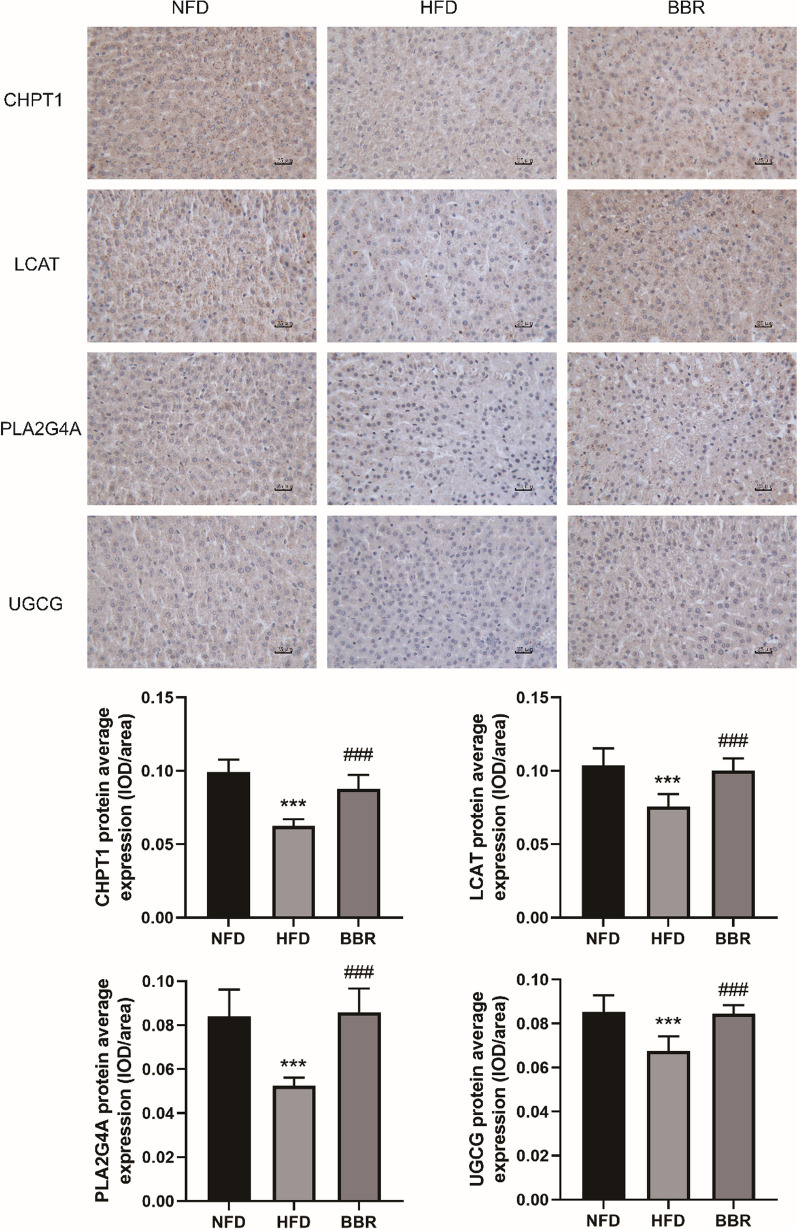
The further validation of the targets in liver tissues of different groups were identified by immunohistochemical staining. The mean optical density in each visual field was determined by Image-Pro Plus 6.0 with brown-yellow as positive staining for statistical analysis. As shown in Fig. 8, the mean optical density of CHPT1, LCAT, PLA2G4A and UGCG expression in HFD group was significantly lower than that in NFD group and the BBR group.
Fig. 8.
The effect of BBR on CHPT1, PLA2G4A, LCAT and UGCG protein of liver tissues in hyperlipidemic hamsters (Immunohistochemistry, 400 ×). Compared with NFD group, ***p < 0.001; Compared with HFD group, ###p < 0.001). Data are presented as mean ± SD (n = 6)
Discussion
Berberine has cholesterol lowering effects and aids in the prevention of metabolic diseases [17–19]. Since the anti-hyperlipidemia of BBR has been well studied in earlier work, which suggested that LDLR was identified as a target of BBR [4]. And the similar effect was observed in our study, we found that BBR significantly increased the levels of TC and TG in the serum of LDLR-deficient hyperlipidemic hamsters (Additional file 1: Fig. S2), while BBR could significantly reduce the levels of TC and TG in the wild-type hyperlipidemic hamsters (Fig. 2A). In this study, we developed a novel integrated strategy combining lipidomics with network pharmacology to explore new molecular targets of BBR in the treatment of HLP.
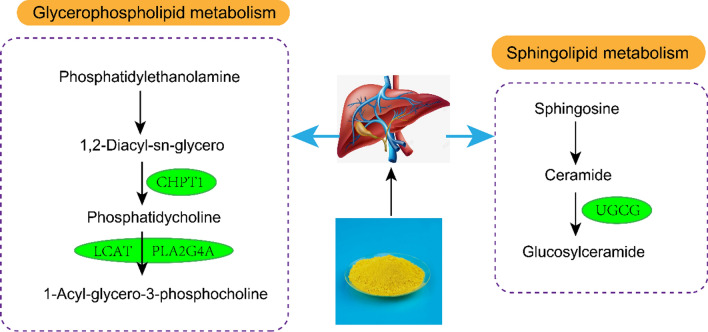
Lipidomics and network pharmacology results showed that the effect of BBR against HLP was involved with regulating glycerophospholipid, sphingolipid, steroid metabolism and 10 targets (JAK2, AGPAT2, MAP2K1, PIK3R1, MAPK14, APOA2, UGCG, PLA2G4A, LCAT, CHPT1). In summary, BBR improved HLP in model hamsters by targeting multiple targets through multiple metabolic pathways. The specific action mechanism of BBR on HLP treatment was shown in Fig. 9. We adopted immunohistochemical analysis to further verify that the BBR anti-HLP molecular targets of CHPT1, PLA2G4A, LCAT and UGCG, which have not been reported.
Fig. 9.
Hypothetical molecular mechanisms of BBR treating HLP
Glycerophospholipids, including phosphatidylcholines (PCs) and phosphatidylethanolamines (PEs), are ubiquitous and important biological components. Choline phosphotransferase 1 (CHPT1), an enzyme responsible for encoding the final enzyme of the PCs synthetic pathway, can catalyze PCs synthesis and regulates choline metabolism [20]. CHPT1 acts as a choline phosphotransferase in the final step of phosphatidylcholine synthesis, catalyzing the transfer of phosphocholine from CDP-choline to diacylglycerol, simultaneously releasing CMP and phosphatidylcholine. Lysophosphatidylcholine (LPC) is hydrolyzed by phospholipase A2 (PLA2) and a molecule of fatty acid is released from glycerophospholipids. As it contains a hydrophobic hydrocarbon chain and a polar phosphate group, which can destroy the cell membrane and rupture red blood cells, resulting in hemolysis. A study showed that PCs could contribute to proliferative growth and programmed cell death [21]. LPC was reported to be a pro-inflammatory lipid mediator that stimulated human monocytes to produce IL-1β and involved in the pro-inflammatory process of chronic diseases [22]. In this experiment, the concentration of LPC (O-22:0) in liver of hamsters in HFD group was higher than that in NFD group, suggesting that abnormal lipid metabolism was involved in the unbalance of anti-inflammatory system, which may be an important mechanism for the occurrence and development of HLP. Levels of LPC (O-22:0) was decreased after BBR treatment, which indicated that overactive LPC (O-22:0) might be inhibited by BBR.
LCAT (cholesterol ester acyltransferase) is the only key enzyme that catalyzes the esterification of plasma cholesterol. It is involved in the reverse transport process of cholesterol from plasma to liver, and its deficiency leads to abnormal lipid deposition, increased oxidative stress and atherosclerosis [23, 24]. In this study, it was observed that the levels of three kinds of CEs decreased after BBR treatment compared with HFD group, suggesting that BBR may play a lipid-lowering role through LCAT.
Udp-gluco ceramide glucosyltransferase (UGCG) is the first rate-limiting step in the glucoceramide biosynthetic pathway, promoting glucoceramide production and thereby increasing iNKT cell activity and cytokine production to reduce insulin resistance. Overproduction and/or accumulation of ceramide and ceramide metabolites, including glucosylceramides, can lead to insulin resistance [25]. The results of this experiment showed that HexCer(D18:1/19:0) content in BBR group was lower than that in HFD group. Therefore, BBR may reduce insulin resistance in HLP by balancing UGCG enzyme expression.
Conclusion
This study develops a novel integrated strategy combining lipidomics with network pharmacology to explore the therapeutic mechanism of BBR in the HLP model. Lipidomics results showed that 13 different lipids were regulated by BBR, including cholesterol esters, diglycerides, glycosphingolipids, lysophosphatidylcholine, and phosphatidylethanolamine. Pathway analysis suggested that the protective effect of BBR may be related to the regulation of steroid biosynthesis, phospatidylinositol signaling system, inositol phosphate metabolism and glycerophospholipid metabolism. The results of lipidomic and network pharmacology analysis showed that CHPT1, PLA2G4A, LCAT and UGCG were expected as the lipid-linked targets of BBR against HLP, which were further verified by immunohistochemical analysis. Taken altogether, this study preliminarily elucidated the pharmacological mechanism of BBR on HLP through lipidomics and network pharmacology, which contributes to the further efficiency evaluation of BBR.
Supplementary Information
Additional file 1: Fig. S1. The changes in body weight by HFD and BBR treatment. Compared with NFD group, *p<0.05, **p<0.01, ***p<0.001; Compared with HFD group, #p<0.05, ##p<0.01). Data are presented as mean ± SD (n=6). Fig. S2. The levels of TC and TG in the serum of LDLR-deficient hyperlipidemic hamsters by HFD and BBR treatment. Compared with L-NFD group, *p<0.05, **p<0.01; Compared with L-HFD group, #p<0.05).
Acknowledgements
Thanks to the Postdoctoral Research Station of Biology and the School of Pharmacy of Hebei Medical University for the instrument support. Thanks to Hebei Invivo Biotech Co. Ltd for the support of the experimental animals.
Abbreviations
- BBR
Berberine (BBR)
- HLP
Hyperlipidemia
- TC
Total cholesterol
- TG
Triglyceride
- LDL-C
Low-density lipoprotein-cholesterol
- CE
Cholesteryl esters
- PE
Phosphatidylethanolamine
- LPC
Lysophosphatidylcholine
- HexCer
Hexosylceramide
Author contributions
Conceptualization, YC, DZ and MG.; methodology, YC, KL and HZ; validation, YY; formal analysis, ZH; investigation, HZ; data curation, KL and HZ; writing—original draft preparation, YC; writing—review and editing, DZ and MG; supervision, DZ; funding acquisition, YC and DZ. All authors read and approved the final manuscript.
Funding
This work was funded by the Postdoctoral Foundation of Hebei Medical University, the Chunyu Project Initial Funding of Hebei Medical University (CYQD2021012), the High-level Talents Funding Project of Hebei Province, China (B2021003042), the Traditional Chinese Medicine Administration Project of Hebei Province, China (2022133) and the Natural Science Foundation of Hebei Province (H2022206150).
Availability of data materials
All the data generated and analyzed during this study are included in the manuscript.
Declarations
Competing interests
All the authors have declared no conflict of interest.
Footnotes
Publisher's Note
Springer Nature remains neutral with regard to jurisdictional claims in published maps and institutional affiliations.
Contributor Information
Mingming Gao, Email: g.m0515@163.com.
Ding Zhao, Email: zhaodingd@163.com.
References
- 1.Guo WL, Pan YY, Li L, Li TT, Liu B, Lv XC. Ethanol extract of Ganoderma lucidum ameliorates lipid metabolic disorders and modulates the gut microbiota composition in high-fat diet fed rats. Food Funct. 2018;9(6):3419–3431. doi: 10.1039/C8FO00836A. [DOI] [PubMed] [Google Scholar]
- 2.Egan BM, Li J, White K, Fleming DO, Connell K, Hernandez GT, et al. ACC/AHA cholesterol guideline and implications for healthy people 2020 cardiovascular disease prevention goals. J Am Heart Assoc. 2013 doi: 10.1161/JAHA.116.003558. [DOI] [PMC free article] [PubMed] [Google Scholar]
- 3.Pandozzi C, Giannetta E, Tarsitano MG. Phytotherapic approach in menopause: light and darkness. Minerva Endocrinol (Torino). 2022 doi: 10.23736/S2724-6507.22.03712-5. [DOI] [PubMed] [Google Scholar]
- 4.Kong W, Wei J, Abidi P, Lin M, Inaba S, Li C, et al. Berberine is a novel cholesterol-lowering drug working through a unique mechanism distinct from statins. Nat Med. 2004;10(12):1344–1351. doi: 10.1038/nm1135. [DOI] [PubMed] [Google Scholar]
- 5.Li H, Dong B, Park SW, Lee HS, Chen W, Liu J. Hepatocyte nuclear factor 1alpha plays a critical role in PCSK9 gene transcription and regulation by the natural hypocholesterolemic compound berberine. J Biol Chem. 2009;284(42):28885–28895. doi: 10.1074/jbc.M109.052407. [DOI] [PMC free article] [PubMed] [Google Scholar]
- 6.Li A, Lin C, Xie F, Jin M, Lin F. Berberine ameliorates insulin resistance by inhibiting IKK/NF-kappaB, JNK, and IRS-1/AKT signaling pathway in liver of gestational diabetes mellitus rats. Metab Syndr Relat Disord. 2022 doi: 10.1089/met.2022.0017. [DOI] [PubMed] [Google Scholar]
- 7.Jiang D, Wang D, Zhuang X, Wang Z, Ni Y, Chen S, et al. Berberine increases adipose triglyceride lipase in 3T3-L1 adipocytes through the AMPK pathway. Lipids Health Dis. 2016;15(1):214. doi: 10.1186/s12944-016-0383-4. [DOI] [PMC free article] [PubMed] [Google Scholar]
- 8.Chang X, Wang Z, Zhang J, Yan H, Bian H, Xia M, et al. Lipid profiling of the therapeutic effects of berberine in patients with nonalcoholic fatty liver disease. J Transl Med. 2016 doi: 10.1186/s12967-016-0982-x. [DOI] [PMC free article] [PubMed] [Google Scholar]
- 9.Rohrig F, Schulze A. The multifaceted roles of fatty acid synthesis in cancer. Nat Rev Cancer. 2016;16(11):732–749. doi: 10.1038/nrc.2016.89. [DOI] [PubMed] [Google Scholar]
- 10.Lin HV, Tsou YC, Chen YT, Lu WJ, Hwang PA. Effects of low-molecular-weight fucoidan and high stability fucoxanthin on glucose homeostasis, lipid metabolism, and liver function in a mouse model of type II diabetes. Mar Drugs. 2017 doi: 10.3390/md15040113. [DOI] [PMC free article] [PubMed] [Google Scholar]
- 11.Yang K, Han X. Lipidomics: techniques, applications, and outcomes related to biomedical sciences. Trends Biochem Sci. 2016;41(11):954–969. doi: 10.1016/j.tibs.2016.08.010. [DOI] [PMC free article] [PubMed] [Google Scholar]
- 12.Zhang W, Chen Y, Jiang H, Yang J, Wang Q, Du Y, et al. Integrated strategy for accurately screening biomarkers based on metabolomics coupled with network pharmacology. Talanta. 2020 doi: 10.1016/j.talanta.2020.120710. [DOI] [PubMed] [Google Scholar]
- 13.Di S, Han L, An X, Kong R, Gao Z, Yang Y, et al. In silico network pharmacology and in vivo analysis of berberine-related mechanisms against type 2 diabetes mellitus and its complications. J Ethnopharmacol. 2021 doi: 10.1016/j.jep.2021.114180. [DOI] [PubMed] [Google Scholar]
- 14.Zhao L, Liu S, Wang M, Zhi M, Geng X, Hou C, et al. Berberine restored nitrergic and adrenergic function in mesenteric and iliac arteries from streptozotocin-induced diabetic rats. J Ethnopharmacol. 2019 doi: 10.1016/j.jep.2019.112140. [DOI] [PubMed] [Google Scholar]
- 15.Chen Y, Feng X, Li L, Song K, Zhang L. Preparation and antitumor evaluation of hinokiflavone hybrid micelles with mitochondria targeted for lung adenocarcinoma treatment. Drug Deliv. 2020;27(1):565–574. doi: 10.1080/10717544.2020.1748760. [DOI] [PMC free article] [PubMed] [Google Scholar]
- 16.Li AP, Yang L, Cui T, Zhang LC, Liu YT, Yan Y, et al. Uncovering the mechanism of Astragali Radix against nephrotic syndrome by intergrating lipidomics and network pharmacology. Phytomedicine. 2020 doi: 10.1016/j.phymed.2020.153274. [DOI] [PubMed] [Google Scholar]
- 17.Lee YS, Kim WS, Kim KH, Yoon MJ, Cho HJ, Shen Y, et al. Berberine, a natural plant product, activates AMP-activated protein kinase with beneficial metabolic effects in diabetic and insulin-resistant states. Diabetes. 2006;55(8):2256–2264. doi: 10.2337/db06-0006. [DOI] [PubMed] [Google Scholar]
- 18.Guo T, Woo SL, Guo X, Li H, Zheng J, Botchlett R, et al. Berberine ameliorates hepatic steatosis and suppresses liver and adipose tissue inflammation in mice with diet-induced obesity. Sci Rep. 2016 doi: 10.1038/srep22612. [DOI] [PMC free article] [PubMed] [Google Scholar]
- 19.Wang Q, Zhang M, Liang B, Shirwany N, Zhu Y, Zou MH. Activation of AMP-activated protein kinase is required for berberine-induced reduction of atherosclerosis in mice: the role of uncoupling protein 2. PLoS ONE. 2011;6(9):e25436. doi: 10.1371/journal.pone.0025436. [DOI] [PMC free article] [PubMed] [Google Scholar]
- 20.Wen S, He Y, Wang L, Zhang J, Quan C, Niu Y, et al. Aberrant activation of super enhancer and choline metabolism drive antiandrogen therapy resistance in prostate cancer. Oncogene. 2020;39(42):6556–6571. doi: 10.1038/s41388-020-01456-z. [DOI] [PubMed] [Google Scholar]
- 21.Ridgway ND. The role of phosphatidylcholine and choline metabolites to cell proliferation and survival. Crit Rev Biochem Mol Biol. 2013;48(1):20–38. doi: 10.3109/10409238.2012.735643. [DOI] [PubMed] [Google Scholar]
- 22.Liu-Wu Y, Hurt-Camejo E, Wiklund O. Lysophosphatidylcholine induces the production of IL-1b by human monocytes. Atherosclerosis. 1998 doi: 10.1016/S0021-9150(97)00295-5. [DOI] [PubMed] [Google Scholar]
- 23.Takahashi S, Hiromura K, Tsukida M, Ohishi Y, Hamatani H, Sakurai N, et al. Nephrotic syndrome caused by immune-mediated acquired LCAT deficiency. J Am Soc Nephrol. 2013;24(8):1305–1312. doi: 10.1681/ASN.2012090913. [DOI] [PMC free article] [PubMed] [Google Scholar]
- 24.Guo M, Liu Z, Xu Y, Ma P, Huang W, Gao M, et al. Spontaneous atherosclerosis in aged LCAT-deficient hamsters with enhanced oxidative stress-brief report. Arterioscler Thromb Vasc Biol. 2020;40(12):2829–2836. doi: 10.1161/ATVBAHA.120.315265. [DOI] [PubMed] [Google Scholar]
- 25.Rakhshandehroo M, van Eijkeren RJ, Gabriel TL, de Haar C, Gijzel SMW, Hamers N, et al. Adipocytes harbor a glucosylceramide biosynthesis pathway involved in iNKT cell activation. Biochim Biophys Acta Mol Cell Biol Lipids. 2019;1864(8):1157–1167. doi: 10.1016/j.bbalip.2019.04.016. [DOI] [PubMed] [Google Scholar]
Associated Data
This section collects any data citations, data availability statements, or supplementary materials included in this article.
Supplementary Materials
Additional file 1: Fig. S1. The changes in body weight by HFD and BBR treatment. Compared with NFD group, *p<0.05, **p<0.01, ***p<0.001; Compared with HFD group, #p<0.05, ##p<0.01). Data are presented as mean ± SD (n=6). Fig. S2. The levels of TC and TG in the serum of LDLR-deficient hyperlipidemic hamsters by HFD and BBR treatment. Compared with L-NFD group, *p<0.05, **p<0.01; Compared with L-HFD group, #p<0.05).
Data Availability Statement
All the data generated and analyzed during this study are included in the manuscript.


