

Abstract
Plants produce a wide variety of secondary metabolites, but intraspecific variation in space and time can alter the ecological interactions these compounds mediate. The aim of this work was to document the spatial and temporal chemical biogeography of Monarda fistulosa. I collected leaves from 1587 M. fistulosa individuals from 86 populations from Colorado to Manitoba, extracted and analyzed their terpenes with gas chromatography, mapped monoterpene chemotypes, and analyzed chemical variation with principal component analysis. I also measured the amounts of terpenes in different plant tissues to examine intraplant variation and monitored leaf terpene chemistry over a single growing season to examine temporal patterns. Finally, I extracted terpenes from herbarium samples up to 125 years old and compared the chemotypes with recent samples from the same sites. M. fistulosa populations consisted mostly of thymol (T) and carvacrol (C) chemotypes, but geraniol (G) and (R)‐(−)‐linalool (L), a chemotype new to this species, were also present. A principal component analysis showed that most of the chemical variation across populations was due to the amounts of the dominant terpene in plants. Intraplant tissue chemistry revealed that leaves mostly had the greatest amounts of terpenes, followed by floral structures, stems, and roots. Short‐term temporal variation in leaf chemistry of T and C plants over a growing season showed that plants produced the highest levels of biosynthetic precursors early in the season and their dominant monoterpenes peaked in mid‐summer. Plant chemotype was discernable in the oldest herbarium samples, and 15 of 18 historic samples matched the majority chemotype currently at the site, indicating that population chemotype ratios may remain stable over longer time scales. Overall, the results show that plant species' secondary chemistry can vary both spatially and temporally, which may alter the biological interactions that these compounds mediate over space and time.
Keywords: carvacrol, chemical biogeography, essential oils, geraniol, linalool, Monarda fistulosa, terpenoids, thymol
Plants produce a wide variety of secondary metabolites, but intraspecific variation in space and time could alter the interactions these compounds mediate. The aim of this work was to document the spatial and temporal chemical biogeography of Monarda fistulosa. Overall, the results show that plant species’ secondary chemistry can vary both spatially and temporally, which may alter the biological interactions that these compounds mediate over space and time.
1. INTRODUCTION
Plants are heterogeneous resources for the organisms with which they interact and one major source of plant heterogeneity is variation in the amounts and composition of the secondary metabolites that they produce. As the name implies, secondary metabolites are not part of primary plant metabolism (e.g., sugars, proteins, nucleic acids) but are specialized compounds (e.g., alkaloids, terpenoids), often with high taxonomic affinity. Variation in plant secondary chemistry can occur at many scales, both spatially and temporally. Spatial variation in secondary metabolites can occur at the scale of a single individual with differences among different plant tissues (Bowers & Stamp, 1992), among individuals within populations (Keefover‐Ring et al., 2009), and among different populations, up to regional and large geographic scales (Keefover‐Ring et al., 2014; Pratt et al., 2014). Temporal variation can happen over rapid time scales, such as induction (Karban & Baldwin, 1997; Keefover‐Ring et al., 2016), with plant ontogeny (Barton & Koricheva, 2010), or over longer evolutionary time scales, as the selective forces acting on plant populations change over time (Thompson et al., 2013).
From an ecological point of view, understanding the spatial and temporal variation of the secondary chemistry of a species is important since these compounds are involved in many biological interactions between the plants that make them and other species. The interactions that these chemicals mediate can be either mutually beneficial, such as the attraction of pollinators, or antagonistic, such as the deterrence of herbivores and allelopathy (Gershenzon & Dudareva, 2007; Langenheim, 1994). Furthermore, these interactions often operate bi‐directionally, such that the organisms surrounding a plant can also affect the chemistry of the plant population (Linhart, 1991). In addition to biotic forces, a plant's secondary chemical composition can also be shaped by abiotic forces, such as nutrients (Loney et al., 2006), moisture availability (Johnson et al., 1997), or temperature (Pratt et al., 2014; Thompson et al., 2007), and these forces can vary over the landscape and with time, resulting in different secondary chemistry‐driven ecological and evolutionary outcomes (Thompson, 2005). However, large‐scale studies to determine the phytochemical landscape (Hunter, 2016) of a species can be time‐consuming and costly and have only been done for a limited number of species (e.g., Bohm, 2009; Gouyon et al., 1986; Keefover‐Ring et al., 2014).
The focus of this work is to document the spatial and temporal chemical biogeography of one plant species, Monarda fistulosa L. var. menthifolia, in at least part of its extensive range. Like many species in the Lamiaceae, M. fistulosa synthesizes essential oils (a mixture of mono‐ and sesquiterpenes) in mostly peltate granular trichomes on the surfaces of flower petals, calyces, bracts, leaves, and even stems (Heinrich, 1973; Pfab et al., 1980). The pattern of essential oil production in M. fistulosa is a chemical polymorphism where individuals are identified with distinct chemical phenotypes, or chemotypes, where a single monoterpene dominates (Keefover‐Ring et al., 2009), which is consistent with other labiate species (Fleisher & Sneer, 1982; Vernet et al., 1986). Except for the work of Marshall and Scora (1972) and Keefover‐Ring (2015), however, all other studies documenting M. fistulosa chemistry analyzed relatively few individuals.
The largest spatial scale in this study includes mapping the chemotypes of M. fistulosa populations from southern Colorado and extending north to sites in Wyoming, the Dakotas, and Manitoba, which included collecting and analyzing 1587 individuals from 86 separate populations. On a much smaller spatial scale, the amounts of terpenes in different plant tissues were measured to examine intraplant variation. One temporal component of the work dealt with measuring phenological changes in leaf terpene chemistry of M. fistulosa plants of the two dominant chemotypes over a single growing season and into senescence. A longer‐term perspective was taken to see whether the chemotypes of particular populations have changed over time by comparing chemical analyses from recent sample collections to the terpenes extracted from herbarium samples collected up to 125 years ago from the same sites.
The specific questions addressed in this study were: (1) What is the chemotype distribution of M. fistulosa populations in at least part of its extensive range? (2) What is the composition and abundance of terpenes in different M. fistulosa tissues? (3) How do terpenes vary over the growing season? and (4) Is plant chemotype detectable from historic herbarium specimens and do they match the dominant contemporary chemotype in the same populations?
2. MATERIALS AND METHODS
2.1. Study organism
Monarda fistulosa var. menthifolia (Graham) Fernald (Lamiaceae; hereafter Monarda fistulosa), a member of the subgenus Monarda (Prather et al., 2002), commonly known as wild bergamot, bee balm, or horse mint, is a perennial mint that occurs in all of the continental United States, except for Alaska, California, Florida, and all of the southern Canadian provinces, as far east as Quebec, and in the Northwest Territory (Straley, 1986; USDA, 2008).
M. fistulosa hosts a variety of herbivores, including a seed‐eating pyralid (Davis et al., 1988) that substantially reduces seed set, the specialist aphid Aphis monardae (Wyckhuys et al., 2007), and the monophagous one‐spotted tortoise beetle Physonota unipunctata (Criddle, 1926; Hamilton, 1884; Sanderson, 1948). The larvae of these tortoise beetles protect themselves by concentrating plant terpenes in “fecal shields” (Keefover‐Ring, 2013) and while they drastically reduced plant fitness of both of the chemotypes tested, larval performance differed between chemotypes (Keefover‐Ring, 2015).
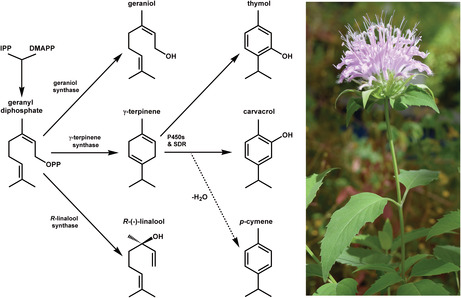
Previous research identified three chemotypes of M. fistulosa, defined by the presence of a predominant amount of one of three different monoterpenes: thymol (T; scent of thyme), carvacrol (C; scent of oregano), or geraniol (G; lemon‐like scent; Johnson et al., 1998; Keefover‐Ring, 2013, 2015; Marshall & Scora, 1972; Scora, 1967; Weaver et al., 1995; Figure 1). Unlike many other monoterpenes that are aliphatic in character, thymol and carvacrol are based on a phenolic structure and are only produced by a few other labiate species, including species in the genera of Thymus and Oregano (Chizzola, 2003; Fleisher & Sneer, 1982; Skoula & Grayer, 2005; Stahl‐Biskup & Saez, 2002), and other species in the genus Monarda (Burt, 1936; Scora, 1967). Plants that produce thymol and carvacrol almost always also have relatively high amounts of the aliphatic monoterpenes γ‐terpinene and p‐cymene. γ‐Terpinene serves as the biosynthetic precursor for thymol and carvacrol and p‐cymene results from dehydration of a dienol intermediate that leads to carvacrol (Krause et al., 2021; Figure 1).
FIGURE 1.

Biosynthesis of the major monoterpenes found in the essential oil of Monarda fistulosa in this study. The precursor's isopentenyl pyrophosphate (IPP) and dimethylallyl pyrophosphate (DMAPP) lead to geranyl diphosphate (GPP), which is then converted to geraniol, γ‐terpinene, or (R)‐(−)‐linalool. Various cytochrome P450s and a short‐chain dehydrogenase (SDR) convert γ‐terpinene to thymol and carvacrol (Krause et al., 2021). p‐Cymene results from the dehydration of a carvacrol intermediate (Krause et al., 2021). Photo: Ken Keefover‐Ring.
2.2. Chemical biogeography of M. fistulosa
2.2.1. Sample collection and preparation
To investigate geographic variation in M. fistulosa essential oil chemistry, I collected single leaves from 1587 individual plants at 86 different populations for terpenoid analysis from 2002 to 2007 (Table A1). The majority of the populations sampled were located in Colorado (66 sites) and specifically in Boulder County (41 sites). There were also 14 sites in southern Manitoba, Canada, three in North Dakota, two in South Dakota, and one in Wyoming. The number of individuals per site ranged from one to 122 with a mean of 18 (SD = 14.2). Sites were chosen using collection records from the University of Colorado Museum Herbarium (COLO) and by observing populations, usually in flowers, when driving or hiking. At each site, plants were haphazardly chosen with enough distance between them to ensure that the stems sampled were from different individuals. Typically, the first leaf immediately below the bracts was detached next to the stem, rolled to fit into a 2 ml microcentrifuge tube, and completely submerged with either 1.00 or 1.50 ml of ethanol, containing m‐xylene as an internal standard (0.1 μl/ml). Usually, the entire procedure was carried out in the field within a few hours of collection, or when not possible within 24 h of collection, during which time leaf samples were stored in either a small cooler with ice or a refrigerator. Upon return to the lab, samples were placed in a sonication bath for 15 min and then allowed to extract for 7 days at room temperature. After the 7‐day soaking period, 100 μl of the solution from each sample was combined with 100 μl of internal standard solution and injected into a gas chromatograph (GC). Leaves were later removed from the solvent, dried to a constant weight at 70°C, and weighed to the nearest mg.
2.2.2. Chemical analysis
I measured the concentrations of 14 different compounds known to be the major components of M. fistulosa essential oil (Keefover‐Ring, 2013, 2015; Marshall & Scora, 1972; Scora, 1967; Weaver et al., 1995). The monoterpenes assayed included myrcene, limonene, γ‐terpinene, p‐cymene, cis‐sabinene hydrate, linalool, carvacrol methyl ether, nerol, geranyl acetate, geraniol, thymol, and carvacrol. The levels of a single sesquiterpene, germacrene D, and the alcohol octen‐3‐ol were also measured. All plant sample compound identification and quantification were carried out with GC with the methods used in Keefover‐Ring et al. (2009), and final amounts were reported in mg compound per gram of plant tissue dry weight (mg/g DW). I performed additional analyses to determine the ratio of the two enantiomers of linalool, a chiral compound, using methods from Keefover‐Ring et al. (2016). I also converted the concentration data of all compounds in the samples to percentages and assigned each plant a chemotype based on the compound with the largest percentage of the total (Keefover‐Ring et al., 2009).
2.2.3. Statistical analysis
All statistical analyses in this study were carried out using SAS version 9.4 (SAS Institute Inc, 2013). In addition to mapping the spatial patterns of the essential oil chemotypes using ArcMap (Esri), I further characterized M. fistulosa chemistry over the landscape with a principal components analysis (PCA; PROC PRINCOMP in SAS) using the concentrations (mg/g DW) of all 14 measured compounds as the dependent variables. The PCA included chemical analysis results for 1007 plants [T (N = 419), C (N = 568), G (N = 17), and L (N = 3)] from 54 sites. Plant chemotype was determined for all 1587 samples in the chemotype mapping part of the study using dominant compound peak areas, however, the leaf dry weights needed to calculate compound concentrations were only available for 1007 samples. Thirty‐nine of these sites were from Colorado (including the L chemotype site), 14 from Manitoba (including all sites containing G chemotype plants), three from North Dakota, two from South Dakota, and one from Wyoming.
2.3. Intraplant chemical variation
2.3.1. Sample collection and preparation
To assess the essential oil chemistry of various tissues (intraplant) of M. fistulosa, single stems from 13 separate C chemotype plants, including some roots, were collected from the Crescent Meadows (Table A1) population in Colorado on July 18, 2003. The stems were dissected and various parts were soaked separately in 1.00 ml internal standard solution in 2 ml microcentrifuge tubes. Separate parts included flowers (including petals and all sexual parts), calyces, the bracts that subtend the inflorescence, leaves from the first, second, and third positions below the bracts, stems, and roots. This process was repeated on July 28, 2004, with single stems from five separate geraniol chemotype plants from Spruce Woods Provincial Park in Manitoba. This time the parts used included only flowers, calyces, bracts, only the second leaf below the bract, and stems. All intraplant samples were analyzed by GC, as above.
2.3.2. Statistical analysis
The proc GLM function was used to test for differences in γ‐terpinene, p‐cymene, thymol, carvacrol, and total terpenes between the various parts of the 13 C chemotype plants. Compounds with significant ANOVAs were then subjected to pair‐wise comparisons with a Ryan‐Einot‐Gabriel‐Welsch multiple range test. Since carvacrol methyl ether is usually either present or absent in individuals, only the three plants in which it occurred were used in the statistical analysis of this compound. The same statistical procedure was used to look for chemical differences among parts of the five G chemotype plants. In this case, only the main monoterpene geraniol and total terpenes were examined. To meet ANOVA assumptions of normality individual terpene data were square root transformed.
2.4. Seasonal ontogeny of monoterpenes
2.4.1. Sample collection and preparation
To determine the changes in levels of terpenes that occur over an entire season, 14 T and 16 C chemotype plants were identified from a separate experiment located on Flagstaff Mountain in the foothills ~2 km west of Boulder, CO (Keefover‐Ring, 2015). During the 2007 growing season, leaf collections were made from all 30 individuals on five separate occasions. On April 19, when most plants had only vegetative shoots protruding about 5 cm from ground level, one or more terminal leaves were collected from a single stem of each plant. Subsequent samples consisted of the first leaf below the reproductive parts and were collected on June 1 when most plants had small terminal flower buds, on July 19 when most were in full flower, and on September 28 when plants had no flowers but still mostly green foliage. The final collection was on December 3. At this time plants still had many of their leaves, but almost all foliage had become dry and brown. All samples were soaked in 1.00 ml internal standard solution and analyzed by GC, as above.
2.4.2. Statistical analysis
I performed individual repeated measures analyses for γ‐terpinene, p‐cymene, thymol, carvacrol, and total terpenes separately for the two different chemotypes for the five different time periods using PROC MIXED. Compounds that were significant for the repeated factor of time were then subjected to pair‐wise comparisons with a Ryan‐Einot‐Gabriel‐Welsch multiple range test. To meet ANOVA assumptions of normality individual terpene data were transformed as above.
2.5. Historic samples
2.5.1. Sample collection and preparation
To evaluate whether the chemotypes of historic herbarium samples of M. fistulosa could be determined for comparison to present populations, I analyzed 44 separate accessions of M. fistulosa from the University of Colorado Museum Herbarium (COLO; Table A2) by GC‐mass spectrometry (MS). Original collection dates ranged from 1872 to 2001, with at least one sample from every decade during that time, except for 1890. The accuracy of location information varied among the accessions, with generally more specific location placement for the more recent samples. However, even some of the earliest sites sampled were well‐described.
Samples for chemical analysis consisted of approximately one‐half of a leaf (usually the first leaf below the bracts) cut from each pressed specimen and placed in separate small manila envelopes. Eight to twelve milligrams of the dried leaf material was weighed to 0.1 mg, placed in small glass vials with PTFE‐lined screw tops, and 0.50 ml of an internal standard solution (m‐xylene in n‐hexane, GC2 hexane, Burdick and Jackson) was added and samples sonicated for 15 min. Samples were allowed to soak for 7 days before analysis.
Twenty of the historic sites were also locations where contemporary plants were collected for the chemical biogeography work described above (Table A2). Many of the remaining historic sites were revisited, but either the exact location of the population could not be found or no current M. fistulosa population still existed.
2.5.2. Chemical analysis
Historic samples were analyzed with an Agilent 6890 N GC/Agilent 5975 MS with an HP‐1MS column (30 m × 0.25 mm I.D., film thickness 0.25 μm, Agilent Technologies, Inc.). One microlitre of each sample was injected in the splitless mode with oven conditions that included an isothermal hold at 60°C for 5 min, followed by a ramp of 10°C/min to 250°C. Linear retention indices were also calculated on the HP‐1 column with the same oven conditions used when determining them on the DB‐Wax column.
2.5.3. Statistical analysis
I used a χ2 statistic to test whether the observed chemotypes from herbarium samples differed from the chemotypes expected based on the majority of chemotype detected at the sites from the recent sampling. Also, while many of the historical samples contained very small amounts of several different terpenes, only p‐cymene, thymoquinone, carvacrol methyl ether, thymol, and carvacrol were present in relatively large amounts in most of the samples and were the only plant terpenes used for statistical analyses. Using the PROC REG function, the concentration data for p‐cymene, thymoquinone, carvacrol methyl ether, a total of the two phenolic monoterpenes (thymol and carvacrol), and a total of all five were regressed on the sample collection date.
3. RESULTS
3.1. Chemical biogeography of M. fistulosa
Four different chemotypes of M. fistulosa were found as a result of sampling 1587 individual plants for this study, with either geraniol (G), linalool (L), thymol (T), or carvacrol (C) as an individual plant's dominant monoterpene (Figure 2 ). Plants of the T (N = 774 plants) and C (N = 793) chemotypes were the most common and either one or both were found at all of the 86 sites examined. The two other chemotypes, G (N = 17) and L (N = 3), comprised only a small percentage of the total. Thirty‐eight sites were monomorphic for a single chemotype with 17 containing only C plants and 21 only T. Only two sites had more than two chemotypes present, including one site in southern Colorado (Highway 12), which had T, C, and L plants and a single site in southern Manitoba, which had T and C chemotypes together with G plants.
FIGURE 2.

Chemotype mapping of Monarda fistulosa populations in southern Manitoba, Wyoming, North and South Dakota, Colorado (excluding Boulder County), and Boulder County, CO. yellow = thymol (T), red = carvacrol (C), blue = geraniol (G; southern Manitoba), and black = (R)‐(−)‐linalool (L; Colorado site farthest south) chemotype plants. The bottom right of each bar is the actual site location. When present, leader lines point to site location. Map of North America shows the US states, Colorado (CO), Wyoming (WY), South Dakota (SD) and North Dakota (ND), and the Canadian province of Manitoba (MB) where populations were sampled. Inset in the southern Manitoba map shows the location of that site in the province, and inset in the Boulder County map shows its location in Colorado.
3.1.1. Colorado
The majority of the populations sampled were located in Colorado (66 sites) and specifically in Boulder County (41 sites), ranging in elevation from 1797 m (Rocky Flats) to 2694 m (Eldora). Most populations were in the foothills in fairly mesic clearings, usually in ponderosa pine forests. In addition to the two common T and C chemotypes, three individual plants of a new chemotype with linalool (L) as the main component of their essential oil, were found in the southern‐most Colorado population. This represents a chemotype previously unknown for M. fistulosa. Analysis with a chiral GC column revealed a dominant amount of the (R)‐(−)‐linalool enantiomer (scent of lavender; = 99.4%, SD = 0.1) in all three plants.
3.1.2. Wyoming and the Dakotas
Six populations were sampled in Wyoming and the Dakotas. Three semi‐natural prairie sites were in northwestern North Dakota with two northern sites dominated by T chemotype plants and the more southern location containing mostly C plants. The two populations in South Dakota and the Wyoming site were in the Black Hills in mostly ponderosa pine forest. The northernmost of these three sites were monomorphic for T plants, while the other two had either all or almost all C chemotype plants.
3.1.3. Manitoba
Plants from the 14 Manitoba populations consisted of T, C, and G chemotypes. Five of the populations were within Spruce Woods Provincial Park and the remaining seven were from areas surrounding the park. Twelve populations were dominated by C chemotype plants, including four that were monomorphic for C. Two populations contained T as the dominant chemotype, but both had one C plant present. G chemotype plants were detected at five sites and except for one location that had a single T and G plant, always co‐occurred only with C plants. G plants were usually at low densities; however, at one site they accounted for more than a third of the plants analyzed.
3.1.4. Principal component analysis of Monarda fistulosa leaf compound data from field collections
The first two principal components (PC) using the concentration data of 14 compounds from 1007 M. fistulosa individuals over 54 populations from southern Colorado to southern Manitoba explained 91.0% of the variation (79.1% and 11.9% for PC 1 and PC 2, respectively; Figure 3a). PC 1 mostly represented the concentrations of thymol and carvacrol in respective T and C chemotypes. These two chemotypes had very similar amounts and percentages of the total essential oil of their main monoterpene (Table 1). Plants with increasing amounts of thymol (concentration, not percentage) corresponded to increasingly negative PC 1 values. C chemotype individuals showed a similar relationship, but higher positive PC 1 values were correlated with greater carvacrol amounts. In addition to variation in thymol and carvacrol amounts, PC 2 also included the variation in geraniol concentrations of the G chemotype plants from Manitoba. The three L plants were also a small part of the variation of PC 2. G and L plants both had higher amounts of their main monoterpene than T and C plants and a much higher percentage of the total essential oil (Table 1). While the component scores of some plants within sites were grouped closely together (see Data Availability Statement), the overall pattern was a result of variation in concentration of the main terpene in the various chemotypes.
FIGURE 3.

Principal component analysis (PCA) of concentration data of 14 compounds from 1007 Monarda fistulosa individuals from 54 populations from southern Colorado to southern Manitoba (a) the first two principal components showing the four terpene chemotypes (thymol carvacrol, geraniol, and (R)‐(−)‐linalool) with the 95% prediction ellipse shown. (b) A plot of the eigenvectors of the 14 compounds used for the PCA with key terpenes labeled.
TABLE 1.
Means, standard deviations (SD), and ranges of the content (mg/g) of the four dominant monoterpenes in the four Monarda fistulosa chemotypes and their percentages (%) of the total essential oil
| Main chemotype terpene | Thymol N = 419 | Carvacrol N = 568 | Geraniol N = 17 | Linalool N = 3 |
|---|---|---|---|---|
| Content [mg/g (SD)] | 38.8 (15.7) | 42.5 (14.1) | 61.4 (30.1) | 85.9 (6.3) |
| Range | 9.8–79.1 | 9.4–114.7 | 34.6–141.9 | 81.0–93.0 |
| % of total essential oil (SD) | 74.7 (5.4) | 75.1 (7.5) | 95.8 (0.7) | 97.5 (0.2) |
| Range | 42.6–83.3 | 37.7–89.0 | 94.4–96.7 | 97.3–97.6 |
A plot of the eigenvectors of the 14 compounds used for the PCA (Figure 3b) explained why the arrangement of the component scores of M. fistulosa individuals (Figure 3a) was mostly due to the concentrations of the main terpenes in T, C, and G chemotype plants. The eigenvectors for thymol and carvacrol were widely spaced across the upper quadrants of PC 1 and both relatively far from the zero point of PC 1. Thymol and carvacrol eigenvectors also deviated considerably from the PC 2 zero point, but geraniol did as well (negative PC 2 eigenvector values). The remaining compounds grouped closely in the center of the eigenvector plot and contributed very little to the component score pattern.
3.2. Intraplant chemical variation
Different M. fistulosa plant tissues varied in their content and composition of terpenes (Figure 4). In most cases, stems and roots differed from all other parts and had the lowest concentration of essential oils. In the 13 C chemotype plants analyzed, γ‐terpinene differed between the various tissues (F 7,96 = 59.84, p < .001) and was found at its highest levels in flowers, calyces, and leaves, all of which differed from bracts, stems, and roots (Figure 4a). The lowest amount of this compound was in stems and roots, which differed from bracts. M. fistulosa parts had different carvacrol methyl ether contents (F 7,16 = 98.48, p < .001), including low levels in flowers, calyces, and bracts compared with leaves (Figure 4b). p‐Cymene content also differed between tissues (F 7,96 = 66.98, p < .001) in a pattern similar to that of γ‐terpinene, except for much lower amounts in calyces and roots (Figure 4c). The different tissues varied in their thymol content (F 7,96 = 43.94, p < .001), the minor phenolic in these C plants, with the highest amount in flowers and calyces, which differed from all other tissues (Figure 4d). Levels of the dominant monoterpene carvacrol and total terpenes also varied between tissues (F 7,96 = 51.37, p < .001 and F 7,96 = 66.81, p < .001, respectively) with the highest levels in the first leaf and then decreasing with leaf position and from flowers to bracts (Figure 4e,f).
FIGURE 4.

Intraplant terpene variation in Monarda fistulosa. Mean content [mg/g dry weight (DW) ± SE] of the main terpenes and total compounds in different tissues of 13 carvacrol (C) chemotype (a–f) and five geraniol (G) chemotype plants (g and h). FLW = corollas (including sexual parts); CAL = calyces; BRT = bracts; L1–L3 = first, second, and third leaves below the capitula; STM = stem; RT = root. Root samples contained terpenes, but in levels too low to be seen in the plots. Leaves L1 and L3 and roots were not collected from G plants. Significant ANOVA tests (α = 0.05) were followed by post hoc testing, indicated by letters above the bars. Means with the same letters were not significantly different. Note the difference in scales.
The trends for essential oils among the parts of G chemotype plants were similar to those of C plants, but the only statistical differences were between the low amounts seen in stems compared with all other tissues (Figure 4g,h). The main monoterpene geraniol, which constituted most of the essential oil (Figure 4g), and the total compounds (Figure 4h) both differed between tissues (F 4,20 = 14.88, p < .001 and F 4,20 = 15.07, p < .001, respectively) and in a similar pattern.
3.3. Seasonal ontogeny of monoterpenes
Plants of both T (Figure 5a–e) and C (Figure 5f–j) chemotypes, followed over the 2007 growing season, displayed differences in the amounts of all compounds between at least two of the five collection periods [all significant (p < .001) for the repeated measures factor of time]. In both T (Figure 5a) and C (Figure 5f) chemotype plants, the levels of γ‐terpinene showed no differences among the April and July collection dates, but were higher in June, lower at the end of September, and by December could no longer be detected in leaves. Levels of p‐cymene (Figure 5b,g) were their lowest in April and June, increased to their highest amount in late September, and remained there for the rest of the year. Amounts of the dominant monoterpene in both chemotypes [Figure 5d (thymol) and 5i (carvacrol)] increased steadily from April, peaked in July, and then dropped to very low levels by early December. In addition, there was always more of the minor phenolic carvacrol in T plants (Figure 5c) than thymol in C plants (Figure 5h). Total compounds mostly mirrored the patterns seen for the dominant terpenes (Figure 5e,j), except for relatively high total amounts in T plants in June, due to greater levels of γ‐terpinene and p‐cymene.
FIGURE 5.

Ontogenetic changes of the main terpenes and the total in Monarda fistulosa foliage over a growing season. Mean (± SE) amounts in mg terpene g−1 dry weight (DW) of the main terpenes and total compounds in 14 thymol (T) and 16 carvacrol (C) chemotype plants at five time points during the 2007 season. F and significance values (***p < .001) are for the repeated measures analyses factor of time. Letters above points indicate results of post hoc testing. Means with the same letters were not significantly different. Note the difference in scales.
3.4. Comparing chemotypes of historic and contemporary sites
All of the historic M. fistulosa herbarium samples contained measurable amounts of terpenes and plant chemotype was able to be determined for all, except for the sample from Boulder Canyon, which had equal amounts of carvacrol and thymol. Besides p‐cymene, thymoquinone, carvacrol methyl ether, thymol, and carvacrol, some of the historic samples also contained small amounts of compounds found in contemporary samples, including α‐pinene, limonene, and octen‐3‐ol. One sample from Palmer Lake, CO, originally collected in 1901, contained a large amount of geraniol, but this monoterpene was not seen in any appreciable amount in samples collected at that site in 2003, or in any other plants collected in Colorado.
The contemporary resampling of 20 populations where herbarium samples had been collected yielded nine sites where T chemotypes dominated and ten sites where C chemotypes were the majority. The Uncompahgre Plateau site had equal proportions of the T and C chemotypes and thus the chances were equal that the historic sample would match one of these. After excluding both the Boulder Canyon herbarium sample and the Uncompahgre Plateau site, the chemotypes from 15 of the 18 historic herbarium samples matched those of the most abundant chemotypes found after recent sampling, which did not differ from expected [χ2 (1, N = 18) = 0.114, p = .735].
Regression analyses of the amounts of compounds over time (collection date) showed positive relationships for the content of p‐cymene (Figure 6a), thymoquinone (Figure 6b), total phenolic monoterpenes (Figure 6c), and total terpenes (Figure 6d). Thus, the amounts of all compounds measured and the total decreased with herbarium sample age.
FIGURE 6.

The major terpenes detected in 44 accessions of Monarda fistulosa from the University of Colorado Museum Herbarium (COLO). Regression results of the content [mg/g dry weight (DW)] of the main terpenes versus collection date.
4. DISCUSSION
4.1. Spatial variation of M. fistulosa chemistry
The results of this study revealed that even within a restricted part of its range a species can have considerable amounts of secondary chemistry variation at different spatial and temporal scales. The broadest geographic scale showed that most of the M. fistulosa populations analyzed contained plants of either T or C chemotypes; however, the ratio of these two chemotypes varied across the landscape, even over relatively short distances as seen in the intense sampling in Colorado. While the reasons for the chemotype patterns observed in M. fistulosa are not immediately clear, abiotic selective forces do not seem to be important. A regression analysis of M. fistulosa chemotype percentages (%T) versus elevation, a proxy of temperature, of the Colorado sites was not significant (R 2 = 0.01, p = .43). Studies of other labiates that also have T and C chemotypes have been mixed in their explanation of geographic patterns due to abiotic parameters. Work with Origanum vulgare ssp. hirtum in Greece revealed that although the total amount of essential oil in plants of both T and C chemotypes could be partially explained by elevation, summer water deficiency, and thermal efficiency; the spatial distribution was not correlated with any of these factors (Vokou et al., 1993). By contrast, in reciprocal transplant experiments of Thymus vulgaris in southern France, Thompson et al. (2007) found that not only are T and C plants restricted to warmer areas as compared to nonphenolic chemotypes plants (including G and L), but T plants were better able to resist early freezing episodes than C plants. While the differential response to cold in thyme phenolic chemotypes helps determine where they are found, these abiotic effects probably matter less to M. fistulosa, due to a different growth strategy. Although both thyme and M. fistulosa are perennials, most thyme species have above‐ground foliage year‐round, including during periods when it would be exposed to extreme cold. By contrast, M. fistulosa plants die back completely with the onset of winter and then resprout from roots the next spring.
Biotic factors may be more important in determining chemical patterns in M. fistulosa. For instance, recent work with M. fistulosa populations in Montana and Wisconsin showed that important ecological traits, such as terpene production versus plant biomass (growth‐defense tradeoff), can vary within and among populations in different regions (Hahn et al., 2021). Also, while T and C chemotypes seem to be more resistant overall to herbivores than other chemotypes (Linhart & Thompson, 1999), the M. fistulosa specialist tortoise beetle Physonota unipunctata performed better on and did more damage to T plants (Keefover‐Ring, 2015), which could shift population proportions of these two chemotypes. Finally, genetic dominance of specific chemotypes could also alter population chemistry. In T. vulgaris, monoterpene chemotypes are under the control of an epistatic cascade, where geraniol plants are dominant over all other chemotypes and thymol plants are completely recessive (Vernet et al., 1986). T. vulgaris also contains the same four chemotypes that I found in M. fistulosa with the order of dominance determined to be: G > L > C > T. This pattern also seems to be the case in the genus Monarda, at least for G, L, and T individuals (Marshall & Scora, 1972). Thus, pollination and seed dispersal would be biotic factors important in shaping M. fistulosa chemotype configurations.
The smaller spatial scale of different parts of a single plant also showed considerable amounts of chemical variation in M. fistulosa, with differing patterns among compounds. Stems and roots were the least chemically defended in both the C and G plants tested, a pattern seen in other mint family species (Tajbakhsh et al., 2007; Velickovic et al., 2002). These structures may depend primarily upon their woodiness for protection. Compared with stems and roots, the other tissues of M. fistulosa analyzed had relatively high amounts of terpenes, and in general, most compounds had similar levels in reproductive parts (flower petals and calyces) and leaves, with bracts usually lower. The relatively high amounts of terpenoids in the reproductive parts of M. fistulosa fits with optimal defense theory, which predicts that plant tissues most important to fitness should be most constitutively defended (McKey, 1974). However, higher levels of secondary compounds in floral parts can also be a liability when specialist herbivores are concerned. Smallegange et al. (2007) found that although the flowers of Brassica nigra contained levels of glucosinolates up to five times higher than those of leaves, they sustained much more damage from specialist pierid caterpillars. M. fistulosa may suffer the same fate in populations where both larvae and adults of the one‐spotted tortoise beetle Physonota unipunctata feed on foliage and floral parts, causing significant reductions in seed set due to feeding on terpene‐rich flower heads (Keefover‐Ring, 2015).
4.2. Temporal variation of M. fistulosa chemistry
The short‐term temporal changes in M. fistulosa chemistry seen during the 2007 growing season were dramatic and T and C chemotypes demonstrated somewhat different patterns in both their individual terpenes and total compounds. In general, essential oils in both chemotypes were relatively low early in the spring, reached their highest levels in late summer during plant flowering, and then steadily declined to low final levels after leaf senescence. The most notable differences among chemotypes were seen in samples collected on June 1 that showed T plants had significantly higher amounts of total terpenes, due mostly to a much higher amount of the phenolic precursor γ‐terpinene. While the chemical defense of labiates is usually thought to be constitutive, these results show that the chemical phenotype of these plants is quite variable during a single season and this may present a “moving target” to potential herbivores (Adler & Karban, 1994), or even to pollinators, since the changing amounts of the more volatile monoterpenes (γ‐terpinene and p‐cymene) in plant tissues during the season will lead to temporal changes in terpene emissions (Keefover‐Ring, 2013). Finally, the seasonal change in essential oil composition also indicates that the allelopathic potential of M. fistulosa may change over the growing season (Linhart et al., 2015).
Comparisons of M. fistulosa herbarium samples with current populations and the detection of new chemotypes are both indicators of the possible long‐term structure of the species' chemistry. First, due to their inherently stable aromatic structure and very high boiling points for monoterpenes (thymol, 232°C, and carvacrol, 238°C), the chemotypes of dried T and C plants should be preserved for long periods of time. My own recent testing of dried M. fistulosa foliage collected 16–18 years ago for this work showed that chemotypes had not changed. Overall, results from the herbarium samples indicated that M. fistulosa chemotype distributions may have remained stable for more than a century in Colorado, with the chemotype identities of most historic samples matching those of contemporary populations. Although a single plant sample from each location represents only a snapshot of a population's past chemical diversity; the frequency at which the past and present samples agreed provides some evidence of little change in chemotypes. This should not be surprising, since even the time frame of 125 years is relatively short to expect evolutionary change in a perennial plant.
While material from herbarium samples is routinely used for molecular genetic analysis, this resource has less often been used to assess the past chemical diversity of a species (Almasirad et al., 2007; Baser et al., 2005; Novak et al., 2002), and only rarely in an ecological context (Berenbaum & Zangerl, 1998; Zangerl & Berenbaum, 2005). Zangrel and Berenbaum (2005) used herbarium specimens of wild parsnip (Pastinaca sativa) to see whether close association with a specialized lepidopteron herbivore caused changes in furanocoumarin amounts compared with contemporary plants. In their study, even the oldest plants contained furanocoumarins, which also decreased in amount with sample age. The historic M. fistulosa samples I tested demonstrated that essential oils can be recovered from plants collected up to 125 years ago and that chemotypes of even the oldest individuals could be determined since the dominant terpene of T and C chemotypes of M. fistulosa could still be detected. However, herbarium samples will lose even these less volatile terpenes (thymol and carvacrol) over time, as can be seen from the regressions of compound content versus sample collection year. In addition, differential loss of terpenes due to very dissimilar volatilities (Keefover‐Ring, 2013), combined with compound degradation, such as the conversion of thymol and carvacrol to thymoquinone (Jukic & Milos, 2005; Krause et al., 2021), led to results that cannot be directly compared with the exact chemical profiles of contemporary plants. Thus, due to the physical properties of mono‐ and sesquiterpenes, herbarium samples containing essential oils can probably only be used in qualitative comparisons to contemporary material (Novak et al., 2002).
The appearance of a new trait in a population may lead to evolution in that species if that trait possesses some advantage over an existing one. In the case of essential oil phenotypes in M. fistulosa, for a large extent of its range, the T and C chemotypes have been very successful in remaining the only plant chemotypes, possibly due to the greater toxicity these compounds have shown toward a range of herbivores and parasites (Linhart & Thompson, 1995, 1999), and plant competitors (Linhart et al., 2015; Tarayre et al., 1995), compared with other monoterpenes. However, two other chemotypes of M. fistulosa have arisen—G chemotype plants in Canada and L chemotype plants in Colorado. Marshall and Scora (1972) were the first to formally document the existence of a geraniol chemotype of wild bergamot in and around Spruce Woods Provincial Park, known to exist since at least the mid‐1950s. They theorized that the G chemotype probably represents a recent mutation in the species, since it is very restricted in its distribution, but can still readily interbreed with other M. fistulosa chemotypes (Marshall & Scora, 1972). My analyses of M. fistulosa populations in Manitoba more than 30 years after their collections show that this new chemotype has persisted, although without detailed baseline population chemotype demographics it is difficult to tell if the proportions of G to T and C chemotypes have changed over time. At the opposite latitude of my sampling area in southern Colorado, another new M. fistulosa chemotype was discovered with plants containing (R)‐(−)‐linalool as their dominant monoterpene. All other plants at the site were either C or T chemotype plants and there appeared to be no morphological differences between these and the L individuals. Only three plants of this new chemotype were found, out of the almost 600 assayed by chemical or olfactory means (L plants smell very different than T or C) at this site, thus, it seems likely that these plants may also represent a very recent mutation (Marshall & Scora, 1972). Unlike the new chemical race of geraniol plants in Canada, the fate of this new chemotype remains to be seen, although they were still at the site in the summer of 2019 (Keefover‐Ring, personal observation). The process of evolution is a series of trials with new phenotypes, and sometimes these experiments fail. While evidence from other labiates shows that T and C chemotypes certainly have an advantage over nonphenolics with respect to withstanding herbivory (Linhart & Thompson, 1999) or inhibiting competitors (Linhart et al., 2015), G and L chemotypes may possess characteristics that may favor them. For instance, both of these chemotypes produce monoterpenes (linalool and geraniol) known to attract pollinators (Andersson & Dobson, 2003; Schmidt, 1999) or deter herbivores, such as grasshoppers (Linhart & Thompson, 1999) or aphids (Linhart et al., 2005). Also, data from Marshall and Scora (1972) hinted that the inheritance pattern of M. fistulosa chemotypes may be G > L > C > T, as is the case in T. vulgaris (Vernet et al., 1986). If so, it is likely that the new chemotypes will continue to expand their range since any pollen transfer from G and L plants to C or T plants will mostly result in G or L offspring (Marshall & Scora, 1972; Vernet et al., 1986). Recent evidence shows that M. fistulosa individuals with chemotypes other than T or C may be more widespread than previously thought. In the summers of 2020 and 2021, I detected a few G and L plants in remnant or restored prairie sites near Madison, WI (Keefover‐Ring, personal observation). In addition, at one of these sites, several plants were found containing 1,8‐cineole (eucalyptol; scent of eucalyptus) and α‐terpineol (pine‐like scent), which alternated as the largest peak in their essential oil profile (Keefover‐Ring, personal observation). While these chemotypes have never been described in M. fistulosa, Scora (1967) found relatively high levels of both of these monoterpenes in different M. fistulosa varieties. In addition, T. vulgaris has both 1,8‐cineole and α‐terpineol chemotypes in some populations (Keefover‐Ring et al., 2009), increasing the number of chemotypes shared by these two mint species, despite their geographic separation. The chemical characterization of these Wisconsin sites is ongoing, although the majority of plants appear to be mostly T or C chemotypes (Keefover‐Ring, personal observation).
5. CONCLUSIONS
M. fistulosa demonstrated large amounts of chemical diversity at all of the spatial and temporal scales examined. At the landscape level, the T and C chemotypes were the most widespread and the concentrations of their main monoterpene explained most of the variation in chemistry across populations. While this species is dominated by these two main chemotypes, the persistence of a recent G chemotype in southern Manitoba and the discovery of a new L chemotype in southern Colorado highlight the possibility that the chemotype distributions of M. fistulosa could change, which will influence chemistry‐driven interactions between this plant species and other community members. The essential oil variation within a plant, among different parts, revealed that foliage and reproductive structures are well defended, especially compared with stems and roots. Furthermore, many of the individual terpenes expressed separate patterns in different plant tissues. Temporal variation in M. fistulosa, at the scale of a single season, showed that plants start relatively low in total terpenes, reach a peak in late summer, and decrease sharply as leaves senesce. In addition, separate main monoterpenes follow different seasonal trajectories, and in some cases, the behavior of the same compound diverges among chemotypes. Results of analyses of herbarium samples with contemporary material seemed to indicate that the chemotype distributions of M. fistulosa have for the most part been stable for at least the last century. All of these patterns of secondary chemistry variation in M. fistulosa have implications for the chemical ecology of the species, possibly leading to different interactions with other community members over both space and time.
AUTHOR CONTRIBUTIONS
Ken Keefover‐Ring: Conceptualization (equal); data curation (equal); formal analysis (equal); funding acquisition (equal); investigation (equal); methodology (equal); project administration (equal); writing – original draft (equal); writing – review and editing (equal).
FUNDING INFORMATION
This work was supported by grants from the University of Colorado Museum Walker Van Riper Fund, the Colorado Native Plant Society, and a 2020 Fall Competition Grant from the University of Wisconsin‐Madison, Office of the Vice Chancellor for Research, and Graduate Education with funding from the Wisconsin Alumni Research Foundation to K.K.‐R.
CONFLICT OF INTEREST
None declared.
ACKNOWLEDGMENTS
Lynn Riedel [Boulder Open Space and Mountain Parks (BOSMP)], Helios Hernandez (Manitoba Conservation), and Andy Kratz (US Forest Service) assisted in obtaining permits to collect on public lands. Ann Armstrong (BOSMP) collected samples on her property and Carol Kearns allowed collection on her property. Gerry Rosset (Spruce Woods Provincial Park) helped with work in Manitoba and allowed collection on his property. Yan Linhart, Deane Bowers, Tom Ranker, Russ Monson, Frank Stermitz, two anonymous reviewers, and an associate editor all gave helpful feedback to drafts of this work. Finally, thanks to Naiomi and Nevaeh Randle‐Brown for help finding new Wisconsin chemotypes, which will help continue this work.
APPENDIX A.
The chemical biogeography of a widespread aromatic plant species shows both spatial and temporal variation
TABLE A1.
GPS coordinates, chemotype counts, and collection date of Monarda fistulosa leaf collection sites for chemotype mapping
| Sites | GPS coordinates | Chemotype | Collection date | ||||
|---|---|---|---|---|---|---|---|
| N | W | C | T | G | L | ||
| Canada | |||||||
| Aweme | 49.70846 | 99.60201 | 1 | 13 | 0 | 0 | 26‐Jul‐04 |
| Manitoba‐1 | 49.88105 | 99.16388 | 16 | 0 | 0 | 0 | 25‐Jul‐04 |
| Manitoba‐2 | 49.90125 | 99.11055 | 22 | 0 | 3 | 0 | 25‐Jul‐04 |
| Manitoba‐3 | 49.90519 | 99.13282 | 8 | 0 | 0 | 0 | 25‐Jul‐04 |
| Manitoba‐4 | 49.90967 | 99.13271 | 19 | 0 | 3 | 0 | 25‐Jul‐04 |
| Manitoba‐5 | 49.95134 | 98.92655 | 17 | 0 | 1 | 0 | 26‐Jul‐04 |
| Manitoba‐6 | 49.64935 | 99.5523 | 1 | 6 | 0 | 0 | 26‐Jul‐04 |
| Spruce Woods‐1 | 49.70923 | 99.26476 | 19 | 1 | 0 | 0 | 24‐Jul‐04 |
| Spruce Woods‐2 | 49.71694 | 99.27588 | 10 | 0 | 0 | 0 | 24‐Jul‐04 |
| Spruce Woods‐5 | 49.71828 | 99.28900 | 20 | 2 | 0 | 0 | 24‐Jul‐04 |
| Spruce Woods‐6 | 49.89442 | 99.52022 | 20 | 0 | 0 | 0 | 25‐Jul‐04 |
| Spruce Woods‐7 | 49.88808 | 99.51678 | 19 | 1 | 0 | 0 | 25‐Jul‐04 |
| Spruce Woods‐8 | 49.70009 | 99.25545 | 16 | 0 | 9 | 0 | 27‐Jul‐04 |
| Spruce Woods‐9 | 49.65536 | 99.24690 | 11 | 1 | 1 | 0 | 27‐Jul‐04 |
| N. and S. Dakota and Wyoming | |||||||
| Carpio, ND | 48.43685 | 101.7258 | 0 | 16 | 0 | 0 | 29‐Jul‐04 |
| New Town, ND | 47.96736 | 102.7285 | 6 | 15 | 0 | 0 | 29‐Jul‐04 |
| Roosevelt Expressway, ND | 47.54307 | 103.2372 | 14 | 1 | 0 | 0 | 29‐Jul‐04 |
| Black Hills, WY | 43.93157 | 104.1841 | 11 | 4 | 0 | 0 | 30‐Jul‐04 |
| Black Hills‐1, SD | 44.29551 | 103.8826 | 0 | 14 | 0 | 0 | 30‐Jul‐04 |
| Black Hills‐2, SD | 44.17639 | 104.0507 | 14 | 0 | 0 | 0 | 30‐Jul‐04 |
| Boulder County, CO | |||||||
| Armstrong | 39.96289 | 105.3137 | 18 | 12 | 0 | 0 | 15‐Jul‐05 |
| Walker Ranch‐1 | 39.94851 | 105.3381 | 0 | 10 | 0 | 0 | 23‐Aug‐02 |
| Walker Ranch‐2 | 39.94427 | 105.3370 | 0 | 10 | 0 | 0 | 23‐Aug‐02 |
| Walker Ranch‐3 | 39.94257 | 105.3382 | 1 | 10 | 0 | 0 | 23‐Aug‐02 |
| Walker Ranch‐4 | 39.94066 | 105.3407 | 0 | 10 | 0 | 0 | 23‐Aug‐02 |
| Walker Ranch‐5 | 39.93841 | 105.3405 | 10 | 0 | 0 | 0 | 23‐Aug‐02 |
| Walker Ranch‐6 | 39.93452 | 105.3385 | 0 | 10 | 0 | 0 | 23‐Aug‐02 |
| Walker Ranch‐7 | 39.93429 | 105.3382 | 0 | 10 | 0 | 0 | 23‐Aug‐02 |
| Walker Ranch‐8 | 39.92997 | 105.3358 | 0 | 10 | 0 | 0 | 23‐Aug‐02 |
| Walker Ranch‐9 | 39.94125 | 105.3135 | 7 | 3 | 0 | 0 | 23‐Aug‐02 |
| Walker Ranch‐10 | 39.94224 | 105.3144 | 3 | 7 | 0 | 0 | 23‐Aug‐02 |
| Walker Ranch‐11 | 39.94662 | 105.3172 | 0 | 10 | 0 | 0 | 23‐Aug‐02 |
| Walker Ranch‐12 | 39.94965 | 105.3186 | 2 | 8 | 0 | 0 | 23‐Aug‐02 |
| Walker Ranch‐13 | 39.95164 | 105.3194 | 6 | 4 | 0 | 0 | 23‐Aug‐02 |
| Walker Ranch‐14 | 39.95283 | 105.3206 | 3 | 7 | 0 | 0 | 23‐Aug‐02 |
| Walker Ranch‐15 | 39.94953 | 105.3360 | 4 | 6 | 0 | 0 | 23‐Aug‐02 |
| Dowdy Draw | 39.91794 | 105.2591 | 26 | 0 | 0 | 0 | 20‐Jul‐03 |
| Mount Sanitas | 40.02074 | 105.2965 | 7 | 11 | 0 | 0 | 20‐Jul‐03 |
| Mesa Trail | 39.94261 | 105.2630 | 1 | 0 | 0 | 0 | 25‐May‐03 |
| Boulder Canyon | 39.98234 | 105.4449 | 0 | 16 | 0 | 0 | 7‐Jul‐03 |
| Left Hand Canyon‐1 | 40.13232 | 105.2934 | 12 | 13 | 0 | 0 | 7‐Jul‐03 |
| Left Hand Canyon‐2 | 40.10455 | 105.3376 | 20 | 10 | 0 | 0 | 7‐Jul‐03 |
| Left Hand Canyon‐3 | 40.13915 | 105.4147 | 6 | 23 | 0 | 0 | 7‐Jul‐03 |
| Magnolia | 39.97750 | 105.3987 | 1 | 19 | 0 | 0 | 7‐Jul‐03 |
| Boulder Can Public Service | 40.00718 | 105.3295 | 0 | 6 | 0 | 0 | 7‐Jul‐03 |
| Four Mile Canyon‐1 | 40.04766 | 105.3674 | 9 | 8 | 0 | 0 | 9‐Jul‐03 |
| Four Mile Canyon‐2 | 40.02952 | 105.3410 | 0 | 2 | 0 | 0 | 9‐Jul‐03 |
| Salina‐02 | 40.05147 | 105.3726 | 0 | 1 | 0 | 0 | 9‐Jul‐03 |
| Salina‐01 | 40.05422 | 105.3778 | 0 | 2 | 0 | 0 | 9‐Jul‐03 |
| Gregory Canyon Trailhead | 39.99740 | 105.2930 | 6 | 25 | 0 | 0 | 10‐Jul‐03 |
| Shanahan Ridge | 39.96173 | 105.2633 | 17 | 0 | 0 | 0 | 17‐Jul‐03 |
| Rocky Flats | 39.91309 | 105.1845 | 8 | 0 | 0 | 0 | 20‐Jul‐03 |
| Bear Canyon‐1 | 39.97388 | 105.2826 | 16 | 4 | 0 | 0 | 21‐Jul‐03 |
| Bear Canyon‐2 | 39.97811 | 105.2836 | 20 | 0 | 0 | 0 | 21‐Jul‐03 |
| Homestead Trail | 39.94388 | 105.2754 | 21 | 0 | 0 | 0 | 6‐Aug‐03 |
| Shadow Canyon | 39.94347 | 105.2792 | 21 | 0 | 0 | 0 | 6‐Aug‐03 |
| Upper Gregory Canyon | 39.99758 | 105.3066 | 19 | 103 | 0 | 0 | 13‐Jul‐05 |
| Eldora | 39.94432 | 105.5598 | 22 | 3 | 0 | 0 | 24‐Jul‐05 |
| Sugar Loaf | 40.02260 | 105.4440 | 4 | 26 | 0 | 0 | 24‐Jul‐05 |
| County Road 103 | 39.99699 | 105.5027 | 11 | 20 | 0 | 0 | 24‐Jul‐05 |
| Sugar Loaf Rd | 40.00190 | 105.4729 | 0 | 20 | 0 | 0 | 24‐Jul‐05 |
| Colorado (w/o Boulder County) | |||||||
| Frazer Meadow Trail‐1 | 39.83889 | 105.4099 | 8 | 18 | 0 | 0 | 24‐Aug‐03 |
| Frazer Meadow Trail‐2 | 39.83372 | 105.4090 | 10 | 11 | 0 | 0 | 24‐Aug‐03 |
| Coal Creek Canyon Rd‐1 | 39.87948 | 105.3189 | 2 | 13 | 0 | 0 | 18‐Jul‐03 |
| Coal Creek Canyon Rd‐2 | 39.87869 | 105.2693 | 10 | 0 | 0 | 0 | 24‐Aug‐02 |
| Estes Park | 40.32921 | 105.5735 | 0 | 10 | 0 | 0 | 18‐Jul‐02 |
| Pinewood | 40.27171 | 105.3567 | 10 | 0 | 0 | 0 | 18‐Jul‐02 |
| North Platte River Rd | 39.34364 | 105.1773 | 0 | 10 | 0 | 0 | 9‐Aug‐02 |
| Mount Gilbrath Park | 39.77247 | 105.2544 | 25 | 3 | 0 | 0 | 11‐Jul‐03 |
| Golden Gate Rd | 39.76789 | 105.2778 | 29 | 1 | 0 | 0 | 11‐Jul‐03 |
| Mount Vernon | 39.71960 | 105.2881 | 14 | 0 | 0 | 0 | 11‐Jul‐03 |
| Crescent Meadows | 39.92902 | 105.3405 | 37 | 7 | 0 | 0 | 16‐Jul‐03 |
| Horsetooth Mtn Park‐1 | 40.52849 | 105.1816 | 2 | 18 | 0 | 0 | 22‐Jul‐03 |
| Horsetooth Mtn Park‐2 | 40.53105 | 105.1877 | 1 | 19 | 0 | 0 | 22‐Jul‐03 |
| Masonville | 40.56683 | 105.3123 | 11 | 9 | 0 | 0 | 22‐Jul‐03 |
| Masonville Rd | 40.67073 | 105.3833 | 2 | 18 | 0 | 0 | 22‐Jul‐03 |
| Poudre Canyon‐1 | 40.69104 | 105.4882 | 0 | 20 | 0 | 0 | 23‐Jul‐03 |
| Poudre Canyon‐2 | 40.68257 | 105.4078 | 0 | 20 | 0 | 0 | 23‐Jul‐03 |
| Poudre Canyon‐3 | 40.69145 | 105.2543 | 0 | 20 | 0 | 0 | 23‐Jul‐03 |
| Palmer Lake | 39.12746 | 104.9071 | 13 | 1 | 0 | 0 | 24‐Jul‐03 |
| Highway 12 | 37.25548 | 105.0368 | 23 | 12 | 0 | 3 | 8‐Jul‐05 |
| East Canyon Creek | 39.62123 | 107.4180 | 0 | 7 | 0 | 0 | 14‐Aug‐03 |
| Aldrich Lakes | 40.17511 | 107.6844 | 29 | 0 | 0 | 0 | 15‐Aug‐03 |
| Uncompadre Plateau | 38.54447 | 108.4356 | 15 | 15 | 0 | 0 | 15‐Aug‐03 |
| Maroon Bells | 39.22863 | 107.1944 | 2 | 15 | 0 | 0 | 23‐Sep‐05 |
| Gleneagle | 39.04536 | 104.8443 | 5 | 14 | 0 | 0 | 24‐Nov‐05 |
Note: C = carvacrol, T = thymol, G = geraniol, and L = (R)‐(−)‐linalool. See Figure 2 in the main text.
TABLE A2.
University of Colorado Museum Herbarium (COLO) Monarda fistulosa samples analyzed for terpene chemotype and chemotype ratios from 20 of the sites recently revisited.
| Site (Colorado county) COLO accession # | Historic collection date | Historic chemotype | Recent chemotypes | Recent collection date |
|---|---|---|---|---|
| Glen Eyrie, Colorado Springs (El Paso) 101490 | Jul 17, 1872 | T | N/A | N/A |
| E. Denver along the Platte (Unknown) 23474 | Jul 1885 | C | N/A | N/A |
| Buffalo Park (Unknown) 23479 | Jul 11, 1901 | C | N/A | N/A |
| Palmer Lake (El Paso) 23483 | Jul 13, 1901 | C | 13 C: 1 T | Jul 24, 2003 |
| Gregory Canyon, near Boulder (Boulder) 23470 | Aug 12, 1901 | T | 6 C: 25 T | Jul 17, 2003 |
| Salina (Boulder) 23456 | Aug 20, 1901 | T | 0 C: 3 T | Jul 9, 2003 |
| Manitou (El Paso) 23482 | Jul 12, 1902 | T | N/A | N/A |
| Miller Gulch, Buffalo Park (Unknown) 23484 | Sep 7, 1903 | T | N/A | N/A |
| Below brickyard, near Boulder (Boulder) 55139 | Jul 18, 1905 | T | N/A | N/A |
| Bear Canyon (Boulder) 23459 | Jul 16, 1906 | C | 16 C: 4 T | Jul 21, 2003 |
| Eldora town site (Boulder) 23468 | Jul 28, 1906 | C | 22 C: 3 T | Jul 24, 2005 |
| Magnolia (Boulder) 23485 | Aug 22, 1907 | T | 1 C: 19 T | Jul 7, 2003 |
| South Boulder Canyon (Boulder) 23454 | Aug 24, 1907 | C | N/A | N/A |
| Meeker (Rio Blanco) 23487 | Aug 9, 1910 | T | N/A | N/A |
|
Naturita (Montrose) 332651 23473 |
Aug 1, 1912 Jul 17, 1914 |
T T |
N/A | N/A |
| Tabeguache Basin (Montrose) 23457 | Aug 19, 1913 | C | N/A | N/A |
| Berkeley (Arapahoe) 23476 | Jul 16, 1916 | T | N/A | N/A |
| Poudre Canon (Larimer) 322192 | Jul 25, 1917 | T |
0 C: 20 T 0 C: 20 T 0 C: 20 T |
Jul 22, 2003 |
| Along Piedra River (Archuleta) 23448 | Jul 8, 1924 | C | N/A | N/A |
| Near Boulder (Boulder) 23478 | Jul 20, 1924 | C | N/A | N/A |
| Cuchara Valley (Huerfano) 23451 | Jul 6, 1934 | T | 10 C: 9 T | Jul 25, 2003 |
| Aldrich Lake (Rio Blanco) 23489, 23493 | Jul 15, 1935 Jul 22, 1937 |
C C |
29 C: 0 T | Aug 14, 2003 |
| Mouth of Left Hand Canyon (Boulder) 23494 | Aug 7, 1935 | C | 13 C: 12 T | Jul 7, 2003 |
| Denver Mountain Parks near Golden (Jefferson) 23491 | Jul 5, 1941 | C | 19 C: 2 T | Jul 11, 2003 |
| Mt. Vernon Country Club (Jefferson) 23490 | Aug 3, 1941 | C | 14 C: 0 T | Jul 11, 2003 |
| Atop W. Mesa de Maya (Las Animas) 56072 | Jun 23, 1948 | T | N/A | N/A |
| North Thompson Creek Canyon (Pitkin) 64455 | Jul 28, 1951 | T | N/A | N/A |
| Estes Park, Rocky Mtn. Natl. Park (Larimer) 123392 | Aug 28, 1956 | C | 0 C: 10 T | 2002 |
| 3 miles north of Arboles (Archuleta) 215235 | Jul 22, 1960 | T | N/A | N/A |
| Boulder Canyon at Public Service (Boulder) 214765 | Jul 30, 1967 | T/C | 0 C: 6 T | Jul 7, 2003 |
| Rocky Flats site (Jefferson) 274751 | Jul 9, 1973 | C | 8 C: 0 T | Jul 20, 2003 |
| Along Dolores River (Montezuma) 431247 | Summer 1978 | C | N/A | N/A |
| Lost Creek Area, Tarryall Mtns (Jefferson) 429154 | Aug 8, 1979 | T | N/A | N/A |
| Spring Creek, W of Bull Creek (Mesa) 382665 | Jul 11, 1981 | C | N/A | N/A |
| Uncompahgre Plateau (Mesa) 383696 | Jul 19, 1982 | T | 15 C: 15 T | Aug 15, 2003 |
| Weminuche Wilderness (La Plata) 385607 | Aug 23, 1982 | C | N/A | N/A |
| Black Forest Along Kettle Creek (El Paso) 494842 | Jul 24, 1989 | C | N/A | N/A |
| Flat Tops/White River Plateau (Garfield) 466589 | Jul 25, 1990 | C | 0 C: 7 T | Jul 14, 2003 |
| Boulder Mt Parks West side of Bear Pk & S Boulder Pk (Boulder) 450606 | Jul 19, 1991 | T | N/A | N/A |
| South Table Mt (Jefferson) 449215 | Aug 19, 1991 | C | N/A | N/A |
| South Boulder Foothills Shanahan (Boulder) 453922 | Jun 28, 1993 | C | 16 C: 0 T | Jul 17, 2003 |
| Big Elk Meadows Road (Larimer) 521233 | Jul 10, 2001 | T | N/A | N/A |
| Platte Cañon (Unknown) 101517 | 25 May no year | C | N/A | N/A |
Abbreviations: C, carvacrol; T, thymol.
Keefover‐Ring, K. (2022). The chemical biogeography of a widespread aromatic plant species shows both spatial and temporal variation. Ecology and Evolution, 12, e9265. 10.1002/ece3.9265
DATA AVAILABILITY STATEMENT
PCA site comparison and chemistry data: Dryad DOI https://doi.org/10.5061/dryad.18931zd12.
REFERENCES
- Adler, F. R. , & Karban, R. (1994). Defended fortresses or moving targets? Another model of inducible defenses inspired by military metaphors. American Naturalist, 144(5), 813–832. [Google Scholar]
- Almasirad, A. , Amanzadeh, Y. , Taheri, A. , & Iranshahi, M. (2007). Composition of a historical rose oil sample (Rosa damascena mill., Rosaceae). Journal of Essential Oil Research, 19(2), 110–112. [Google Scholar]
- Andersson, S. , & Dobson, H. E. M. (2003). Antennal responses to floral scents in the butterfly Heliconius melpomene . Journal of Chemical Ecology, 29(10), 2319–2330. [DOI] [PubMed] [Google Scholar]
- Barton, K. E. , & Koricheva, J. (2010). The ontogeny of plant defense and herbivory: Characterizing general patterns using meta‐analysis. The American Naturalist, 175(4), 481–493. 10.1086/650722 [DOI] [PubMed] [Google Scholar]
- Baser, K. H. C. , Kurkcuoglu, M. , & Demirci, B. (2005). Ninde oil (Aeollanthus myrianthus Taylor) revisited: Analysis of a historical oil. Journal of Essential Oil Research, 17(2), 137–138. [Google Scholar]
- Berenbaum, M. R. , & Zangerl, A. R. (1998). Chemical phenotype matching between a plant and its insect herbivore. Proceedings of the National Academy of Sciences of the United States of America, 95(23), 13743–13748. [DOI] [PMC free article] [PubMed] [Google Scholar]
- Bohm, B. (2009). The geography of phytochemical races. Springer. [Google Scholar]
- Bowers, M. D. , & Stamp, N. E. (1992). Chemical variation within and between individuals of Plantago lanceolata (Plantaginaceae). Journal of Chemical Ecology, 18(7), 985–995. 10.1007/BF00980057 [DOI] [PubMed] [Google Scholar]
- Burt, J. B. (1936). Monarda pectinata, Nutt., a phytochemical study. Journal of the American Pharmaceutical Association, 25(8), 682–687. [Google Scholar]
- Chizzola, R. (2003). Volatile oil composition of four populations of Satureja montana L. from southern France. International Society for Horticultural Science. [Google Scholar]
- Criddle, N. (1926). A note on the synonymy of certain species of Physonota (coleoptera). The Canadian Entomologist, 58, 207–208. [Google Scholar]
- Davis, M. A. , Lemon, M. , & Dybvig, A. (1988). The impact of prescribed burning and herbivorous insects on seed production and viability in two prairie forbs. Native Prairie Association of Texas. [Google Scholar]
- Fleisher, A. , & Sneer, N. (1982). Oregano spices and Origanum chemotypes. Journal of the Science of Food and Agriculture, 33(5), 441–446. [Google Scholar]
- Gershenzon, J. , & Dudareva, N. (2007). The function of terpene natural products in the natural world. Nature Chemical Biology, 3(7), 408–414. [DOI] [PubMed] [Google Scholar]
- Gouyon, P. H. , Vernet, P. , Guillerm, J. L. , & Valdeyron, G. (1986). Polymorphisms and environment: The adaptive value of the oil polymorphisms in Thymus vulgaris L. Heredity, 57, 59–66. [Google Scholar]
- Hahn, P. G. , Keefover‐Ring, K. , Nguyen, L. M. N. , & Maron, J. L. (2021). Intraspecific correlations between growth and defence vary with resource availability and differ within and among populations. Functional Ecology, 35(11), 2387–2396. 10.1111/1365-2435.13878 [DOI] [Google Scholar]
- Hamilton, J. (1884). On Trogoderma ornata, Physonota unipunctata, and Tanysphyrus lemnae . The Canadian Entomologist, 16, 133–135. [Google Scholar]
- Heinrich, G. (1973). Development, fine structure, and oil content of gland hairs of Monarda fistulosa . Planta Medica, 23(2), 154–166. [DOI] [PubMed] [Google Scholar]
- Hunter, M. D. (2016). The phytochemical landscape: Linking trophic interactions and nutrient dynamics. Princeton University Press. [Google Scholar]
- Johnson, H. A. , Rogers, L. L. , Alkire, M. L. , McCloud, T. G. , & NcLaughlin, J. L. (1998). Bioactive monoterpenes from Monarda fistulosa (Lamiaceae). Natural Product Letters, 11(4), 241–250. [Google Scholar]
- Johnson, R. H. , Young, B. L. , & Alstad, D. N. (1997). Responses of ponderosa pine growth and volatile terpene concentrations to manipulation of soil water and sunlight availability. Canadian Journal of Forest Research‐Revue Canadienne De Recherche Forestiere, 27(11), 1794–1804. [Google Scholar]
- Jukic, M. , & Milos, M. (2005). Catalytic oxidation and antioxidant properties of thyme essential oils (Thymus vulgarae L.). Croatica Chemica Acta, 78(1), 105–110. [Google Scholar]
- Karban, R. , & Baldwin, I. T. (1997). Induced responses to herbivory. University of Chicago Press. [Google Scholar]
- Keefover‐Ring, K. (2013). Making scents of defense: Do fecal shields and herbivore‐caused volatiles match host plant chemical profiles? Chemoecology, 23, 1–11. 10.1007/s00049-012-0117-7 [DOI] [Google Scholar]
- Keefover‐Ring, K. (2015). Bergamot versus beetle: Evidence for intraspecific chemical specialization. AoB PLANTS, 7, plv132. 10.1093/aobpla/plv132 [DOI] [PMC free article] [PubMed] [Google Scholar]
- Keefover‐Ring, K. , Ahnlund, M. , Abreu, I. N. , Jansson, S. , Moritz, T. , & Albrectsen, B. R. (2014). No evidence of geographical structure of salicinoid chemotypes within Populus tremula . PLoS One, 9(10), e107189. 10.1371/journal.pone.0107189 [DOI] [PMC free article] [PubMed] [Google Scholar]
- Keefover‐Ring, K. , Thompson, J. D. , & Linhart, Y. B. (2009). Beyond six scents: Defining a seventh Thymus vulgaris chemotype new to southern France by ethanol extraction. Flavour and Fragrance Journal, 24(3), 117–122. 10.1002/ffj.1921 [DOI] [Google Scholar]
- Keefover‐Ring, K. , Trowbridge, A. , Mason, C. J. , & Raffa, K. F. (2016). Rapid induction of multiple terpenoid groups by ponderosa pine in response to bark beetle‐associated fungi. Journal of Chemical Ecology, 42(1), 1–12. 10.1007/s10886-015-0659-6 [DOI] [PubMed] [Google Scholar]
- Krause, S. T. , Liao, P. , Crocoll, C. , Boachon, B. , Förster, C. , Leidecker, F. , Wiese, N. , Zhao, D. , Wood, J. C. , Buell, C. R. , Gershenzon, J. , Dudareva, N. , & Degenhardt, J. (2021). The biosynthesis of thymol, carvacrol, and thymohydroquinone in Lamiaceae proceeds via cytochrome P450s and a short‐chain dehydrogenase. Proceedings of the National Academy of Sciences, 118(52), e2110092118. 10.1073/pnas.2110092118 [DOI] [PMC free article] [PubMed] [Google Scholar]
- Langenheim, J. H. (1994). Higher plant terpenoids: A phytocentric overview of their ecological roles. Journal of Chemical Ecology, 20(6), 1223–1280. [DOI] [PubMed] [Google Scholar]
- Linhart, Y. B. (1991). Disease, parasitism and herbivory: Multidimensional challenges in plant evolution. Trends in Ecology and Evolution, 6(12), 392–396. [DOI] [PubMed] [Google Scholar]
- Linhart, Y. B. , Gauthier, P. , Keefover‐Ring, K. , & Thompson, J. D. (2015). Variable phytotoxic effects of Thymus vulgaris (Lamiaceae) terpenes upon associated species. International Journal of Plant Sciences, 176(1), 20–30. 10.1086/678772 [DOI] [Google Scholar]
- Linhart, Y. B. , Keefover‐Ring, K. , Mooney, K. A. , Breland, B. , & Thompson, J. D. (2005). A chemical polymorphism in a multitrophic setting: Thyme monoterpene composition and food web structure. American Naturalist, 166(4), 517–529. 10.1086/444438 [DOI] [PubMed] [Google Scholar]
- Linhart, Y. B. , & Thompson, J. D. (1995). Terpene‐based selective herbivory by Helix aspersa (Mollusca) on Thymus vulgaris (Labiatae). Oecologia, 102(1), 126–132. [DOI] [PubMed] [Google Scholar]
- Linhart, Y. B. , & Thompson, J. D. (1999). Thyme is of the essence: Biochemical polymorphism and multi‐species deterrence. Evolutionary Ecology Research, 1(2), 151–171. [Google Scholar]
- Loney, P. E. , McArthur, C. , Sanson, G. D. , Davies, N. W. , Close, D. C. , & Jordan, G. J. (2006). How do soil nutrients affect within‐plant patterns of herbivory in seedlings of Eucalyptus nitens? Oecologia, 150(3), 409–420. [DOI] [PubMed] [Google Scholar]
- Marshall, H. H. , & Scora, R. W. (1972). New chemical race of Monarda fistulosa (Labiatae). Canadian Journal of Botany, 50(9), 1845–1849. [Google Scholar]
- McKey, D. (1974). Adaptive patterns in alkaloid physiology. American Naturalist, 108(961), 305–320. [Google Scholar]
- Novak, J. , Langbehn, J. , Pank, F. , & Franz, C. M. (2002). Essential oil compounds in a historical sample of marjoram (Origanum majorana L., Lamiaceae). Flavour and Fragrance Journal, 17(3), 175–180. [Google Scholar]
- Pfab, I. , Heinrich, G. , & Schultze, W. (1980). On the essential oil of Monarda fistulosa L. occurring in glandular and non‐glandular tissues. Biochemie und Physiologie der Pflanzen, 175(1), 29–44. [Google Scholar]
- Prather, L. A. , Monfils, A. K. , Posto, A. L. , & Williams, R. A. (2002). Monophyly and phylogeny of monarda (Lamiaceae): Evidence from the internal transcribed spacer (ITS) region of nuclear ribosomal DNA. Systematic Botany, 27(1), 127–137. [Google Scholar]
- Pratt, J. D. , Keefover‐Ring, K. , Liu, L. Y. , & Mooney, K. A. (2014). Genetically based latitudinal variation in Artemisia californica secondary chemistry. Oikos, 123(8), 953–963. 10.1111/oik.01156 [DOI] [Google Scholar]
- Sanderson, M. W. (1948). Larval, pupal, and adult stages of north American Physonota (Chrysomelidae). Annals of the Entomological Society of America, 41(4), 468–477. [Google Scholar]
- SAS Institute Inc . (2013). SAS 9.4. SAS Institute Inc. [Google Scholar]
- Schmidt, J. O. (1999). Attractant or pheromone: The case of Nasonov secretion and honeybee swarms. Journal of Chemical Ecology, 25(9), 2051–2056. [Google Scholar]
- Scora, R. W. (1967). Study of the essential leaf oils of the genus monarda (Labiatae). American Journal of Botany, 54(4), 446–452. [Google Scholar]
- Skoula, M. , & Grayer, R. J. (2005). Volatile oils of Coridothymus capitatus, Satureja thymbra, Satureja spinosa and Thymbra calostachya (Lamiaceae) from Crete. Flavour and Fragrance Journal, 20(6), 573–576. [Google Scholar]
- Smallegange, R. C. , van Loon, J. J. A. , Blatt, S. E. , Harvey, J. A. , Agerbirk, N. , & Dicke, M. (2007). Flower vs. leaf feeding by Pieris brassicae: Glucosinolate‐rich flower tissues are preferred and sustain higher growth rate. Journal of Chemical Ecology, 33(10), 1831–1844. [DOI] [PMC free article] [PubMed] [Google Scholar]
- Stahl‐Biskup, E. , & Saez, F. (Eds.). (2002). Thyme: The genus thymus. Taylor and Francis. [Google Scholar]
- Straley, G. B. (1986). Wild bergamot, Monarda fistulosa (Lamiaceae), new to the Northwest Territories. Canadian Field Naturalist, 100(3), 380–381. [Google Scholar]
- Tajbakhsh, M. , Rineh, A. , & Khalilzadeh, M. A. (2007). Chemical composition of the essential oils from leaves, flowers, stem and root of Phlomis olivieri Benth. Journal of Essential Oil Research, 19(6), 501–503. [Google Scholar]
- Tarayre, M. , Thompson, J. D. , Escarre, J. , & Linhart, Y. B. (1995). Intra‐specific variation in the inhibitory effects of Thymus vulgaris (Labiatae) monoterpenes on seed germination. Oecologia, 101(1), 110–118. [DOI] [PubMed] [Google Scholar]
- Thompson, J. , Charpentier, A. , Bouguet, G. , Charmasson, F. , Roset, S. , Buatois, B. , Vernet, P. , & Gouyon, P. H. (2013). Evolution of a genetic polymorphism with climate change in a Mediterranean landscape. Proceedings of the National Academy of Sciences of the United States of America, 110(8), 2893–2897. 10.1073/pnas.1215833110 [DOI] [PMC free article] [PubMed] [Google Scholar]
- Thompson, J. D. , Gauthier, P. , Amiot, J. , Ehlers, B. K. , Collin, C. , Fossat, J. , Barrios, V. , Arnaud‐Miramont, F. , Keefover‐Ring, K. , & Linhart, Y. B. (2007). Ongoing adaptation to Mediterranean climate extremes in a chemically polymorphic plant. Ecological Monographs, 77(3), 421–439. [Google Scholar]
- Thompson, J. N. (2005). The geographic mosaic of coevolution. The Universtiy of Chicago Press. [Google Scholar]
- USDA . (2008). National resources conservation service. Retrieved from http://www.nrcs.usda.gov/
- Velickovic, D. T. , Ristic, M. S. , Randjelovic, N. V. , & Smelcerovic, A. A. (2002). Chemical composition and antimicrobial characteristic of the essential oils obtained from the flower, leaf and stem of Salvia officinalis L. originating from Southeast Serbia. Journal of Essential Oil Research, 14(6), 453–458. [Google Scholar]
- Vernet, P. , Gouyon, P. H. , & Valdeyron, G. (1986). Genetic control of the oil content in Thymus vulgaris L.: A case of polymorphism in a biosynthetic chain. Genetica, 69(3), 227–231. [Google Scholar]
- Vokou, D. , Kokkini, S. , & Bessiere, J. M. (1993). Geographic variation of Greek oregano (Origanum vulgare ssp. hirtum) essential oils. Biochemical Systematics and Ecology, 21(2), 287–295. [Google Scholar]
- Weaver, D. K. , Phillips, T. W. , Dunkel, F. V. , Weaver, T. , Grubb, R. T. , & Nance, E. L. (1995). Dried leaves from Rocky Mountain plants decrease infestation by stored‐product beetles. Journal of Chemical Ecology, 21(2), 127–142. [DOI] [PubMed] [Google Scholar]
- Wyckhuys, K. A. G. , Koch, R. L. , & Heimpel, G. E. (2007). Physical and ant‐mediated refuges from parasitism: Implications for non‐target effects in biological control. Biological Control, 40(3), 306–313. [Google Scholar]
- Zangerl, A. R. , & Berenbaum, M. R. (2005). Increase in toxicity of an invasive weed after reassociation with its coevolved herbivore. Proceedings of the National Academy of Sciences of the United States of America, 102(43), 15529–15532. [DOI] [PMC free article] [PubMed] [Google Scholar]
Associated Data
This section collects any data citations, data availability statements, or supplementary materials included in this article.
Data Availability Statement
PCA site comparison and chemistry data: Dryad DOI https://doi.org/10.5061/dryad.18931zd12.