

Abstract
Background:
The prognostic value of Glial Fibrillary Acidic Protein (GFAP) and Ubiquitin carboxy-terminal Hydrolase L1 (UCH-L1), as day-of-injury predictors of functional outcome after traumatic brain injuries (TBI) is not well understood. GFAP and UCH-L1 are proteins found in glial cells and neurons respectively and they have been approved to aid in decision making regarding brain CT imaging following TBI. We quantified their prognostic accuracies and investigated whether these biomarkers contribute novel prognostic information to existing clinical models.
Methods:
We evaluated participants with day-of-injury plasma samples and completed 6-month assessments from the Transforming Research and Clinical Knowledge in TBI (TRACK-TBI) study. TRACK-TBI enrolled patients evaluated for TBI at 18 U.S. level I trauma centers from 26/02/2014–08/08/2018. GFAP and UCH-L1 were measured using Abbott i-STAT™ Alinity™and ARCHITECT® assays. Six-month outcome due to TBI was measured with the Glasgow Outcome Scale Extended (GOSE-TBI). Biomarkers were analyzed as continuous variables and in quintiles.
Findings:
Of 1696 brain-injured participants with data available at baseline and at 6 months, 120 (7·1%) had died, 235 (13·9%) had an unfavorable outcome (GOSE-TBI≤4), and 1135 (66·9%) had incomplete recovery (GOSE-TBI<8). The AUCs of GFAP for predicting death, unfavorable outcome, and incomplete recovery at 6 months were: 0·87 (95% CI:0·83–0·91), 0·86 (95% CI:0·83–0·89), and 0·62 (95% CI:0·59–0·65), respectively. The corresponding AUCs for UCH-L1 were: 0·89 (95% CI:0·86–0·92), 0·86 (95% CI:0·84–0·89), and 0·61 (95% CI:0·59–0·64), respectively. AUCs were higher in GCS 3–12 than GCS of 13–15 TBI. Among GCS of 3–12 (n=353) participants, adding GFAP and UCH-L1 to the IMPACT models significantly increased their AUCs for predicting death (AUC: 0·9 to 0·94, p=0·002) and unfavorable outcome (AUC: 0·85 to 0·89, p=0·001). However, among GCS 13–15 participants, adding GFAP and UCH-L1 to the UPFRONT ED model increased the AUC modestly (AUC: 0·67 to 0·69, p=0·025).
Interpretation:
In addition to their known diagnostic value, day-of-injury GFAP and UCH-L1 have good to excellent prognostic value for predicting death and unfavorable outcome, but not for predicting incomplete recovery at 6 months. These biomarkers contribute the most prognostic information to participants presenting with GCS 3–12.
Introduction
Outcome following traumatic brain injury (TBI) is influenced by pre-injury factors (e.g., demographics, social history, and medical co-morbidities), injury factors (e.g., injury biomechanics, and the type, extent, and location of primary and secondary brain injury), treatment factors, and environmental factors.1 Different types of structural brain injury (e.g., contusions, subdural hemorrhages, or subarachnoid hemorrhages) can be visualized by computed tomography (CT) scanning, while others such as diffuse axonal or vascular injury, require magnetic resonance imaging (MRI)), and are well established as predictors of TBI outcome.2–5 During the past decade, several blood-based biomarkers of glial and neuronal cell injury, obtained on day-of-injury, have been reported to be associated with structural brain injury visualized by neuroimaging.6–9 Consequently, the U.S. Food and Drug Administration (FDA) cleared the use of two such biomarkers, Glial Fibrillary Acidic Protein (GFAP, a structural protein found in astrocytes) and Ubiquitin carboxyl-terminal Hydrolase L1 (UCH-L1, an enzyme found in high abundance in neurons) to aid clinicians in deciding whether to order a head CT for imaging structural brain injury following mild TBI (Glasgow Coma Scale [GCS] 13–15).10 These biomarkers are associated with clinically assessed injury severity and structural brain injury confirmed by CT and MRI.6–9,11,12
The utility of GFAP and UCH-L1 for early prediction of longer-term TBI outcomes has not been adequately studied. Early and accurate prediction of TBI outcomes is important both clinically and in research settings. Prognostic tools may guide discussions between clinicians and patients or family members regarding the expected course of recovery and therapeutic options. They also may inform subject selection in trials and may be used to adjust for baseline characteristics during the analysis of study results. Many existing studies evaluating the prognostic value of brain injury biomarkers are limited by modest sample sizes that yield imprecise estimates of prognostic value. More precise estimation of the prognostic value of day-of-injury levels of these biomarkers could provide early and more accurate information on which to base clinical decisions as well as more refined study design. Additionally, these biomarkers may add novel prognostic information to existing validated prognostic models which are based on clinical variables and CT measures.
The objectives of this study were: 1) to quantify the prognostic value of day-of-injury plasma levels of GFAP and UCH-L1 to predict death (GOSE-TBI=1), unfavorable outcome (GOSE-TBI≤4), and incomplete recovery (GOSE-TBI<8) at 6-months, in participants with TBI of all severities (presenting GCS 3–15); and 2) to determine whether these biomarkers contribute novel prognostic information to the International Mission for Prognosis and Analysis of Clinical Trials in TBI (IMPACT) Core and IMPACT Extended models for predicting death and unfavorable outcome in GCS 3–12 TBI13, and the UPFONT ED model for predicting incomplete recovery in GCS 13–15 TBI.14
Methods:
Transforming Research and Clinical Knowledge in TBI (TRACK-TBI) cohort is an 18-center prospective observational study of a convenience sample of subjects evaluated for TBI in emergency departments (ED) of U.S. level I trauma centers15 from 26/02/2014 through 08/08/2018. We analyzed data from 1696 subjects, age ≥17 years, who were enrolled between March 2014 and July 2018, had day-of-injury plasma GFAP and UCH-L1 measurements, and had completed a 6-month follow-up assessment. TBI was defined as injury to the brain that was at least as severe as injury described by the American Congress of Rehabilitation Medicine’s (ACRM) criteria.16 Subjects of all injury severities were included in the study according to the following criteria: were evaluated for TBI within 24 hours of injury either in the ED or hospital inpatient unit; received head computed tomography (CT) per order of evaluating physician; had adequate visual acuity/hearing pre-injury; and were fluent in English or Spanish. Exclusion criteria included: significant polytrauma that would interfere with follow-up (based on the judgment of the clinical team and research coordinators); penetrating TBI; prisoners or patients in custody; pregnancy; patients under psychiatric care without consent; being non-English or non-Spanish speaking; having a contraindication to MRI; major debilitating psychiatric (e.g., schizophrenia or bipolar disorder) or neurological disorders (e.g., stroke, dementia); or any other disorder that would interfere with assessment and follow-up or provision of informed consent, and current participant in an interventional trial.17 Written informed consent was obtained from subjects or legally authorized representatives. The study was approved by the institutional review boards of enrolling sites.
Demographic and clinical data were obtained by trained research assistants through medical record review and/or subject interviews. The Glasgow Coma Scale (GCS) was based on the first and most accurately documented post-resuscitation GCS. Head CT scans were sent to a central imaging repository and were read by a single board-certified neuroradiologist based on the Common Data Elements (CDE) in Radiologic Imaging of Traumatic Brain Injury.18 They were classified using the Marshall Head CT classification.19 Global functional recovery at 6 months was assessed either in-person (86%) or via telephone (14%) by trained study personnel using the Glasgow Outcome Scale-Extended (GOSE) and blinded to biomarker values. In subjects with multisystem trauma, the GOSE assessment specifically elicited the interviewees’ assessment of functional impairment solely attributable to the TBI, and not impairment related to other system injuries (GOSE-TBI).20 The primary outcomes were death (GOSE-TBI=1) or unfavorable outcome at 6 months postinjury (GOSE-TBI≤4). Patients who died were assigned a GOSE-TBI of 1 irrespective of the cause of death. The secondary outcome was incomplete recovery at 6 months (GOSE-TBI<8). Outcome assessors were blinded to biomarker measurements. Major extracranial injury was defined as an Abbreviated Injury Scale (AIS) of ≥3 in at least one of the extracranial domains. Since the AIS is only available for hospitalized patients, those who were discharged home were assumed to have no major extracranial injury.
We obtained blood samples within 24 hours of injury, and processed, aliquoted, and stored them in a −80°C freezer within 2 hours of collection. Sample acquisition, processing, and storage were performed following the TBI-CDEs Biospecimens and Biomarkers Working Group Guidelines.21 Coded samples were then shipped overnight on dry ice to a central repository, and from the central repository to the laboratory for analysis. Sample analysis occurred in a single laboratory (Abbott Laboratories, Abbott Park, IL) in batches by personnel blinded to sample information. Plasma samples used in this analysis underwent one freeze-thaw cycle.
The first batch of plasma GFAP and UCH-L1 concentrations (n=963) were measured using the prototype point-of-care i-STAT™ Alinity™ System. The second batch of plasma GFAP and UCH-L1 concentrations (n=733) were measured on the prototype core lab Abbott ARCHITECT® platform for faster throughput. The two assays were highly correlated, and ARCHITECT® values were converted to iSTAT equivalents using two previously derived equations: iSTAT= −12·36+1·02*ARCHITECT for GFAP (Spearman’s correlation coefficient=0·985) and iSTAT=−3·29+0·72*ARCHITECT for UCH-L1 (Spearman’s correlation coefficient=0·933).22 The i-STAT™ Alinity™ GFAP and UCH-L1 tests use the sandwich enzyme-linked immunosorbent assay (ELISA) method with electrochemical detection of the resulting enzyme signal. The test time for each assay was approximately 15 minutes. The GFAP assay’s calibration range was from 0 to 50,000 pg/mL. The limit of detection (LoD) and limit of quantitation (LoQ) were 15 pg/mL and 25 pg/mL, respectively, resulting in a reportable range of 15 – 50,000 pg/ml. Within-laboratory precision, measured by the coefficient of variation (CV) was 2·8 to 14·2%. The UCH-L1 assay calibration range was 0 – 20,000 pg/mL. The LoD and LoQ were 10 pg/mL and 20 pg/mL, respectively, resulting in a reportable range of 10 – 20,000 pg/mL. The assay had a CV of 5·0–10·0%. Samples with values greater than 50,000 pg/ml were not retested with dilution.
The prototype ARCHITECT® GFAP and UCH-L1 assays are two-step sandwich assays that use a chemiluminescent microparticle immunoassay (CMIA) technology. The prototype GFAP assay calibration range was from 0 to 50,000 pg/mL. The LoD and LoQ were 2 pg/mL and 5 pg/mL, respectively, for a reportable range of 2 to 50,000 pg/mL. The within-laboratory CV was 2·0 to 5·6%. The prototype UCH-L1 assay calibration range was 10 to 25,000 pg/mL. The LoD and LoQ were 10 pg/mL and 20 pg/mL, respectively, for a reportable range of 10 to 25,000 pg/mL. The assay had a CV of 2·0 to 5·7%. All samples were tested neat (without dilution) and in duplicate. Samples with values greater than the calibration range were reported as greater than the reportable range and were not diluted. Technicians performing biomarker measurements were blinded to clinical outcome data.
Statistical analysis
Demographics, clinical characteristics, and biomarkers were summarized for the study cohort and by GCS and GOSE-TBI status. Group comparisons used the Wilcoxon Rank Sum test for the continuous variables and Fisher’s exact test for categorical variables. Biomarker values were not normally distributed and were summarized by reporting medians and their corresponding interquartile range. Log-transformed biomarker levels were used for modeling. Biomarker values that were below the iSTAT’s LoD were analyzed using the reported value; GFAP values above the assay’s upper limit (50,000 pg/ml) were assigned the upper limit. Receiver operating characteristic (ROC) analysis was performed to assess the discriminative ability of day-1 GFAP and UCH-L1 for predicting death (GOSE-TBI=1), unfavorable outcome (GOSE-TBI≤4), and incomplete recovery (GOSE-TBI<8) at 6 months postinjury for TBI cases of all severities, and separately for GCS 3–12 and 13–15 subset. ROC curves were graphed and the area under the receiver operator characteristic curve (AUC) was calculated with its 95% confidence interval. Kaplan-Meier curves were plotted to examine the association between day of injury biomarker level (categorized into quintiles) and time to all-cause mortality in the first 6 months since injury. Since there are no generally accepted biomarker cutoffs to distinguish high levels from low levels, we utilized quintiles to minimize bias. Cox proportional hazards models were performed to assess the association adjusted for potential confounders such as age, sex, and presenting GCS≤12 vs 13–15. The proportional hazards assumptions were met. We also performed logistic regression models to assess whether adding day-of-injury levels of GFAP and UCH-L1 improved the prognostic value of modified IMPACT models for predicting unfavorable outcome (GOSE-TBI≤4) and mortality (GOSE-TBI=1). The IMPACT models were derived in a cohort of GCS 3–12 TBI patients, and therefore the analysis regarding the added prognostic value of biomarkers was restricted to GCS 3–12 TBI patients (n=353). Predictors in the IMPACT Core model are age, GCS motor score, and pupil reactivity. Predictors in the IMPACT Extended model are IMPACT Core + CT variables (subarachnoid hemorrhage, epidural hemorrhage, and Marshall Head CT score), + hypotension, and hypoxia. Predictors in the IMPACT Lab model are IMPACT Extended + Lab variables (glucose and hemoglobin). As per a prior IMPACT model validation study, hypoxia was defined as peripheral oxygen saturation of <90%, and hypotension was defined as systolic blood pressure of <90 mmHg. We added major extracranial injury to the IMPACT models to adjust for this important predictor of outcome and for this reason we refer to the models as modified IMPACT models. Since the IMPACT models were derived to predict outcomes in GCS 3–12 TBI, to determine whether biomarkers add prognostic value to clinical predictors in GCS 13–15 TBI, we utilized the UPFRONT ED model.14 This model was developed to predict incomplete recovery (GOSE-TBI<8) in GCS 13–15 TBI. To our knowledge there are no well validated models for predicting outcomes in GCS 3–8 and GCS 9–12 patients separately. Predictor variables are age (<40, 41–64, 66–90 years), sex, years of education, prior psychiatric history, previous TBI, alcohol intoxication on the day of injury, CT abnormalities, GCS, duration of post-traumatic amnesia (none, ≤=24 or >24 hours) and neck pain. We did not include neck pain as a predictor, since this variable was not collected in our dataset. However, as with the IMPACT models, we included major extracranial injury as a predictor (modified UPFRONT ED). When biomarkers were added to the modified IMPACT and UPFRONT ED models, we adjusted the models for time between injury and blood draw (<9, 9–16 and ≥=17 hours). Missing values in the predictors were imputed using multiple imputation methods.23 Pooled results from multiple imputed datasets were reported. Likelihood ratio tests were performed to examine whether adding the biomarkers improved prediction. Model discrimination (AUC) and Nagelkerke’s pseudo R2 were also reported for each model. Statistical significance was set as a p-value <0·05. Statistical analyses were conducted in R, version 4·1·2 (R Core Team, 2013).
Role of Funding Sources
Abbott Laboratories measured GFAP and UCH-L1 blinded to clinical data but did not contribute to the study design or to data collection, analysis, and interpretation or to writing the manuscript.
Results
A total of 1696 TRACK-TBI participants with GFAP and UCH-L1 measures and 6-month GOSE-TBI scores were studied (see Supplemental Figure 1). The median age of study participants was 39 (IQR: 26 – 56) years. Participants were predominantly male (n=1156, 68·2%) and 960 (56·9%) were injured in a road traffic accident. Detailed demographic and clinical characteristics of the study population categorized by presenting GCS are presented in Table 1. A comparison of the characteristics of those who completed versus did not complete 6-month follow-up is presented in Supplemental Table 1. Males and those of self-reported Hispanic ethnicity were somewhat less likely to complete follow-up assessments. The median time between injury and blood draw was 15·6 (IQR: 9·2 – 20·5, range: 1·1 – 35·6) hours. A histogram of the distribution of the time between injury and blood draw is presented in Supplemental Figure 2. At 6 months postinjury, 1135 (66·9%) had incomplete recovery (GOSE-TBI<8), 235 (13·9%) had an unfavorable outcome (GOSE-TBI≤4), and 120 (7·1%) had died. GCS 13–15 TBI participants constituted 19·6% (46/235) of those who had incomplete recovery at 6 months. Of the 379 GCS 13–15 TBI participants who were discharged home from the ED and the 918 who were hospitalized, 1% (4/379) and 4·6% (42/918) respectively had GOSE-TBI of 1–4 at 6 months. The demographic and clinical characteristics of participants who died and those who recovered fully are presented in Supplemental Table 2.
Table 1:
Demographic and clinical characteristics of study participants
| All Participants | Total (n=1696) | GCS 13–15 (n=1297) | GCS 3–12 (n=353) |
|---|---|---|---|
|
| |||
| The median age in years (IQR) | 39 (26 – 56) | 39 (26 – 56) | 38 (25 – 55) |
|
| |||
| Sex (%) | |||
| • Male | 1156 (68·2%) | 843 (65·0%) | 275 (77·9%) |
| • Female | 540 (31·8%) | 454 (35·0%) | 78 (22·1%) |
|
| |||
| Race (%) | |||
| • White | 1306 (77·8%) | 987 (76·5%) | 278 (80·8%) |
| • Black | 264 (15·7%) | 218 (16·9%) | 43 (12·5%) |
| • Other | 109 (6·5%) | 86 (6·7%) | 23 (6·7%) |
|
| |||
| Ethnicity | |||
| • Non-Hispanic | 1423 (84·8%) | 1101 (85·3%) | 288 (83·7%) |
| • Hispanic | 256 (15·2%) | 190 (14·7%) | 56 (16·3%) |
|
| |||
| Mechanism | |||
| • Road traffic incident | 960 (56·9%) | 726 (56·2%) | 207 (59·1%) |
| • Incidental fall | 465 (27·6%) | 363 (28·1%) | 90 (25·7%) |
| • Violence/assault | 104 (6·2%) | 80 (6·2%) | 21 (6·0%) |
| • Other | 158 (9·4%) | 123 (9·5%) | 32 (9·1%) |
|
| |||
| Prior traumatic brain injury | 503 (30·8%) | 428 (33·5%) | 70 (22·5%) |
|
| |||
| Past psychiatric history | 411 (24·2%) | 319 (24·6%) | 80 (22·7%) |
|
| |||
| Loss of consciousness | |||
| • No | 184 (10·9%) | 172 (13·3%) | 9 (2·6%) |
| • Yes | 1420 (84·4%) | 1058 (81·8%) | 323 (93·6%) |
| • Unknown | 79 (4·7%) | 63 (4·8%) | 13 (3·8%) |
|
| |||
| Post-traumatic amnesia | |||
| • No | 254 (15·1%) | 232 (17·9%) | 16 (4·6%) |
| • Yes | 1191 (70·8%) | 958 (74·1%) | 208 (60·3%) |
| • Unknown | 238 (14·2%) | 103 (8·0%) | 121 (35·1%) |
|
| |||
| Disposition | |||
| • ED discharge | 384 (22·6%) | 379 (29·2%) | 0 (0·0%) |
| • Non-ICU hospital admission | 551 (32·5%) | 543 (41·9%) | 4 (1·1%) |
| • ICU admission | 761 (44·9%) | 375 (28·9%) | 349 (98·9%) |
|
| |||
| Major extracranial injury | 319 (18·8%) | 196 (15·1%) | 110 (31·2%) |
|
| |||
| Marshall Head CT classification | |||
| • 1 | 819 (50·2%) | 790 (62·6%) | 22 (6·8%) |
| • 2 | 579 (35·5%) | 426 (33·7%) | 135 (41·4%) |
| • 3 | 35 (2·2%) | 10 (0·8%) | 24 (7·4%) |
| • 4 | 15 (0·9%) | 3 (0·2%) | 10 (3·1%) |
| • 5 | 170 (10·4%) | 32 (2·5%) | 125 (38·3%) |
| • 6 | 13 (0·8%) | 2 (0·2%) | 10 (3·1%) |
|
| |||
| Traumatic subarachnoid hemorrhage | 596 (36·6%) | 310 (24·6%) | 256 (78·5%) |
|
| |||
| Epidural hemorrhage | 133 (8·2%) | 67 (5·3%) | 57 (17·5%) |
|
| |||
| GCS Motor Score | |||
| • 5/6 | 1388 (83·1%) | 1274 (99·1%) | 100 (28·5%) |
| • 4 | 58 (3·5%) | 3 (0·2%) | 53 (15·1%) |
| • 3 | 22 (1·3%) | 0 (0·0%) | 17 (4·8%) |
| • 2 | 23 (1·4%) | 0 (0·0%) | 23 (6·6%) |
| • 1 | 180 (10·8%) | 9 (0·7%) | 158 (45·0%) |
|
| |||
| Pupillary reaction | |||
| • Both reacting | 1348 (92·2%) | 1107 (99·4%) | 216 (68·8%) |
| • One reacting | 32 (2·2%) | 6 (0·5%) | 25 (8·0%) |
| • None reacting | 82 (5·6%) | 1 (0·1%) | 73 (23·3%) |
|
| |||
| Hypoxia | 79 (4·7%) | 23 (1·8%) | 51 (14·5%) |
|
| |||
| Hypotension | 69 (4·1%) | 25 (1·9%) | 41 (11·6%) |
|
| |||
| Time between injury and blood draw | |||
| • 0–8 hours | 341 (21·1%) | 291 (23·3%) | 46 (14·2%) |
| • 9–16 hours | 496 (30·7%) | 370 (29·7%) | 110 (34·1%) |
| • ≥17 hours | 777 (48·1%) | 586 (47·0%) | 167 (51·7%) |
For the entire cohort, the number of patients with missing values for demographic and clinical variables are noted in parenthesis: Age (0), Sex (0), Race (17), Ethnicity (17), Mechanism (9), Prior TBI (65), Past Psychiatric history (0), Loss of Consciousness (13), Post-traumatic amnesia (13), Glasgow Coma Scale (46), Disposition (0), Major extracranial injury (0), Marshall CT classification (65), SAH (66), EDH (67), GCS Motor Score (25), Pupil Reaction (234), Hypoxia (0), Hypotension (0), Time between injury and blood draw (82)
Except for 139 (8·2%) and 194 (11·4%) participants with GFAP levels below the LOD and LOQ respectively and 2 (0·1%) and 9 (0·5%) participants with UCH-L1 below the LOD and LOQ respectively, all other participants had detectable biomarker levels. Day-of-injury GFAP values were higher in participants who died during the 6-month follow-up period (median: 8680 [IQR: 2525 – 23237]) pg/ml and in those with a 6-month GOSE-TBI of 2–4 (median: 3998 [IQR: 1197 – 8932]) pg/ml than in those with a 6-month GOSE-TBI of 5–8 (median: 356 [IQR: 88·3 – 1242]), p<0·001 (Figure 1A). Similarly, UCH-L1 values were higher in participants who died during the 6-month follow-up period (median: 1616 [IQR: 771 – 3083]) pg/ml and in those with a 6-month GOSE-TBI of 2–4 (median: 833 [IQR: 389 – 1453]) pg/ml than in those with a 6-month GOSE-TBI of 5–8 (median: 194 [IQR: 99 – 390]) pg/ml, p<0·001(Figure 1B). These differences in biomarker values by GOSE-TBI category were more pronounced in participants with GCS 3–12 than those with GCS 13–15. Participants with biomarker values in the highest quintile had a higher risk for all-cause mortality during the 6-months following injury than those with biomarker values in lower quintiles (Figure 2). The range of biomarker values corresponding to each biomarker quintile is described in (Supplemental Table 3). After adjusting for age, sex and presenting GCS as a continuous variable, the hazards for all-cause mortality within 6 months for participants with a day-of-injury biomarker level in the fifth quintile remained significantly higher than the hazards for those with biomarker values in the first quintile (Hazard ratios are 6·98 (95% CI: 1·60 – 30·40), p=0·010 and 22·38 (95% CI: 2·99 – 167.46), p=0·0020 for GFAP and UCH-L1 in the fifth quintile, respectively). The fifth quintile hazards were much higher in participants with a presenting GCS of 3–12 than in the entire cohort (Supplemental Table 4).
Figure 1: The distribution of day-of-injury biomarker levels by 6-month clinical outcome.
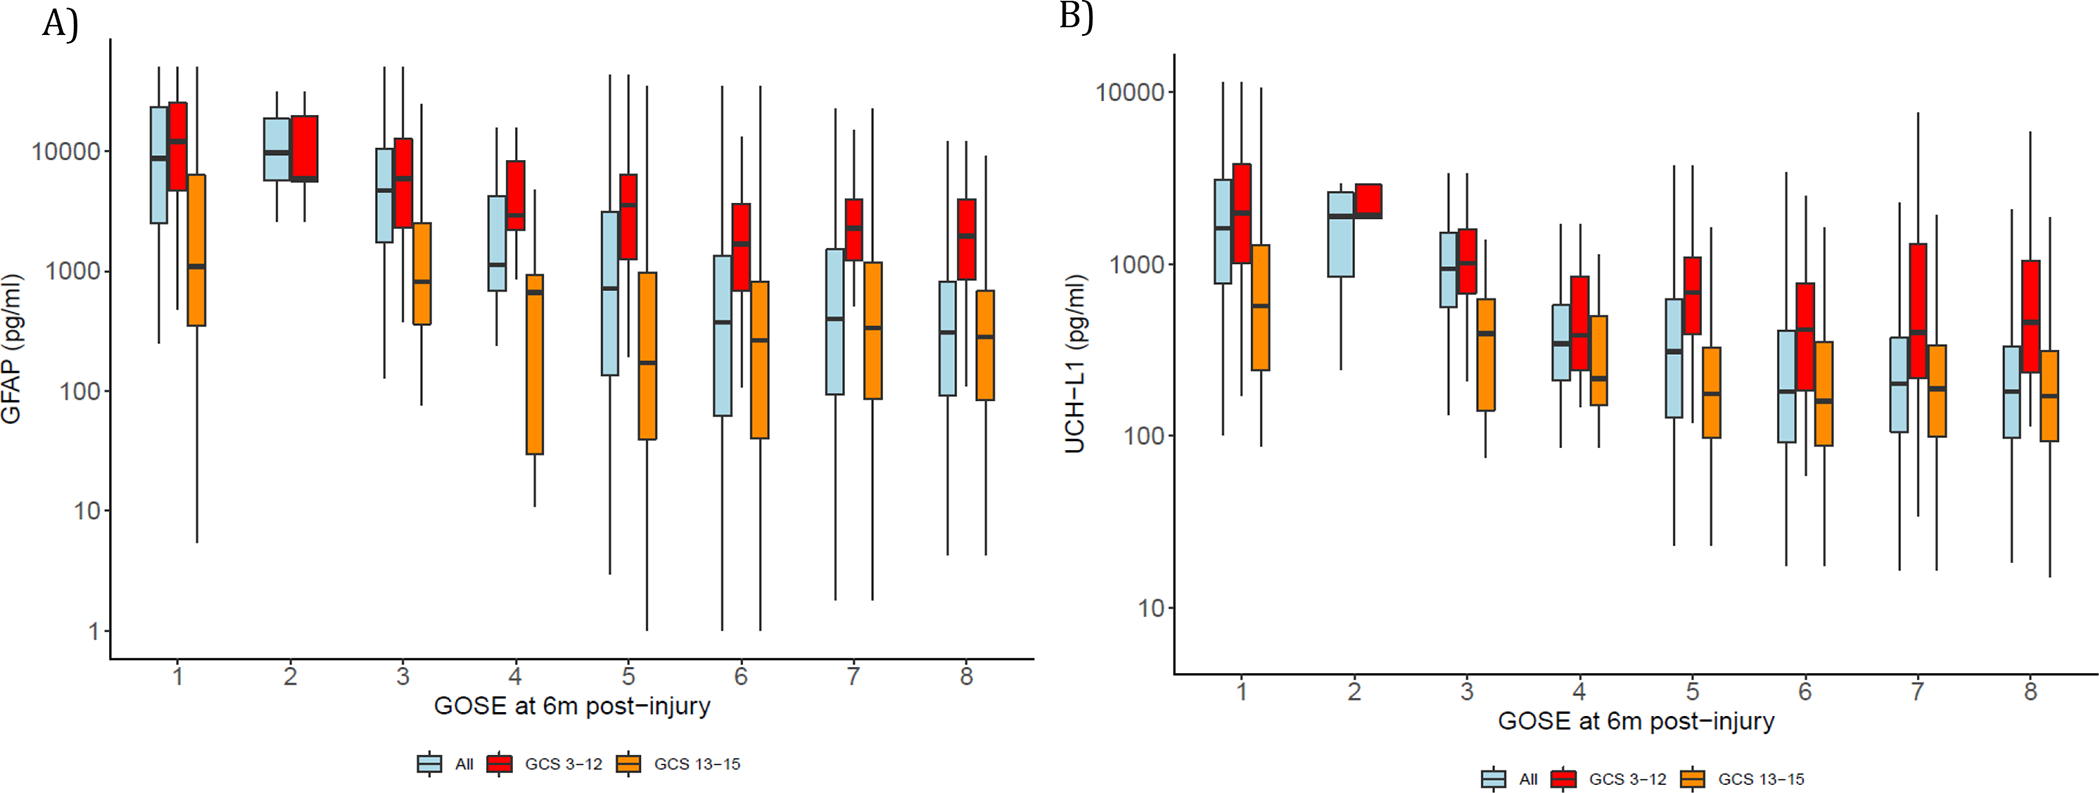
Legend: Figures 1A and B displays box plots of GFAP and UCH-L1 levels (in log10 scale) by 6-month GOSE-TBI in the overall cohort and separately for GCS 3–12 and 13–15 cohort. The lower and upper ends of each box represent the 25th and 75th percentile; the line going through each box represents the median value. Upper whisker indicates the smaller value of: the maximum value or 75th percentile +1·5*IQR, and lower whisker indicates the larger value of: the minimum value or 25th percentile −1·5*IQR. The Y-axis is marked in the raw scale. Participants with a 6-month GOSE-TBI of 1, 2 and 3 had the highest biomarker levels. In general biomarker values were higher in GCS 3–12 participants and in those with lower 6-month GOSE-TBI.
Figure 2: The association between day-of-injury biomarker levels and time to death in the first 6-months following TBI.

Legend: Kaplan-Meier plots of the association between day of injury GFAP and UCH-L1 and all-cause mortality during the first 6-months following injury. Biomarker values are presented in quintiles. The association between GFAP and all-cause mortality in participants with initial GCS of 3–15, and 3–12 are presented in Figures 2A, and C respectively. The association between UCH-L1 and all-cause mortality in participants with initial GCS of 3–15 and 3–12 are presented in Figures 2B and D respectively. Shaded area indicates the 95% confidence bands; tick marks indicate censoring (death). In GCS 3–12 participants the risk of death was highest for biomarker values in the fifth quintile. The number of GCS 13–15 participants who died is very small and therefore we did not perform a survival analysis for this group. The range of biomarker values corresponding to each biomarker quintile has been described in Supplemental Table 2.
Among all participants studied (GCS 3–15), the AUC for distinguishing between those who died within 6 months from those who survived was 0·87 (95% CI: 0·83 – 0·91) for day-of-injury GFAP, 0·89 (95% CI: 0·86 – 0·92) for day-of-injury UCH-L1, and 0·91 (95% CI: 0·87 – 0·94) for combined GFAP and UCH-L1 values. The AUC for distinguishing between participants with unfavorable versus favorable 6-month outcome was 0·86 (95% CI: 0·83 – 0·89) for day-of-injury GFAP, 0·86 (95% CI: 0·84 – 0·89) for day-of-injury UCH-L1, and 0·89 (95% CI: 0·86 – 0·91) for combined GFAP and UCH-L1 values. The AUC for distinguishing between participants with incomplete recovery versus complete recovery at 6 months was 0·62 (95% CI: 0·59 – 0·64) for day-of-injury GFAP; 0·61 (95% CI: 0·59 – 0·64) for day-of-injury UCH-L1 and 0·62 (95% CI: 0·60 – 0·65) for combined GFAP and UCH-L1 values (Table 2). For each of the outcomes examined, the AUC of GFAP and UCH-L1 combined was not significantly higher than the AUC of each biomarker independently. In general, these AUCs were higher for participants with a presenting GCS of 3–12 than those with a presenting GCS of 13–15. Graphs of the corresponding receiver operating characteristic (ROC) curves are presented in Supplemental Figure 3. For each of the outcomes examined, the AUCs for biomarkers measured with the Abbott ARCHITECT platform were higher than the AUCs for biomarkers measured with the Abbott iSTAT platform (Supplemental Table 5), however, these data must be interpreted with caution since the different platforms were used to measure biomarker values in different subsets of the study population.
Table 2:
The prognostic value of GFAP and UCH-L1 for predicting 6-month outcomes in different subgroups of presenting injury severity
| GCS 3–15 AUC (95% CI) | GCS 13–15 AUC (95% CI) | GCS 3–12 AUC (95% CI) | |
|---|---|---|---|
| Predicting Incomplete Recovery (GOSE-TBI 1–7 versus 8) | |||
| • GFAP | 0·62 (0·59 – 0·64) | 0·53 (0·50 – 0·56) | 0·68 (0·61 – 0·76) |
| • UCH-L1 | 0·61 (0·59 – 0·64) | 0·53 (0·50 – 0·56) | 0·65 (0·56 – 0·74) |
| • GFAP + UCH-L1 | 0·62 (0·60 – 0·65) | 0·53 (0·50 – 0·56) | 0·70 (0·63 – 0·76) |
| Predicting Unfavorable Outcome (GOSE-TBI 1–4 versus 5 – 8) | |||
| • GFAP | 0·86 (0·83 – 0·89) | 0·67 (0·58 – 0·76) | 0·77 (0·73 – 0·83) |
| • UCH-L1 | 0·86 (0·84 – 0·89) | 0·70 (0·62 – 0·79) | 0·76 (0·71 – 0·81) |
| • GFAP + UCH-L1 | 0·89 (0·86 – 0·91) | 0·72 (0·64 – 0·80) | 0·81 (0·77 – 0·86) |
| Predicting Mortality (GOSE-TBI = 1 versus 2 – 8) | |||
| • GFAP | 0·87 (0·83 – 0·91) | 0·72 (0·60 – 0·84) | 0·79 (0·73 – 0·85) |
| • UCH-L1 | 0·89 (0·86 – 0·92) | 0·77 (0·66 – 0·88) | 0·81 (0·76 – 0·86) |
| • GFAP + UCH-L1 | 0·90 (0·87 – 0·94) | 0·78 (0·66 – 0·89) | 0·84 (0·80 – 0·89) |
For each GCS category and each outcome grouping, the AUCs of GFAP+UCH-L1, GFAP only and UCH-L1 were statistically similar.
Among GCS 3–12 TBI participants, GFAP only, UCH-L1 only and GFAP and UCH-L1 all increased the prognostic accuracies of the modified IMPACT Core, IMPACT Extended and IMPACT Lab models significantly. The AUC of the modified IMPACT Lab model increased from 0·85 (95% CI: 0·80 – 0·88) to 0·89 (95% CI: 0·85 – 0·92) for predicting unfavorable outcome, from 0·9 (95% CI: 0·85 – 0·93) to 0· 94 (95% CI: 0·91 – 0·96) for predicting death, with the addition of GFAP and UCH-L1 (Table 3).
Table 3:
The Prognostic Value of the Modified IMPACT (GCS 3–12) and UPFRONT ED (GCS 13–15) Models with and without GFAP and UCH-L1
| AUC (95% CI) for GOSE-TBI 1–4 vs 5–8 | R2 | LRT p-value | AUC p-value | AUC (95% CI) for GOSE-TBI 1 vs 2–8 | R2 | LRT p-Value | AUC p-Value | |
|
| ||||||||
| Modified IMPACT Core (GCS 3–12) | ||||||||
| • Without GFAP or UCH-L1 | 0·78 (0·73 – 0·83) | 0·31 | 0·85 (0·80 – 0·89) | 0·42 | ||||
| • With GFAP only | 0·85 (0·81 – 0·89) | 0·49 | <0·0010 | <0·0010 | 0·90 (0·86 – 0·93) | 0·56 | <0·0010 | 0·0010 |
| • With UCH-L1 only | 0·83 (0·79 – 0·87) | 0·43 | <0·0010 | 0·0020 | 0·92 (0·88 – 0·94) | 0·59 | <0·0010 | <0·0010 |
| • With GFAP + UCH-L1 | 0·86 (0·82 – 0·90) | 0·50 | <0·0010 | <0·0010 | 0·92 (0·88 – 0·95) | 0·61 | <0·0010 | <0·0010 |
| 0·012 | 0·095 | <0·0010 | 0·031 | |||||
| <0·0010 | 0·011 | <0·0060 | 0·20 | |||||
|
| ||||||||
| Modified IMPACT Extended (GCS 3–12) | ||||||||
| • Without GFAP or UCH-L1 | 0·84 (0·79 – 0·88) | 0·44 | 0·90 (0·85 – 0·93) | 0·54 | ||||
| • With GFAP only | 0·89 (0·85 – 0·92) | 0·56 | <0·0010 | <0·0010 | 0·93 (0·89 – 0·96) | 0·64 | <0·0010 | 0·010 |
| • With UCH-L1 only | 0·86 (0·82 – 0·90) | 0·50 | <0·0010 | 0·033 | 0·94 (0·90 – 0·96) | 0·66 | <0·0010 | 0·0020 |
| • With GFAP + UCH-L1 | 0·89 (0·85 – 0·92) | 0·56 | <0·0010 | <0·0010 | 0·94 (0·90 – 0·96) | 0·68 | <0·0010 | 0·0020 |
| 0·32 | 0·54 | <0·0010 | 0·10 | |||||
| <0·0010 | 0·0060 | <0·0020 | 0·33 | |||||
|
| ||||||||
| Modified IMPACT Lab (GCS 3–12) | ||||||||
| • Without GFAP or UCH-L1 | 0·84 (0·80 – 0·88) | 0·50 | 0·90 (0·85 – 0·93) | 0·54 | ||||
| • With GFAP only | 0·89 (0·85 – 0·92) | 0·57 | <0·0010 | 0·0010 | 0·93 (0·89 – 0·96) | 0·65 | <0·0010 | 0·011 |
| • With UCH-L1 only | 0·87 (0·82 – 0·90) | 0·51 | <0 0010 | 0·030 | 0·94 (0·90 – 0·96) | 0·66 | <0·0010 | 0·0020 |
| • With GFAP + UCH-L1 | 0·89 (0·85 – 0·92) | 0·57 | <0·0010 | 0·0010 | 0·94 (0·91 – 0·96) | 0·68 | <0·0010 | 0·0020 |
| 0·29 | 0·43 | <0·0010 | 0·10 | |||||
| <0·0010 | 0·0070 | 0·0040 | 0·32 | |||||
|
| ||||||||
| AUC (95% CI) for GOSE-TBI <8 vs 8 | R2 | LRT p-value | AUC p-Value | |||||
|
| ||||||||
| Modified UPFRONT ED (GCS 13–15) for predicting GOSE-TBI<8 versus GOSE-TBI=8 | ||||||||
| • Without GFAP or UCH-L1 | 0·67 (0·64 – 0·70) | 0·12 | ||||||
| • With GFAP only | 0·69 (0·66 – 0·72) | 0·14 | <0·0010 | 0·044 | ||||
| • With UCH-L1 only | 0·69 (0·66 – 0·72) | 0·14 | <0·0010 | 0·051 | ||||
| • With GFAP + UCH-L1 | 0·69 (0·66 – 0·72) | 0·14 | <0·0010 | 0·025 | ||||
| 0·0040 | 0·32 | |||||||
| 0·029 | 0·30 | |||||||
Variables used in the Modified IMPACT and UPFRONT ED Models
Modified IMPACT Core: Age, GCS motor score, Pupil reactivity, Major Extracranial Injury
Modified IMPACT Extended: Age GCS motor score, Pupil reactivity, Subarachnoid hemorrhage, Epidural hemorrhage, Marshall Head CT score, Hypotension, Hypoxia, Major Extracranial Injury
Modified IMPACT Lab: Age GCS motor score, Pupil reactivity, Subarachnoid hemorrhage, Epidural hemorrhage, Marshall Head CT score, Hypotension, Hypoxia, Glucose, Hemoglobin, Major Extracranial Injury
Modified UPFRONT ED: Age, Sex, Education, Prior Psychiatric History, Previous TBI, Alcohol Intoxication, CT abnormalities, GCS, Duration of Post-traumatic Amnesia, Major Extracranial Injury
The time between injury and blood sampling was included as a predictor in models with biomarker values·
The Likelihood Ratio Test (LRT) compared the models with and without the biomarkers· There are three p-values for the LRT and for the comparing AUCs (AUC p-Value) and they are presented in the following order:
• First: Model with GFAP + UCH-L1 versus model without biomarkers
• Second: Model with GFAP + UCH-L1 versus model with GFAP only
• Third: Model with GFAP + UCH-L1 versus model with UCH-L1 only
For rows with only one p-Value, p-Value refers to a comparison between models without GFAP or UCH-L1 and models with the biomarker corresponding to that row·
R2 refers to Nagelkerke’s R2
Among GCS 13–15 participants, GFAP only, UCH-L1 only and GFAP and UCH-L1 all increased the prognostic value of the modified UPFRONT ED model modestly, from 0·67 (95% CI: 0·64 – 0·70) without biomarkers to 0·69 (95% CI: 0·66 – 0·72) with the addition of GFAP and UCH-L1 (Table 3). A detailed report of the models with and without biomarker values is presented in Supplemental Tables 6–8.
Discussion
Early and accurate prediction of TBI outcomes is important for guiding clinical care decisions, counseling patients and families, and for risk-adjusted outcomes analyses in clinical trials. Our study reports three key findings. First, day-of-injury GFAP and UCH-L1 levels predict unfavorable outcome (GOSE-TBI≤4) and death (GOSE-TBI=1) at 6 months with good to excellent discriminative ability. However, they do not accurately predict incomplete recovery (GOSE-TBI<8). The risk prediction ability of these biomarkers is modest in GCS 13–15 TBI but much stronger in GCS 3–12 TBI. The risk of death during the 6 months that follow TBI is highest in those with biomarker levels in the fifth quintile with most of the deaths occurring during the first month. Second, day-of-injury GFAP and UCH-L1 levels significantly increase the prognostic value of the suite of IMPACT models for predicting outcomes in GCS 3–12 TBI, however they only modestly increase the prognostic value of the UPFRONT ED model for predicting incomplete recovery in GCS 13–15 TBI. Third, when we examined biomarkers only, we found no significant difference between the AUC of GFAP and UCH-L1 combined versus the AUC of either biomarker alone. When we examined the incremental prognostic value of biomarkers over clinical predictors alone for predicting mortality, we found that based on the likelihood ratio test, both biomarkers are independent predictors and they improved model fit, however there was no difference in the AUC of models with both biomarkers versus models with one biomarker. Similarly, for predicting unfavorable outcome adding UCH-L1 to GFAP to the IMPACT models did not improve the AUC of the IMPACT + GFAP only models. Similarly, there was no difference in the AUC of the UPFRONT ED model + both biomarkers versus the UPFRONT ED model + one biomarker. It is possible that other biomarkers of neurodegeneration such as Neurofilament light chain and Total Tau may be useful in predicting outcomes in GCS 13–15 TBI.
Our findings regarding the prognostic value of day-of-injury GFAP and UCH-L1 corroborate and extend findings from previous smaller studies. In a study of 172 patients with predominantly severe TBI (70%), day-of-injury GFAP, and UCH-L1 were found to be associated with 12-month outcomes measured by the Glasgow Outcome Scale (pseudo-R2 0·217 and 0·271, respectively).24 In another study of 267 participants in a placebo-controlled clinical trial of progesterone in moderate and severe TBI, the unadjusted odds of having an unfavorable outcome at 6 months (GOSE-TBI 1–4) per pg/ml change in biomarker was 1·75 (95% CI: 1·51 – 2·03) for GFAP and 2·20 (95% CI: 1·63 – 2·99) per pg/ml for UCH-L1.25 Further, among 243 participants in the placebo arm of a clinical trial of Tranexamic acid with an initial GCS of 3–12, the AUC of day-of-injury GFAP and UCH-L1 levels for predicting GOSE-TBI≤4 at 6 months were 0·71 (95% CI: 0·61 – 0·81) and 0·68 (95% CI: 0·57 – 0·80), respectively.26 In the TRACK-TBI Pilot study of 206 subjects, we reported that the AUC of day-of-injury GFAP and UCH-L1 levels for predicting GOSE-TBI ≤4 at 6 months were 0·76 (95% CI: 0·60–0·91) and 0·74 (95% CI: 0·61–·87), respectively.11 As a consequence of the larger sample size, our estimates of the prognostic value of GFAP and UCH-L1 have greater precision (narrower confidence intervals) than prior estimates. However, the lack of a statistically significant increase in prognostic value by combining GFAP and UCH-L1 differs from our smaller TRACK-TBI Pilot study.11
Our study results demonstrate that structural brain injury detected by biofluid-based biomarkers of brain injury is an important independent predictor of unfavorable outcome, including death following TBI, especially in patients with a presenting GCS of 3–12. However, it is not as good a predictor of incomplete recovery (GOSE-TBI<8). Prior studies have demonstrated that psychological factors such as emotional distress and maladaptive coping, pre-injury mental health problems, education, and older age are important predictors of incomplete recovery in TBI patients with GCS 13–15.14 Structural brain injury detected by CT and MRI has been previously reported as an independent predictor of risk of incomplete recovery in GCS 13–15 TBI.4,5 Therefore, although structural brain injury measured by GFAP and UCH-L1 may play a predominant role in determining poor outcome of GCS 3–12 TBI, its role in predicting the outcome of GCS 13–15 TBI is not yet fully understood. The poor prognostic performance of these biomarkers for predicting incomplete recovery in this latter group may be partly attributed to the potential ceiling effect of the GOSE-TBI in the GCS 13–15 TBI population.
For GCS 3–12 TBI, adding day-of-injury GFAP and UCH-L1 levels to the IMPACT models increases the prognostic accuracy of these models significantly. This finding is important and has implications for both TBI research and clinical care. Accounting for the baseline prognosis (pre-intervention) is critical to attaining sufficient statistical power without cost-prohibitive sample sizes, especially in Phase III TBI trials.27 In TBI clinical trials where the GOSE-TBI is analyzed using a sliding dichotomy, the IMPACT model is often used to determine baseline prognosis.28,29 Improving the prognostic value of the IMPACT model by adding GFAP and UCH-L1 values may improve the efficiency of clinical trials. A larger scale validation of the IMPACT+GFAP+UCH-L1 model is needed so that ultimately, clinicians may be able to use this tool to provide a more accurate prognosis to patients and their family members.
Our study has several limitations. We focused primarily on functional recovery as measured by the GOSE-TBI and therefore we cannot determine whether GFAP and UCH-L1 have prognostic value for predicting other outcomes, such as cognition and mental health. Furthermore, our study population consisted of adult patients seen at U.S. level I trauma centers, who were sampled conveniently and may have been medically healthier than the general population (patients with certain comorbidities were excluded). We also excluded patients with significant polytrauma that would interfere with follow-up. Additionally, approximately 30% of our cohort reported prior TBI, based on patient/representative’s self-report. Thus, it is unknown whether our findings are applicable to pediatric patients or to patients outside the level I trauma setting, or in those who would not meet study inclusion/exclusion criteria. Additionally, small amounts of GFAP and UCH-L1 may be released from extracranial sources, including orthopedic injury.30 Although the two different assays we utilized were highly correlated, using different assays could have an influence on the precision in biomarker values reported. Also, the variability in sampling times of blood draws could have influenced the prognostic value of these biomarkers. We converted biomarker values from the Abbott ARCHITECT to iSTAT equivalents; this conversion could have introduced a measurement error to our analyses. Finally, several patients were lost to follow-up at 6-months, and therefore the participants analyzed are different from those enrolled on some of the covariates examined (Supplemental Table 1).
Conclusion
Day-of-injury GFAP and UCH-L1 levels have good to excellent prognostic value for predicting death (GOSE-TBI=1) and unfavorable outcome at 6 months, but not for incomplete recovery. Further, for those presenting with TBI GCS 3–12, day-of-injury GFAP and UCH-L1 improve the prognostic value of the IMPACT models significantly. However, for GCS 13–15 TBI, these biomarkers improved the value of the UPFRONT ED only modestly. Therefore, in addition to their known diagnostic value, day-of-injury GFAP and UCH-L1 levels, in conjunction with the IMPACT models, may provide a more accurate appraisal of the likelihood of unfavorable outcome, including death, following GCS 3–12 TBI. Additional studies are needed to evaluate the reproducibility of these findings prior to broad clinical adoption.
Supplementary Material
Research in context.
Evidence before this study
We conducted a PubMed search for studies examining the prognostic value of plasma Glial Fibrillary Acidic Protein (GFAP) and Ubiquitin carboxy-terminal Hydrolase L1 (UCH-L1) in patients with traumatic brain injury (TBI) published in English from April 2004 up to April 8, 2022, with the search terms ((glial fibrillary acidic protein) OR (ubiquitin carboxy-terminal hydrolase)) AND traumatic brain injury AND prognosis Filters: Humans in the publication title or abstract. 51 studies were retrieved and 10 were prospective observational studies of more than 50 participants and they examined the association between GFAP and UCH-L1 and clinical outcome (global functional recovery measured by the Glasgow Outcome Scale Extended and/or all-cause mortality). We also identified one systematic review that included studies meeting our selection criteria. These studies have consistently found higher levels of GFAP and UCH-L1 in subjects with poor clinical outcome compared to those with good clinical outcome. A few studies investigated whether these biomarkers contribute additional prognostic information to existing prognostic models.
Added value of this study
This study contributes new knowledge to the literature on the prognostic value of GFAP and UCH-L1 in acute TBI. We used a CE-marked and US Food and Drug Administration cleared assay. Our large sample size enabled us to estimate the prognostic value of GFAP and UCH-L1 for predicting death, incomplete recovery (Glasgow Outcome Scale Extended, GOSE-TBI<8), and unfavorable outcome (GOSE-TBI≤4) with high precision. This is also the first study to examine the association between brain injury biomarker levels and all-cause mortality following TBI, using a time-to-event analysis. Our study also investigated the added prognostic contribution of GFAP and UCH-L1 to existing prognostic models (the International Mission for Prognosis and Analysis of Clinical Trials in TBI (IMPACT) Core and IMPACT Extended models for GCS 3–12 TBI and the UPFRONT ED model for GCS 13–15 TBI).
Implications of all the available evidence
Our findings, which are corroborated by findings from prior smaller studies, suggest that day-of-injury plasma concentrations of GFAP and UCH-L1 provide information regarding a patient’s 6-month risk of death and unfavorable outcome, but not incomplete recovery. Furthermore, in those presenting with GCS 3–12 TBI, incorporating GFAP and UCH-L1 values into the IMPACT models increases the prognostic value of these models significantly. However, these biomarkers only modestly increased the prognostic value of the UPFRONT ED model for predicting incomplete recovery in GCS 13–15 TBI. Therefore, GFAP and UCH-L1 values may improve outcome prognostication, especially for GCS 3–12 TBI, enabling clinicians and researchers to provide a more accurate assessment of the expected course of recovery.
Acknowledgement:
TRACK-TBI is sponsored by the U.S. National Institutes of Health, National Institute of Neurologic Disorders and Stroke (Grant # U01 NS1365885), US Department of Defense; Abbott Laboratories, One Mind. Abbott Laboratories is supported by the US Army Medical Research and Development Command, 810 Schreider St. Fort Detrick, MD 21702, Contract # W81XWH-17-C-0079. Abbott analyzed blood samples in their lab. However, they did not contribute to the data analysis or data interpretation. Additionally, they did not play a role in drafting or reviewing the manuscript.
Footnotes
And the TRACK-TBI Study Investigators
Additional TRACK-TBI Study Investigators to be listed in supplemental material and indexed on PubMed.
| First Name | Last Name |
|---|---|
| Opeolu | Adeoye |
| Neeraj | Badatjia |
| Ann-Christine | Duhaime |
| Adam | Ferguson |
| Brandon | Foreman |
| Joseph T | Giacino |
| Shankar | Gopinath |
| Ramesh | Grandhi |
| Ryan | Kitagawa |
| Christopher | Madden |
| Randall | Merchant |
| Mike | McCrea |
| Pratik | Mukherjee |
| Laura | Ngwenya |
| Miri | Rabinowitz |
| Claudia | Robertson |
| David | Schnyer |
| Murray | Stein |
| Sabrina R | Taylor |
| Mary | Vassar |
| Vincent | Wang |
| Alex | Valadka |
| Ross | Zafonte |
Declaration of Interests:
FKK consulted for Abbott Laboratories previously. FKK and CR and has received research funding from Abbott Laboratories. GM received research funding from a collaboration between Abbott Laboratories and the DoD. RDA consulted for MesoScalre Discoveries, BrainBox Solutions, Inc and NovaSignal Inc.
ClinicalTrials.gov Identifier: NCT02119182
Publisher's Disclaimer: This is a PDF file of an unedited manuscript that has been accepted for publication. As a service to our customers we are providing this early version of the manuscript. The manuscript will undergo copyediting, typesetting, and review of the resulting proof before it is published in its final form. Please note that during the production process errors may be discovered which could affect the content, and all legal disclaimers that apply to the journal pertain.
Contributor Information
Frederick K. Korley, Department of Emergency Medicine, University of Michigan, 1500 East Medical Center Drive, Ann Arbor, MI, 48109.
Prof. Sonia Jain, University of California, San Diego, Herbert Wertheim School of Public Health and Human Longevity Science, 9500 Gilman Drive, La Jolla, California 92093,.
Xiaoying Sun, University of California, San Diego, Herbert Wertheim School of Public Health and Human Longevity Science, 9500 Gilman Drive, La Jolla, California 92093.
Ava M. Puccio, Department of Neurological Surgery, University of Pittsburgh Medical Center, 200 Lothrop Street, Suite B-400, Pittsburgh, PA 15213.
John K. Yue, Department of Neurological Surgery, University of California, San Francisco, 1001 Potrero Avenue, Bldg 1, Rm 101, San Francisco, CA 94110.
Raquel C. Gardner, Department of Neurology, Memory and Aging Center, and Weill Institute for Neurosciences, University of California San Francisco, 4150 Clement St. Neurology 127, San Francisco, CA 94121.
Prof. Kevin K. W. Wang, Program for Neurotrauma, Neuroproteomics & Biomarkers Research (NNBR), Department of Emergency Medicine, McKnight Brain Institute, University of Florida, Gainesville, FL 32611-32611-0256.
Prof. David O. Okonkwo, Department of Neurological Surgery, University of Pittsburgh Medical Center, 200 Lothrop Street, Suite B-400, Pittsburgh, PA 15213.
Prof. Esther L. Yuh, Department of Radiology, University of California, San Francisco, 185 Berry Street, Suite 350, San Francisco, CA 94107.
Prof. Pratik Mukherjee, Department of Radiology, University of California, San Francisco, 185 Berry Street, Suite 350, San Francisco, CA 94107.
Lindsay D. Nelson, Departments of Neurosurgery & Neurology, 8701 West Watertown Plank Road, Medical College of Wisconsin.
Sabrina R. Taylor, Brain and Spinal Injury Center, University of California, San Francisco, 1001 Potrero Avenue, Bldg. 1 Rm 101, Box 0899, San Francisco, CA 9414.
Amy J. Markowitz, Department of Neurological Surgery, University of California, San Francisco, 1001 Potrero Avenue, Building 1, Room 101, San Francisco, CA 94110.
Prof. Ramon Diaz-Arrastia, Department of Neurology, University of Pennsylvania, Director of Traumatic Brain Injury Clinical Research Center, Penn Presbyterian Medical Center, 51 North 39th Street, Philadelphia, PA 19104.
Prof. Geoffrey T. Manley, Department of Neurological Surgery, University of California, San Francisco, 1001 Potrero Avenue, Building 1, Room 101, San Francisco, CA 94110.
Data Sharing
The de-identified patient level data that support the findings of this study are available and will be made publicly available on the Federal Interagency Traumatic Brain Injury Research (FITBIR) Informatics System following deadlines agreed upon with federal funding partners.
References
- 1.Maas AIR, Lingsma HF, Roozenbeek B. Predicting outcome after traumatic brain injury. Handb Clin Neurol 2015; 128: 455–74. [DOI] [PubMed] [Google Scholar]
- 2.Yuh EL, Jain S, Sun X, et al. Pathological Computed Tomography Features Associated With Adverse Outcomes After Mild Traumatic Brain Injury: A TRACK-TBI Study With External Validation in CENTER-TBI. JAMA Neurol 2021; published online July 19. DOI: 10.1001/jamaneurol.2021.2120. [DOI] [PMC free article] [PubMed] [Google Scholar]
- 3.Maas AIR, Hukkelhoven CWPM, Marshall LF, Steyerberg EW. Prediction of outcome in traumatic brain injury with computed tomographic characteristics: a comparison between the computed tomographic classification and combinations of computed tomographic predictors. Neurosurgery 2005; 57: 1173–82; discussion 1173–82. [DOI] [PubMed] [Google Scholar]
- 4.Yuh EL, Mukherjee P, Lingsma HF, et al. Magnetic resonance imaging improves 3-month outcome prediction in mild traumatic brain injury. Ann Neurol 2013; 73: 224–35. [DOI] [PMC free article] [PubMed] [Google Scholar]
- 5.Yuh EL, Cooper SR, Mukherjee P, et al. Diffusion tensor imaging for outcome prediction in mild traumatic brain injury: a TRACK-TBI study. J Neurotrauma 2014; 31: 1457–77. [DOI] [PMC free article] [PubMed] [Google Scholar]
- 6.Bazarian JJ, Biberthaler P, Welch RD, et al. Serum GFAP and UCH-L1 for prediction of absence of intracranial injuries on head CT (ALERT-TBI): a multicentre observational study. Lancet Neurol 2018; 17: 782–9. [DOI] [PubMed] [Google Scholar]
- 7.Okonkwo DO, Puffer RC, Puccio AM, et al. Point-of-Care Platform Blood Biomarker Testing of Glial Fibrillary Acidic Protein versus S100 Calcium-Binding Protein B for Prediction of Traumatic Brain Injuries: A Transforming Research and Clinical Knowledge in Traumatic Brain Injury Study. J Neurotrauma 2020; 37: 2460–7. [DOI] [PMC free article] [PubMed] [Google Scholar]
- 8.Yue JK, Yuh EL, Korley FK, et al. Association between plasma GFAP concentrations and MRI abnormalities in patients with CT-negative traumatic brain injury in the TRACK-TBI cohort: a prospective multicentre study. Lancet Neurol 2019; 18: 953–61. [DOI] [PubMed] [Google Scholar]
- 9.Papa L, Brophy GM, Welch RD, et al. Time Course and Diagnostic Accuracy of Glial and Neuronal Blood Biomarkers GFAP and UCH-L1 in a Large Cohort of Trauma Patients With and Without Mild Traumatic Brain Injury. JAMA Neurol 2016; 73: 551–60. [DOI] [PMC free article] [PubMed] [Google Scholar]
- 10.U.S. Food & Drug Administration. FDA authorizes marketing of first blood test to aid in the evaluation of concussion in adults. U.S. Food & Drug Administration. 2018; published online Feb 15. https://www.fda.gov/news-events/press-announcements/fda-authorizes-marketing-first-blood-test-aid-evaluation-concussion-adults (accessed May 26, 2021). [Google Scholar]
- 11.Diaz-Arrastia R, Wang KKW, Papa L, et al. Acute biomarkers of traumatic brain injury: relationship between plasma levels of ubiquitin C-terminal hydrolase-L1 and glial fibrillary acidic protein. J Neurotrauma 2014; 31: 19–25. [DOI] [PMC free article] [PubMed] [Google Scholar]
- 12.Wang KKW, Kobeissy FH, Shakkour Z, Tyndall JA. Thorough overview of ubiquitin C-terminal hydrolase-L1 and glial fibrillary acidic protein as tandem biomarkers recently cleared by US Food and Drug Administration for the evaluation of intracranial injuries among patients with traumatic brain injury. Acute Med Surg 2021; 8: e622. [DOI] [PMC free article] [PubMed] [Google Scholar]
- 13.Steyerberg EW, Mushkudiani N, Perel P, et al. Predicting outcome after traumatic brain injury: development and international validation of prognostic scores based on admission characteristics. PLoS Med 2008; 5: e165; discussion e165. [DOI] [PMC free article] [PubMed] [Google Scholar]
- 14.van der Naalt J, Timmerman ME, de Koning ME, et al. Early predictors of outcome after mild traumatic brain injury (UPFRONT): an observational cohort study. Lancet Neurol 2017; 16: 532–40. [DOI] [PubMed] [Google Scholar]
- 15.Nelson LD, Temkin NR, Dikmen S, et al. Recovery After Mild Traumatic Brain Injury in Patients Presenting to US Level I Trauma Centers: A Transforming Research and Clinical Knowledge in Traumatic Brain Injury (TRACK-TBI) Study. JAMA Neurol 2019; 76: 1049–59. [DOI] [PMC free article] [PubMed] [Google Scholar]
- 16.Kay T, Harrington D, Adams R, Andersen T, Berrol S, Cicerone K. Definition of mild traumatic brain injury. J Head Trauma Rehabil 1993; 8: 86–7. [Google Scholar]
- 17.Yue JK, Vassar MJ, Lingsma HF, et al. Transforming research and clinical knowledge in traumatic brain injury pilot: multicenter implementation of the common data elements for traumatic brain injury. J Neurotrauma 2013; 30: 1831–44. [DOI] [PMC free article] [PubMed] [Google Scholar]
- 18.Duhaime A-C, Gean AD, Haacke EM, et al. Common data elements in radiologic imaging of traumatic brain injury. Arch Phys Med Rehabil 2010; 91: 1661–6. [DOI] [PubMed] [Google Scholar]
- 19.Marshall LF, Marshall SB, Klauber MR, et al. The diagnosis of head injury requires a classification based on computed axial tomography. J Neurotrauma 1992; 9 Suppl 1: S287–92. [PubMed] [Google Scholar]
- 20.Wilson L, Boase K, Nelson LD, et al. A Manual for the Glasgow Outcome Scale-Extended Interview. J Neurotrauma 2021; 38: 2435–46. [DOI] [PMC free article] [PubMed] [Google Scholar]
- 21.Manley GT, Diaz-Arrastia R, Brophy M, et al. Common data elements for traumatic brain injury: recommendations from the biospecimens and biomarkers working group. Arch Phys Med Rehabil 2010; 91: 1667–72. [DOI] [PubMed] [Google Scholar]
- 22.Korley FK, Datwyler SA, Jain S, et al. Comparison of GFAP and UCH-L1 Measurements from Two Prototype Assays: The Abbott i-STAT and ARCHITECT Assays. Neurotrauma Rep 2021; 2: 193–9. [DOI] [PMC free article] [PubMed] [Google Scholar]
- 23.Van Buuren S, Groothuis-Oudshoorn K. mice: Multivariate imputation by chained equations in R. J Stat Softw 2011; 45: 1–67. [Google Scholar]
- 24.Thelin E, Al Nimer F, Frostell A, et al. A Serum Protein Biomarker Panel Improves Outcome Prediction in Human Traumatic Brain Injury. J Neurotrauma 2019; 36: 2850–62. [DOI] [PMC free article] [PubMed] [Google Scholar]
- 25.Frankel M, Fan L, Yeatts SD, et al. Association of Very Early Serum Levels of S100B, Glial Fibrillary Acidic Protein, Ubiquitin C-Terminal Hydrolase-L1, and Spectrin Breakdown Product with Outcome in ProTECT III. J Neurotrauma 2019; 36: 2863–71. [DOI] [PMC free article] [PubMed] [Google Scholar]
- 26.Anderson TN, Hwang J, Munar M, et al. Blood-based biomarkers for prediction of intracranial hemorrhage and outcome in patients with moderate or severe traumatic brain injury. J Trauma Acute Care Surg 2020; 89: 80–6. [DOI] [PMC free article] [PubMed] [Google Scholar]
- 27.Alali AS, Vavrek D, Barber J, Dikmen S, Nathens AB, Temkin NR. Comparative study of outcome measures and analysis methods for traumatic brain injury trials. J Neurotrauma 2015; 32: 581–9. [DOI] [PMC free article] [PubMed] [Google Scholar]
- 28.Murray GD, Barer D, Choi S, et al. Design and analysis of phase III trials with ordered outcome scales: the concept of the sliding dichotomy. J Neurotrauma 2005; 22: 511–7. [DOI] [PubMed] [Google Scholar]
- 29.Yeatts SD, Martin RH, Meurer W, et al. Sliding Scoring of the Glasgow Outcome Scale-Extended as Primary Outcome in Traumatic Brain Injury Trials. J Neurotrauma 2020; 37: 2674–9. [DOI] [PMC free article] [PubMed] [Google Scholar]
- 30.Posti JP, Hossain I, Takala RSK, et al. Glial Fibrillary Acidic Protein and Ubiquitin C-Terminal Hydrolase-L1 Are Not Specific Biomarkers for Mild CT-Negative Traumatic Brain Injury. J Neurotrauma 2017; published online Jan 27. DOI: 10.1089/neu.2016.4442. [DOI] [PubMed] [Google Scholar]
Associated Data
This section collects any data citations, data availability statements, or supplementary materials included in this article.
Supplementary Materials
Data Availability Statement
The de-identified patient level data that support the findings of this study are available and will be made publicly available on the Federal Interagency Traumatic Brain Injury Research (FITBIR) Informatics System following deadlines agreed upon with federal funding partners.