Abstract
Background:
The oral and gut microbiomes have each been associated with food allergy status. Within food allergy, they may also influence reaction thresholds.
Objective:
To identify oral and gut microbiota associated with reaction thresholds in peanut allergy.
Methods:
59 children ages 4 to 14 years with suspected peanut allergy underwent double-blind, placebo-controlled food challenge to peanut. Children who reacted at the 300mg peanut dose or higher were classified as high threshold (HT), those who reacted to lower amounts were classified as low threshold (LT), and children who did not react were not peanut allergic (NPA). Saliva and stool samples collected before challenge underwent DNA isolation followed by16S rRNA sequencing and short chain fatty acid (SCFA) measurement.
Results:
The 59 participants included 38 HT and 13 LT children. Saliva microbiome alpha diversity (Shannon Index) was higher in LT children (P=0.017). We identified saliva and stool microbiota that distinguished HT and LT children, including oral Veillonella nakazawae (ASV 1979), which was more abundant in the HT vs. LT group (FDR=0.025), and gut Bacteroides thetaiotaomicron (ASV 6829), which was less abundant in HT vs. LT children (false discovery rate (FDR)=0.039). Comparison to NPA children revealed consistent ordinal trends between these discriminating species and reaction thresholds. Importantly, many of these threshold-associated species also correlated with SCFA levels at respective body sites, including between oral Veillonella nakazawae and oral butyrate (r=0.57, FDR=0.049).
Conclusion:
Findings from this multi-scale study raise the possibility of microbial therapeutics to increase reaction thresholds in food allergic children.
Keywords: Peanut allergy, threshold, microbiome, short chain fatty acid, oral, saliva, stool, gut, metabolomics
Capsule summary:
This study of children who underwent double-blind, placebo-controlled peanut challenges identified salivary and stool microbiota associated with reaction threshold that also correlated with short chain fatty acid levels in the oral and gut environments.
Introduction
Peanut allergy is a clinical and public health problem that affects 2-5% of US children1 and ~1% of the overall US population.2 The etiology of peanut and other food allergy involves deviation from a default state of immune tolerance that is likely driven by antigen exposure, commensal microbiota, and their interactions 3.
Growing evidence supports a role for microbiota in the pathogenesis and course of food allergy.3-11 Variations in gut microbiota have been associated with allergen sensitization,8 milk allergy,5 egg allergy,6 and food allergy in general.7 Interestingly, murine models demonstrate that food allergy phenotypes can be induced by fecal transfer9, 11, suggesting causal roles for gut microbiota in food allergy. Our group identified differential gut microbiota in children with egg allergy vs. controls6, and we also identified gut microbiota associated with the later resolution of milk allergy 5.
A modality by which microbiota may influence host immune systems and the course of food allergy is via metabolites. Metabolites produced by gut bacteria such as short chain fatty acids (SCFAs) induce T regulatory cell generation, migration, and accumulation12, 13 and affect the generation of tolerance-promoting dendritic cells and mucosal surface integrity.14
Because the oral mucosa is the beginning of a continuous gastrointestinal mucosal system rich with immune cells and microbiota, oral microbiota and metabolites produced by them could influence food allergy. Successful desensitization from sublingual immunotherapies for food allergy supports the importance of the oral environment15, as do results from a multidimensional analysis of saliva from peanut allergic children and non-food allergic controls in which microbial and metabolic profiles associated with mucosal immune disturbances in peanut allergy were identified.16
This study addresses the hypothesis that microbiota and metabolites in the oral and gut environments are associated with reaction thresholds in challenge-proven peanut allergy. We rigorously identified reaction thresholds in children via double-blind placebo-controlled food challenges to peanut and examined pre-challenge saliva and stool samples from these children. Here we report our findings about relationships between oral and gut microbiome diversity, composition, short chain fatty acid levels, and reaction thresholds.
Results and discussion
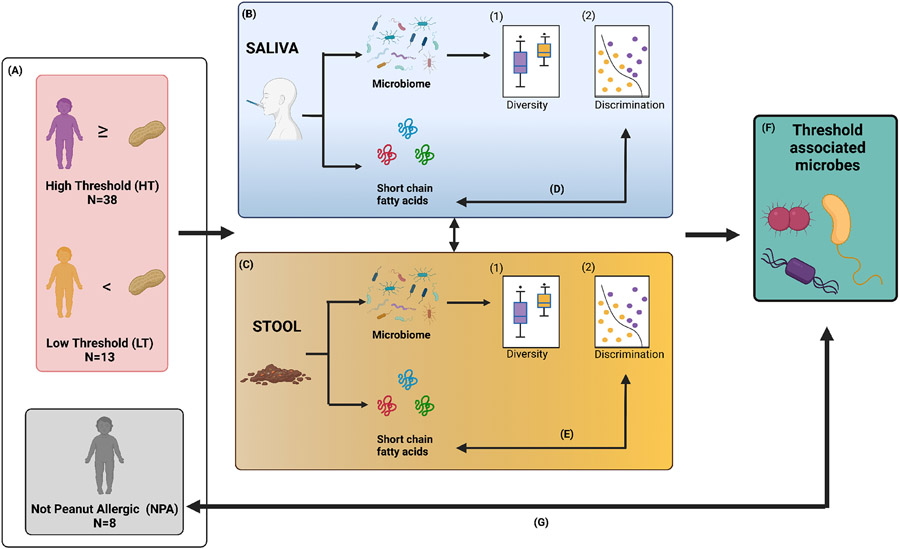
Figure 1 provides an overview of the study flow.
Figure 1: Study flow.
(A) Fifty-nine children ages 4 to 14 years with suspected peanut allergy underwent double-blind, placebo-controlled food challenges. Participants who experienced allergy symptoms after eating the 300mg peanut protein dose (equivalent to 1 peanut) or more were classified as high threshold (n=38). Children who reacted to smaller doses were classified as low threshold (n=13), and subjects who did not experience any symptoms to peanut were deemed not peanut allergic (n=8). Saliva and stool samples were collected from all children before challenge. DNA was isolated from saliva (B) and stool (C) for 16s rRNA sequencing, and short chain fatty acid (SCFA) levels were measured in the samples in parallel. Analyses for saliva and stool microbial diversity, discrimination, and their associations with high vs. low thresholds were performed. Next, correlations between microbiota and SCFA levels in both saliva (D) and stool (E) were characterized. The relative abundances of the threshold-associated saliva and stool taxa identified (F), were also assessed among non-peanut-allergic children (G). Figure created with Biorender.com.
Study population and design
Fifty nine children ages 4 to 14 years with suspected peanut allergy underwent double-blind, placebo-controlled food challenges as part of the CAFETERIA trial (Clinicaltrials.gov NCT03907397)17. Thirty-eight participants demonstrated allergy symptoms after eating the 300mg peanut protein dose (443mg cumulatively eaten) or more and were classified as high threshold (HT) (Figure 1A). As reference, 1 peanut contains 300mg peanut protein. Thirteen children who reacted to less than 300mg were classified as low threshold (LT), and 8 subjects who did not experience any symptoms to peanut were deemed not peanut allergic (NPA). LT children had higher peanut sIgE levels and larger peanut skin test wheal sizes compared to other children (Table 1). There were no significant differences in demographic characteristics, other atopic disease, or other food allergy between the groups (Table 1). Because this study’s hypothesis was about reaction thresholds in peanut allergic children, our analyses focused on comparing HT to LT peanut allergic children. However, threshold-associated microbiota identified from the HT vs. LT analyses were also later examined in the NPA group for further comparison.
Table 1.
Characteristics of the children
| Peanut Allergic: Low Tolerance (LT) N=13 |
Peanut Allergic: High Tolerance (HT) N=38 |
Not Peanut Allergic (NPA) N=8 |
P value |
|
|---|---|---|---|---|
| Age: years | 8.5 (4.1) | 7.8 (3.5) | 7.5 (3.0) | 0.80 |
| Gender: female | 4 (31%) | 12 (32%) | 2 (25%) | 1 |
| Race/Ethnicity | 0.70 | |||
| Asian | 3 (23%) | 4 (11%) | 0 (0%) | |
| Black | 1 (8%) | 1 (3%) | 1 (13%) | |
| Latino | 1 (8%) | 4 (11%) | 0 (0%) | |
| Multiple Races or Unknown | 2 (15%) | 7 (18%) | 2 (25%) | |
| White | 6 (46%) | 22 (58%) | 5 (63%) | |
| Cumulative peanut dose (mg) at reaction | 117 (50.1) | 2448 (2855.6) | NA | 0.005 |
| Peanut sIgE (kUA/L) | 17.1 (11.7) | 6.6 (7.3) | 5.3 (7.3) | 0.0007 |
| Peanut skin prick test (wheal mm) | 9.5 (2.7) | 8.6 (2.7) | 6.3 (2.1) | 0.03 |
| Other atopic disease | ||||
| Atopic dermatitis | 7 (54%) | 22 (58%) | 5 (63%) | 1 |
| Asthma | 4 (31%) | 11 (29%) | 1 (13%) | 0.76 |
| Allergic rhinoconjunctivitis | 9 (69%) | 22 (58%) | 3 (38%) | 0.37 |
| Other food allergy | ||||
| Cow’s milk | 3 (23%) | 6 (16%) | 1 (13%) | 0.87 |
| Egg | 7 (54%) | 11 (29%) | 3 (38%) | 0.27 |
| Sesame | 6 (46%) | 15 (39%) | 2 (25%) | 0.63 |
| Wheat | 3 (23%) | 3 (8%) | 2 (25%) | 0.18 |
| Tree nut1 | 8 (62%) | 29 (76%) | 4 (50%) | 0.20 |
Mean (SD) or number (%) are shown.
P values were calculated using Fisher’s exact test for categorical variables and ANOVA for continuous variables.
Tree nut includes almond, hazelnut, cashew and/or walnut.
Saliva and stool samples were collected from all children before challenge. DNA was isolated from the samples for 16S rRNA sequencing, yielding high quality data (mean sequencing depth for saliva 16s rRNA was 372,886 reads (SD=34,049); for stool 16s rRNA it was 383,139 reads (SD=50069)). In parallel, short chain fatty acid (SCFA) levels of the saliva and stool samples were measured by liquid chromatography mass spectrometry. Mean (SD) acetate, butyrate, and propionate levels were 4,977.3(2,765.2), 33.6(52.5), and 602.0(349.0) in saliva and 425,249.8(242,990.6), 158,865.5(118,878.8), and 243,907.6(128,934.9) in stool, respectively.
Distinct saliva and stool microbiomes in children with high vs. low threshold peanut allergy
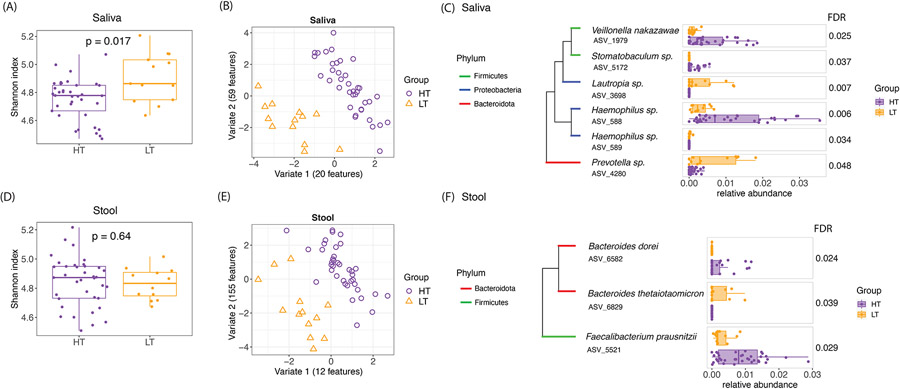
We first tested for differences in oral microbiome diversity in HT vs. LT children (Figure 1B), finding that alpha diversity (Shannon Index) of the oral microbiome was higher in LT (Wilcoxon P-value=0.017) (Figure 2A). To identify possible differences in oral microbiome composition between HT and LT, we next applied sparse partial least squares discriminant analysis (SPLSDA)18. SPLSDA is a data-driven method that applies dimension reduction to identify features that distinguish groups. The first two variates from SPLSDA, reflecting 20 and 59 oral microbial amplicon sequence variants (ASVs) respectively, distinguished HT and LT (Figure 2B). ASVs are microbial species identifiers based on DNA sequence similarity.
Figure 2: Distinct saliva and stool microbiomes in children with high vs. low threshold peanut allergy.
(A) Alpha diversity (Shannon index) of the saliva microbiome showed significant differences by Wilcoxon test between the high and low threshold children. Higher Shannon Index indicates higher alpha diversity. (B) SPLSDA of saliva microbiome composition showed separations between the high and low threshold children. The number of ASVs contributing to each of the first two variates are shown. (C) Saliva ASVs from SPLSDA that were differentially abundant between high and low threshold groups (FDR≤0.05) are shown. The phylogenetic trees show the taxonomic relationships between these taxa. (D), (E), and (F) show the equivalent findings for stool microbiome in these children.
To gain further insight into the oral species that distinguished HT and LT, we next tested for differential abundance of ASVs that contributed to SPLSDA Variate 1. Six of the Variate 1 oral ASVs were differentially abundant between HT and LT by Wilcoxon test after permutation-based correction for multiple comparisons (FDR≤0.05) (Figure 2C). These genera included known commensals and pathobionts19 such as Haemophilus sp. (ASV 588) and Veillonella nakazawae (ASV 1979), which were more abundant in HT compared to LT (Figure 2C). Veillonella nakazawae strains have been previously detected in children’s oral cavities,20 and lower Veillonella was previously found to correlate with lower butyrate in peanut allergy.16
We next implemented a similar analytic flow to test for differences in the gut microbiome of HT vs. LT peanut allergy (Figure 1C). While there were no significant differences in stool alpha diversity (Figure 2D), SPLSDA identified stool ASVs that distinguished HT and LT (Figure 2E). Testing for differential abundance of stool ASVs that contributed to SPLSDA Variate 1 revealed 3 ASVs were differentially abundant between HT and LT (Figure 2F). Bacteroides thetaiotaomicron (ASV 6829) showed higher abundance in LT (Figure 2F). Higher abundance of species within Bacteroides have been previously associated with non-IgE cow’s milk allergic children21, but these findings were not specific to the Bacteroides thetaiotaomicron species.
Correlations between microbiota and SCFA levels in saliva and stool in children with high and low threshold peanut allergy
Given microbiota are known sources of SCFAs, we next examined correlations between microbial taxa and SCFAs (Figure 1D, 1E). Specifically, we tested for correlations between the reaction threshold-associated ASVs and the oral (Figure 2C) and gut (Figure 2F) environments and SCFA levels from the same samples.
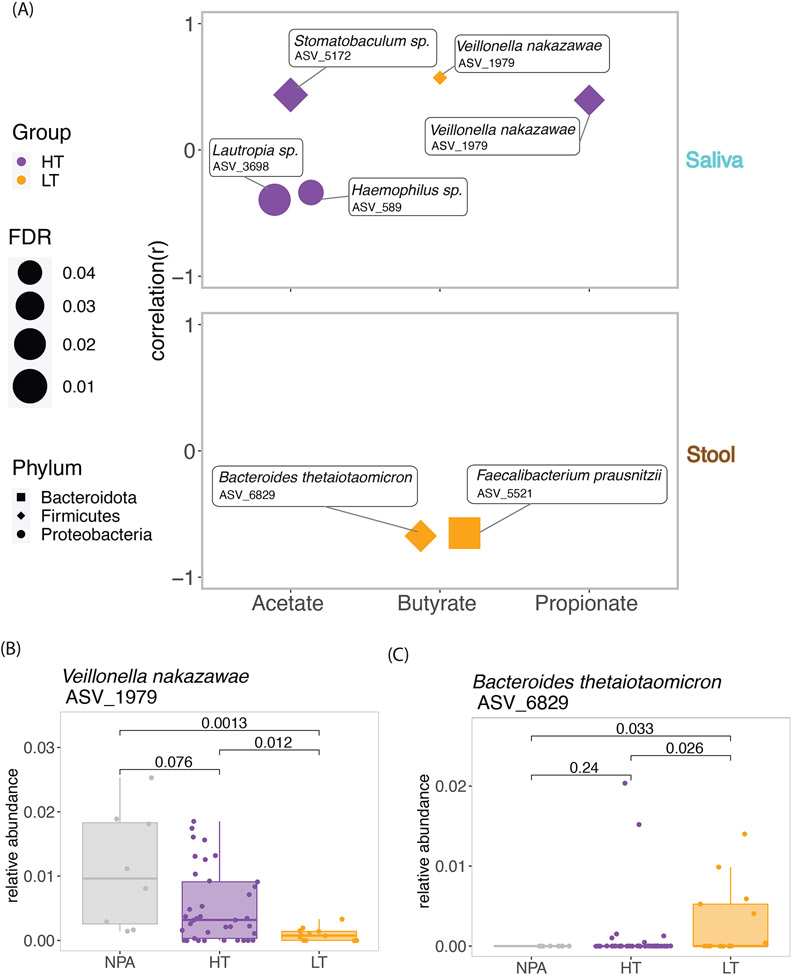
The correlations showed different patterns in HT and LT (Figure 3A). For example, while oral Veillonella nakazawae (ASV 1979) positively correlated with oral butyrate in LT (r=0.57, FDR=0.049), it correlated with oral propionate in HT (r=0.39, FDR=0.019). Both stool Bacteroides thetaiotaomicron (ASV 6829) (r=−0.65, FDR=0.018) and Faecalibacterium prausnitzii (ASV 5521) (r=−0.67, FDR=0.015) negatively correlated with butyrate only in LT (Figure 3A). SCFAs are thought to mediate communications between microbiota and host immunity,12 and our results show variation in how threshold-associated microbiota from different anatomic sites associate with SCFAs.
Figure 3: Correlations between microbiota and SCFA levels in saliva and stool in children with high and low threshold peanut allergy.
(A). Saliva and stool ASVs from SPLSDA that were differentially abundant between children with high and low threshold peanut allergy were correlated with saliva and stool SCFA levels, respectively. Significant correlations (FDR≤0.05) are shown. (B). The relative abundance of Veillonella nakazawae correlated with butyrate and propionate in saliva and was also significantly different between the high threshold, low threshold, and not peanut allergic groups. Wilcoxon test P values are shown. (C). The relative abundance of Bacteroides thetaiotaomicron correlated with butyrate in stool and was also significantly different between the high threshold, low threshold, and not peanut allergic groups. Wilcoxon p values are shown.
Closer examination of the threshold-associated saliva and stool microbiota that were also associated with SCFA levels (Figure 1F-G) revealed that the relative abundance of oral Veillonella nakazawae (ASV 1979) followed a pattern corresponding to peanut reaction threshold category, with highest relative abundance in the non-allergic group, less relative abundance among HT, and least abundance in LT (Figure 3B). Given this pattern and oral Veillonella nakazawae’s positive correlation with butyrate and propionate levels, these results suggest that it may be a salutary oral commensal with regards to threshold. In contrast, the relative abundance of stool Bacteroides thetaiotaomicron (ASV 6829) followed an opposite pattern, with highest median abundance in LT, followed by HT, and then NPA (Figure 3C). There were no associations between these microbiota and other atopic diseases, nor with other food allergies.
Analyses of SCFA levels without consideration of microbiota showed that salivary SCFAs trended highest in NPA compared to HT and LT, but differences were not significant, and there were no significant differences between groups for stool SCFA.
Correlations between saliva and stool microbiomes in peanut allergic children
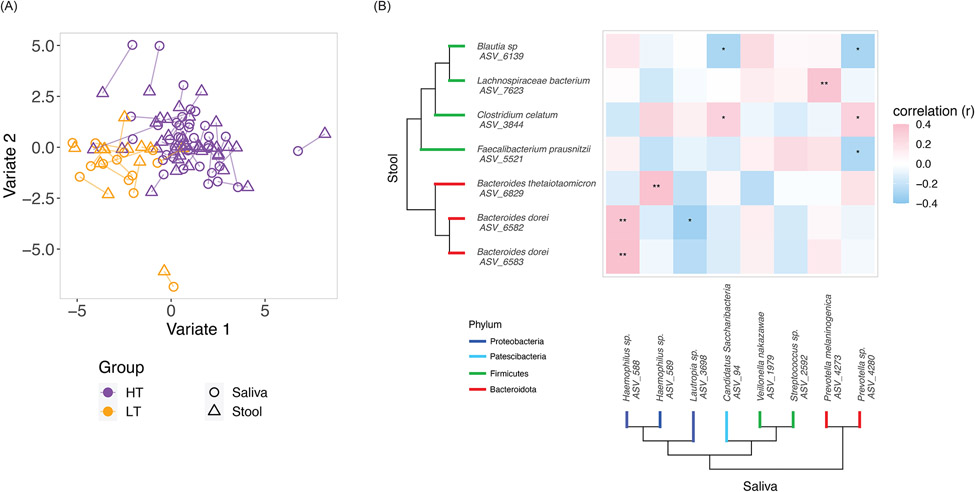
As prior studies have suggested interactions between oral and gut microbiota22, we were also interested in characterizing correlations between the saliva and stool microbiomes, which have not been previously characterized in food allergic individuals. Block SPLSDA23 identified variates that not only discriminated HT from LT, but also demonstrated covariance between saliva and stool microbiota (Figure 4A). Focused examination of oral and gut microbiota contributing to the variates identified ASVs that were differentially abundant (Wilcoxon FDR≤0.05) between HT and LT. Spearman correlation testing between these saliva and stool ASVs identified those significantly correlated between the anatomic sites, for example saliva Haemophilus (ASV 588) and stool Bacteroides dorei (ASV 6583) (Figure 4B, r=0.39, FDR=0.005). While we often think of the oral and gut environments as distinct, our results showing correlations between saliva and stool ASVs suggest possible cross-talk between these important environments for host-microbe-immune interactions in food allergy.
Fig.4. Correlations between saliva and stool microbiomes in peanut allergic children.
(A) Block SPLSDA was used to analyze correlations between saliva and stool microbiomes with respect to the high and low threshold groups. The identified variates maximized covariance between saliva and stool microbiome as well as separation between the high and low threshold groups. Lines connect saliva and stool samples from the same subject. 100 saliva ASVs and 155 stool ASVs contributed to Variate 1; 25 saliva taxa and 5 stool taxa contributed to Variate 2. (B) Saliva and stool taxa from the block SPLSDA that were differentially abundant (FDR≤0.05) between the high and low threshold groups were selected for Spearman correlation. Asterisks indicate Spearman FDR: * for FDR≤0.05 and ** for FDR≤0.01. The phylogenetic trees show the taxonomic relationships between the taxa.
While prior studies have examined associations between microbiota and food allergy status3-11, 16, 24, our multi-scale study is the first to report oral and gut microbiota associated with reaction thresholds in peanut allergy. We further found that the threshold-associated oral and gut microbiota identified are correlated with SCFA levels in these anatomic locations important to mucosal tolerance in food allergy. Our multi-scale study contributes important mechanistic characterization of the oral and gut microbial and metabolite environments associated with reaction thresholds in peanut allergy. While this study’s limitations include its sample size and uneven racial/ethnic distribution, and its cross-sectional design precludes conclusions about causality, our findings raise the possibility of microbial therapeutics25 to increase reaction threshold for individuals with food allergy.
Key Messages:
This study of children who underwent double-blind, placebo-controlled peanut challenges identified saliva and stool microbiota associated with high and low-threshold peanut allergy.
Many threshold-associated microbiota also correlated with short chain fatty acid levels in the oral and gut environments.
Findings from this study raise the possibility of microbial therapeutics for increasing reaction thresholds in food allergic children.
Funding Statement:
This study was supported by the National Institutes of Health R01 AI 147028 and U19 AI136053.
Abbreviations
- ASV
Amplicon sequence variant
- CAFETERIA
Challenging to food with escalating thresholds for reduced food allergy
- HT
High threshold
- LT
Low threshold
- NPA
Not peanut allergic
- SCFA
Short chain fatty acid
- SPLSDA
sparse partial least squares discriminant analysis
Footnotes
Publisher's Disclaimer: This is a PDF file of an unedited manuscript that has been accepted for publication. As a service to our customers we are providing this early version of the manuscript. The manuscript will undergo copyediting, typesetting, and review of the resulting proof before it is published in its final form. Please note that during the production process errors may be discovered which could affect the content, and all legal disclaimers that apply to the journal pertain.
Disclosure Statement: The authors declare no conflicts of interest relevant to this manuscript.
References
- 1.Bunyavanich S, Rifas-Shiman SL, Platts-Mills TA, Workman L, Sordillo JE, Gillman MW, et al. Peanut allergy prevalence among school-age children in a US cohort not selected for any disease. J Allergy Clin Immunol 2014; 134:753–5. [DOI] [PMC free article] [PubMed] [Google Scholar]
- 2.McGowan EC, Keet CA. Prevalence of self-reported food allergy in the National Health and Nutrition Examination Survey (NHANES) 2007-2010. J Allergy Clin Immunol 2013; 132:1216–9 e5. [DOI] [PMC free article] [PubMed] [Google Scholar]
- 3.Huang YJ, Marsland BJ, Bunyavanich S, O'Mahony L, Leung DY, Muraro A, et al. The microbiome in allergic disease: Current understanding and future opportunities-2017 PRACTALL document of the American Academy of Allergy, Asthma & Immunology and the European Academy of Allergy and Clinical Immunology. J Allergy Clin Immunol 2017; 139:1099–110. [DOI] [PMC free article] [PubMed] [Google Scholar]
- 4.Ho HE, Bunyavanich S. Role of the Microbiome in Food Allergy. Curr Allergy Asthma Rep 2018; 18:27. [DOI] [PubMed] [Google Scholar]
- 5.Bunyavanich S, Shen N, Grishin A, Wood R, Burks W, Dawson P, et al. Early-life gut microbiome composition and milk allergy resolution. J Allergy Clin Immunol 2016; 138:1122–30. [DOI] [PMC free article] [PubMed] [Google Scholar]
- 6.Fazlollahi M, Chun Y, Grishin A, Wood RA, Burks AW, Dawson P, et al. Early-life gut microbiome and egg allergy. Allergy 2018. [DOI] [PMC free article] [PubMed] [Google Scholar]
- 7.Savage JH, Lee-Sarwar KA, Sordillo J, Bunyavanich S, Zhou Y, O'Connor G, et al. A prospective microbiome-wide association study of food sensitization and food allergy in early childhood. Allergy 2017. [DOI] [PMC free article] [PubMed] [Google Scholar]
- 8.Kalliomaki M, Kirjavainen P, Eerola E, Kero P, Salminen S, Isolauri E. Distinct patterns of neonatal gut microflora in infants in whom atopy was and was not developing. J Allergy Clin Immunol 2001; 107:129–34. [DOI] [PubMed] [Google Scholar]
- 9.Noval Rivas M, Burton OT, Wise P, Zhang YQ, Hobson SA, Garcia Lloret M, et al. A microbiota signature associated with experimental food allergy promotes allergic sensitization and anaphylaxis. J Allergy Clin Immunol 2013; 131:201–12. [DOI] [PMC free article] [PubMed] [Google Scholar]
- 10.Bao R, Hesser LA, He Z, Zhou X, Nadeau KC, Nagler CR. Fecal microbiome and metabolome differ in healthy and food-allergic twins. J Clin Invest 2021; 131. [DOI] [PMC free article] [PubMed] [Google Scholar]
- 11.Feehley T, Plunkett CH, Bao R, Choi Hong SM, Culleen E, Belda-Ferre P, et al. Healthy infants harbor intestinal bacteria that protect against food allergy. Nat Med 2019; 25:448–53. [DOI] [PMC free article] [PubMed] [Google Scholar]
- 12.Arpaia N, Campbell C, Fan X, Dikiy S, van der Veeken J, deRoos P, et al. Metabolites produced by commensal bacteria promote peripheral regulatory T-cell generation. Nature 2013; 504:451–5. [DOI] [PMC free article] [PubMed] [Google Scholar]
- 13.Furusawa Y, Obata Y, Fukuda S, Endo TA, Nakato G, Takahashi D, et al. Commensal microbe-derived butyrate induces the differentiation of colonic regulatory T cells. Nature 2013; 504:446–50. [DOI] [PubMed] [Google Scholar]
- 14.Tan J, McKenzie C, Vuillermin PJ, Goverse G, Vinuesa CG, Mebius RE, et al. Dietary Fiber and Bacterial SCFA Enhance Oral Tolerance and Protect against Food Allergy through Diverse Cellular Pathways. Cell Rep 2016; 15:2809–24. [DOI] [PubMed] [Google Scholar]
- 15.Waldron J, Kim EH. Sublingual and Patch Immunotherapy for Food Allergy. Immunol Allergy Clin North Am 2020; 40:135–48. [DOI] [PubMed] [Google Scholar]
- 16.Ho HE, Chun Y, Jeong S, Jumreornvong O, Sicherer SH, Bunyavanich S. Multidimensional study of the oral microbiome, metabolite, and immunologic environment in peanut allergy. J Allergy Clin Immunol 2021; 148:627–32 e3. [DOI] [PMC free article] [PubMed] [Google Scholar]
- 17.Sicherer S. Immune and Clinical Implications of Threshold-based Phenotypes of Peanut Allergy (CAFETERIA). 2019; Clinicaltrials.gov Identifier NCT03907397. [Google Scholar]
- 18.Le Cao KA, Boitard S, Besse P. Sparse PLS discriminant analysis: biologically relevant feature selection and graphical displays for multiclass problems. BMC Bioinformatics 2011; 12:253. [DOI] [PMC free article] [PubMed] [Google Scholar]
- 19.Clark SE. Commensal bacteria in the upper respiratory tract regulate susceptibility to infection. Curr Opin Immunol 2020; 66:42–9. [DOI] [PMC free article] [PubMed] [Google Scholar]
- 20.Mashima I, Theodorea CF, Djais AA, Kunihiro T, Kawamura Y, Otomo M, et al. Veillonella nakazawae sp. nov., an anaerobic Gram-negative coccus isolated from the oral cavity of Japanese children. International Journal of Systematic and Evolutionary Microbiology 2021; 71. [DOI] [PubMed] [Google Scholar]
- 21.Berni Canani R, De Filippis F, Nocerino R, Paparo L, Di Scala C, Cosenza L, et al. Gut microbiota composition and butyrate production in children affected by non-IgE-mediated cow's milk allergy. Sci Rep 2018; 8:12500. [DOI] [PMC free article] [PubMed] [Google Scholar]
- 22.Sato K, Takahashi N, Kato T, Matsuda Y, Yokoji M, Yamada M, et al. Aggravation of collagen-induced arthritis by orally administered Porphyromonas gingivalis through modulation of the gut microbiota and gut immune system. Sci Rep 2017; 7:6955. [DOI] [PMC free article] [PubMed] [Google Scholar]
- 23.Rohart F, Gautier B, Singh A, Le Cao KA. mixOmics: An R package for 'omics feature selection and multiple data integration. PLoS Comput Biol 2017; 13:e1005752. [DOI] [PMC free article] [PubMed] [Google Scholar]
- 24.Abdel-Gadir A, Stephen-Victor E, Gerber GK, Noval Rivas M, Wang S, Harb H, et al. Microbiota therapy acts via a regulatory T cell MyD88/RORgammat pathway to suppress food allergy. Nat Med 2019; 25:1164–74. [DOI] [PMC free article] [PubMed] [Google Scholar]
- 25.Ho HE, Bunyavanich S. Microbial Adjuncts for Food Allergen Immunotherapy. Curr Allergy Asthma Rep 2019; 19:25. [DOI] [PubMed] [Google Scholar]


