

Abstract
The non-invasive nature of NMR offers a means to monitor biochemical reactions in situ at the atomic level. We harness this advantage to monitor a complex chemoenzymatic reaction that sequentially modifies reagents and loads the product on a nonribosomal peptide synthetase carrier protein. We present a protocol including a pulse sequence that permits to assess both the integrity of reagents and the completion of each step in the reaction, thus alleviating otherwise time-consuming and costly approaches to debug and repeat inefficient reactions. This study highlights the importance of NMR as a tool to establish reliable and reproducible experimental conditions in biochemical studies.
Keywords: NMR, isotope filter, diffusion, chemoenzymatic reactions
Graphical Abstract

Introduction
Nuclear magnetic resonance (NMR) promises to play a central role in determining molecular mechanisms and biological functions in near-native conditions. Recent advances in cryo-electron microscopy (cryo-EM)[1] and structure prediction algorithms such as AlphaFold[2] have greatly facilitated the determination of static structures. However, biological function and its regulation involve the timely redistribution of (transient) interactions between macromolecules, with fleeting molecular responses that are undetected by these techniques. Solution NMR provides rescue to this limitation due to its exquisite sensitivity to changes in molecular environments and its non-invasive nature. Thus, the kinetic, thermodynamic, and structural features accompanying molecular communication can be established during binding events, during biochemical reactions in vitro, or even in cells, resolving otherwise puzzling molecular mechanisms.[3–7] Nonribosomal peptide synthetases (NRPSs) are multidomain, microbial enzymatic factories that could produce new pharmaceuticals through engineering,[8] and NMR could help explain how they operate through a dynamic architecture involving fleeting domain interactions. However, preparing samples to answer these questions requires elaborate chemoenzymatic approaches that, occasionally, lead to significant delays and may become a bottleneck to experimental studies. Here, we exploit the aforementioned advantages of NMR to identify the causes for inefficient reactions and to verify that remediations are successful.
NRPSs utilize multiple domains organized in sequential modules to covalently tether simple substrates and assemble them into a variety of complex natural products, often with medicinal (antibiotics, immunosuppressants) and industrial (surfactants, pesticides) applications.[9,10] Each module comprises conserved domains to activate and tether substrates and to condense them with substrates of adjacent downstream modules. Notably, substrates and intermediates remain tethered to 20-Å phosphopantetheine (PP) moieties attached to carrier protein (CP) domains within each module, such that the sequence of modules defines the sequence of substrates that are condensed. During nonribosomal peptide synthesis, CP domains exist in apo forms lacking PP, in holo forms modified with PP, and in cargo-loaded forms, with cargos including simple substrates and intermediates. Thus, synthesis occurs through a succession of interactions between carrier proteins and partner catalytic domains to introduce the PP arm, load it with a substrate through a thioester bond, and to condense this substrate to that of a CP in a downstream module through a peptide bond. In this process, intermediates are extended while they are transferred to downstream modules until release in the final module. The NRPS assembly-line architecture provides a basis for producing improved therapeutics by swapping and engineering domains to incorporate exogenous substrates into the final product. Unfortunately, NRPSs operate through fleeting domain and substrate interactions wherein CPs transiently interact with catalytic partner domains and, to engineer functional NRPSs, we must determine how catalytic domains discriminate against CPs and their cargos within a dynamic architecture. Thus, the molecular determinants for substrate recognition and domain communication in NRPSs remain incomplete despite impressive crystallographic[11,12] and electron microscopy[13] studies.
To fill the gaps in understanding NRPSs, we seek to determine the molecular mechanisms by which catalytic domains recognize CPs and their cargos before they engage in the stable interactions reported by crystallography and electron microscopy. Structural and functional studies are further challenged by the lability of the thioester bond as substrates and intermediates often fall off during measurements. We and others have determined that PP arms and their attached cargo transiently interact with the core of CP domains,[14,15] and transient docked forms may provide a basis for dual domain and substrate recognition through encounter complexes preceding productive domain engagement in which PP arms and their cargos extend towards buried catalytic sites. One of our objectives is to determine the multiple substrate, PP, and domain binding sites in the many encounter and productive domain complexes involved in nonribosomal peptide synthesis. To this aim, we rely extensively on NMR methods that exploit site-specific isotope labeling of carrier proteins, their PP arms, and their cargos. We most often employ a chemoenzymatic route to simultaneously design our labeling scheme and produce stable derivatives, in which the thioester bond is replaced by an amide bond. Critically, it is generally impossible to separate the modified and unmodified proteins during subsequent purification protocols. Inhomogeneous samples would create unnecessary challenges in NMR experiments and taint enzymatic assays or binding studies performed with other techniques. It is thus critical to obtain a nearly fully modified protein at the end of the reaction to derive reliable molecular mechanisms.
Carrier protein domains can be modified with a phosphopantetheine arm tethering a substrate or intermediates through a one-pot chemoenzymatic approach.[16] In this scheme (Fig. 1), a series of enzymatic steps modify a pantetheine analog to produce a Co-Enzyme A (CoA) analog[17] with the cargo of interest attached. Pantothenate kinase (PanK) first phosphorylates the terminal hydroxyl group of pantetheine before phosphopantetheine adenylyltransferase (PPAT) activates this intermediate as an adenosine monophosphate (AMP) adduct to generate a dephospho-CoA (dpCoA) derivative. Dephospho-CoA kinase (DPCK) finalizes the conversion into a CoA derivative (not shown in Fig. 1), which is accepted by a phosphopantetheinyl transferase,[18] most commonly Sfp, and leads to a carrier protein harboring the post-translational modification of interest at a conserved residue. Traditionally, this chemoenzymatic synthesis is executed in a one-pot protocol where the carrier protein is mixed with all selected enzymes, a pantetheine analog, and ATP at once,[15,16,19–21] what we refer to in our laboratory as an all-in-one one-pot reaction. The use of the Sfp R4–4 mutant overcomes the need for DPCK.[22] However, Cryle and Co. observed that excesses of phosphoadenylates hampered the last reaction when using Sfp R4–4 and designed a sequential one-pot protocol wherein enzymes are added successively with short incubation periods of less than 30 minutes.[23] With this protocol, alkaline phosphatase from calf intestine (CIP) can be added before Sfp R4–4, and loaded CPs may be obtained at near-complete yields.
Fig. 1. Chemoenzymatic loading of pantetheine analogs to PCP1.

A modified one-pot reaction adapted from [16] and [23] is used to generate cysteine-loaded PCP1. A non-hydrolyzable, cysteine-linked pantetheine precursor 1 is modified over a series of sequential reaction steps mediated by the enzymes PanK, PPAT, and Sfp R4–4, with CIP preventing stalling of Sfp R4–4.
Regardless of whether the enzymes are added successively or at once, any deviation from the expected balance in reaction kinetics governed by enzyme concentrations and their catalytic integrity may jeopardize the outcome. Notably, PanK and PPAT co-purify with CoA[24,25] that must be removed before use, and DPCK is catalytically slow and reversible.[26,27] As mentioned, Sfp R4–4 is inhibited by large concentrations of phosphoadenylates,[23] and although addition of CIP resolves this issue, incubation must be timed adequately as we will soon discuss. The take-home message from a decade of using these protocols in our laboratory and from the literature is that the protocols work adequately once they have been optimized for a given pantetheine derivative and in absence of unexpected drawbacks such as deterioration of substrate or enzyme stock solutions. However, any human error in timing or enzyme concentration may jeopardize the outcome as enzyme kinetics dictate success. Traditionally, completion is verified via matrix-assisted deionization time-of-flight mass spectrometry (MALDI-TOF MS), and SDS-PAGE provides a limited assessment of enzyme integrity and their concentration in the reaction (vide infra). Importantly, these methods provide results at the outset of the reaction, which would have to be repeated if unsuccessful. Thus, time-consuming investigations may be needed to determine why substrate loading did not go to completion. To overcome these limitations, we turned to NMR as a means to monitor both the progress and integrity of this complex chemoenzymatic reaction.
Here, we present an NMR framework to monitor each step of the chemoenzymatic reaction and load the peptidyl carrier protein 1 (PCP1) of yersiniabactin synthetase[28] with a stable cysteine-linked pantetheine derivative. We first exploit a differential labeling scheme wherein 15N/13C labeled apo PCP1 is modified with an unlabeled phosphopantetheine arm harboring a cysteine substrate. We show that each step of the one-pot reaction can be monitored through appropriate pulse sequences, and we present a pulse sequence to monitor the final loading step of the reaction. This pulse sequence employs an improved combination of diffusion and isotope filters to isolate the signals of an unlabeled moiety tethered to a labeled protein in presence of a complex mixture of unlabeled reagents, substrates, and small molecule intermediates. We also offer a solution to monitor reactions for routine productions of modified unlabeled proteins. Our approach provides an easy and reliable means to identify experimental errors, defective enzymes, or substrate depletion, such that rescue plans may be designed, and it provides a means to verify that interventions lead to successful protein modification. We illustrate the method both with an uneventful reaction and in a situation in which multiple interventions were necessary.
Results and Discussion
We first established a protocol to monitor the modification of costly doubly labeled 15N/13C carrier proteins. Our objective is to employ 1D 1H-NMR to rapidly assess the progress of the reaction and not impose delays in incubation times due to data acquisition. Here, we employ a stepwise one-pot protocol, in which the NMR tube initially contains unlabeled pantetheine precursor 1, small molecule buffer components, ATP, as well as doubly-labeled PCP1 (see Materials and Methods). The pantetheine precursor is typically added in excess of the protein, with production costs limiting the amount, and we often use a 1.5-fold excess with a protein concentration of 100 μM (a value often used in protocols, with 50 μM being otherwise most often used). Here, we used a 5-fold excess to test the method presented in the next paragraph under an extreme case. As a general rule, NMR can be used to monitor reactions if molecules provide resolved signals that respond to chemical changes such that each reaction leads to an unambiguous spectroscopic signature. Each step in the one-pot reaction uniquely modifies the terminal end of the pantetheine substrate, which is converted from a hydroxyl to a phosphoryl group, and to an activated AMP intermediate. As a result, chemical moieties near this modified site may allow us to track each step in the reaction up to the addition of CIP. To isolate the signals of unlabeled reagents and intermediates from those of the protein, we used our recently developed 1D isotope filter,[29] consisting of two sequential, tuned isotope X half filters[30–32] targeting methyl (JCH=120 Hz) and aliphatic (JCH=150 Hz) signals of PCP1, with an additional filter using delayed decoupling to target surviving aromatic signals (JCH=220 Hz). We observe that successive modifications of pantetheine derivatives can be unambiguously monitored through intense signals of methyl groups, providing a convenient readout to estimate the completeness of each step (Fig. 2). In this reaction run, PanK converted 1 to 2 with ~ 100% completion (Fig. 2b–c), while the conversion of 2 to 3 (Fig. 2c–d) only proceeded to 83% after 1-hour of incubation with PPAT (see also SI Fig. 1 for a discussion of PPAT). As each enzyme in the reaction has varying turnover rates, some steps may require longer incubation times, an aspect we will further discuss, and our approach enables to monitor the conversion of each substrate and intermediate to verify that the next step can be performed. CIP is next added to remove phosphoadenylates, and we monitor its activity by inspecting the signals of H8 and H2 groups in adenosine derivatives (see Fig. 5 and SI Fig. 1). This time a simple 1D NOESY spectrum provides an adequate readout as the concentration of ATP is 2 mM. In the end, we could monitor the multi-step conversion of a derivative of phosphopantetheine to the corresponding dpCoA derivative, but we needed to develop a pulse sequence to monitor the final attachment of the dpCoA intermediate 3 to PCP1.
Fig. 2. Monitoring pantetheine modifications and reaction completeness through 1D isotope filtered NMR.

Each step of the chemoenzymatic modification of an unlabeled cysteine-linked pantetheine precursor was monitored using 1D isotope filtered NMR. (a) Signals of PCP1 were filtered using a sequential tuned X half-filtered pulse sequence (tuned to target 120 and 150 Hz) with delayed decoupling during acquisition for further suppression of aromatic signals (220 Hz).[29] Modification of the starting substrate is conveniently assessed through the intense methyl signals of the moiety. (b) Asterisks (*) denote the two methyl signals of 1, (c) double asterisks (**) denote the methyl groups of 2, and (d) triple asterisks (***) denote methyl groups of 3.
Fig. 5. Debugging and rescuing the complex chemoenzymatic reaction with 1D NMR.

The 1D isotope filtered spectrum (a) showed that the precursor 3 (signals with †) was converted back to 2 (**) and the starting material 1 (*), with a 2D HN-HSQC confirming that loading was stalled at 41%. The downfield regions of 1D NOESY spectra before (b) and after overnight incubation (c) demonstrate that CIP converted all phosphoadenylates, AMP (signals A and F), ADP (signals B and F), and ATP (signals C and F) to adenosine (signals E and G). Signal D belongs to the dpCoA intermediate 3. To rescue the reaction ATP, CIP, and Sfp R4–4 were supplemented to the reaction, and the increase in Sfp R4–4 concentration led to 87% of loaded PCP1 conversion (d). Spectra before (e) and after final incubation (f) indicated that all the ATP in the reaction had been dephosphorylated by CIP, as needed to prevent Sfp R4–4 inhibition. A final addition of ATP and starting material 1 led to 100% conversion under the final enzyme concentrations. See Material and Methods for details.
We designed an improved pulse sequence to isolate the signals of an unlabeled moiety tethered to a labeled protein within a solution of complex mixtures of unlabeled reagents. We needed a 1D NMR method that allowed us to monitor the final step in the one-pot reaction, where Sfp R4–4 catalyzes the attachment of the phosphopantetheine group of 3 tethered with a cysteine substrate to generate 4, 15N/13C loaded PCP1 (Fig. 1). Here, an important objective is to demonstrate that new signals appearing in NMR spectra denote loading and not an undesired side reaction leading to untethered pantetheine derivatives. To this aim, we exploited a diffusion filter, the primary building block of Diffusion NMR spectroscopy (DOSY),[33–35] to attenuate signals of fast diffusing reagents and buffer molecules, and we incorporated isotope filters to eliminate signals of the protein core, thereby highlighting the spectrum of the unlabeled moiety covalently attached to the protein. The pulse sequence can be seen as an update on the low-pass isotope filtered diffusion experiment of Gonnella and Co.,[36] now incorporating sequential, tuned isotope filters and our recently developed delayed decoupling filter.[29] Briefly, magnetization is spatially encoded (Fig. 3, point A) and decoded (Fig. 3, point B) around a diffusion period Δ, such that signals are discriminated against the diffusion of their respective molecules, as described by the Stejskal-Tanner equation[33]:
| Eqn. 1 |
where Ii is the intensity of a signal for molecule I diffusing during Δ, I0,i is the intensity of a signal unattenuated by diffusion, Di is the diffusion coefficient, γ is the gyromagnetic ratio of the nuclei, δ is the length of the encoding and decoding gradients, σ is the gradient shape factor, g is the strength of the encoding/decoding gradients, and Δ’ is the duration of the diffusion period corrected to account for the shape of pulsed-field gradients. Thus, signals of slowly diffusing molecules are less attenuated at the end of Δ’ than those of fast diffusing molecules, e.g. reagents and buffer components, with the difference between diffusion coefficients defining the resulting discrimination. We next sought to eliminate signals of the protein core through isotope filters. To mitigate losses due to relaxation, the first isotope half-filter XJ1 is concatenated with the diffusion decoding period. Thus, following the decoding period, once phases are restored in space, a 90° pulse is applied along −x, and the coherences of protons attached to isotopically active heteroatoms are eliminated by purge gradients, while those of the unlabeled moiety of interest are preserved. Concatenation is not strictly necessary for proteins as small as PCP1 (~10 kDa), where only 2.2% of losses are expected, but was implemented for broader application of the pulse sequence to larger multidomain constructs. A second tuned isotope half filter and an additional filter using delayed decoupling further suppress signals of the labeled protein as described in [29]. To eliminate all protein signals, the three isotope filters should be tuned to target methyl (XJ1, JCH,1 = 120 Hz), aliphatic (XJ2, JCH,2 = 150 Hz), and aromatic (Xd,J3, JCH,3 = 220 Hz) signals. It is important to target the moiety featuring the smallest scalar coupling, here 125 Hz, during the filter concatenated with the diffusion decoding period, XJ1, so that long decoding gradients may be employed. In the end, this 1D isotope diffusion filtered experiment unambiguously identifies signals of the attached unlabeled moieties (Fig. 4). With this suite of experiments, we were able to monitor the entire chemoenzymatic conversion of a modified pantetheine analog including its attachment to doubly labeled PCP1. We note that the objective is to verify that the reaction proceeds as expected and not to provide an overall yield of conversion, as exemplified below for a stalled reaction that we were able to rescue with our approach. The final sample conversion yield is assessed quantitatively through 2D HN-HSQC (SI Fig. 2a) or semi-quantitatively through MALDI-TOF-MS (SI Fig. 2b). In the end, the pair of isotope-edited experiments enabled us to identify unequivocal spectroscopic signatures for each step of the one-pot reaction.
Fig. 3. 1D diffusion edited, isotope filtered pulse sequence to monitor unlabeled moieties attached to labeled biomolecules.
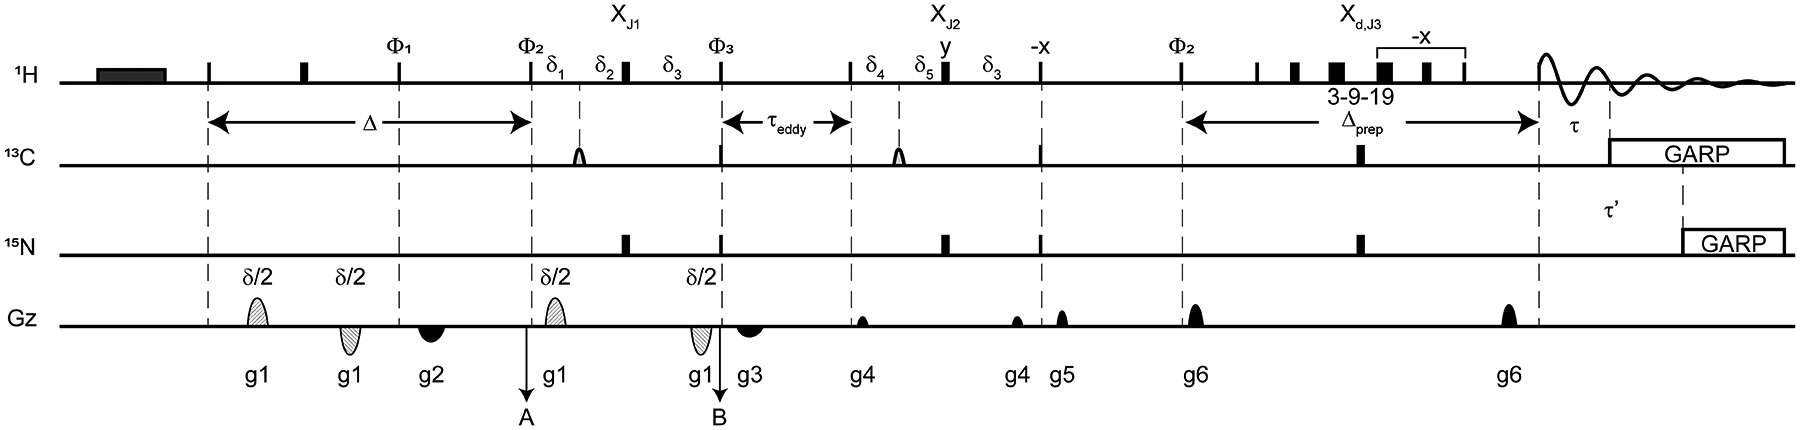
We modified a DOSY sequence using bipolar gradients (dashed half-ellipses) flanking a diffusion delay to incorporate isotope filters. A first isotope X half-filter (XJ1) is concatenated within the decoding period followed by a sequential tuned X half-filter block (XJ2) and a shared isotope filtered/Watergate element (Xd,J3) with delayed decoupling during acquisition.[29] The original Bruker pulse sequence ledbpgp2s1d [37] was first modified as in [38]. The presaturation period (dark grey rectangle) is optional. We used a longitudinal eddy current delay (τeddy) of 5 ms. Narrow and thick rectangles correspond to high power 90° and 180° pulses, respectively. Light gray half ellipses on the carbon channel correspond to 180° frequency-swept chirp inversion pulses, with durations of 500 μs using Bruker shaped pulse Crp60, 0.5, 20.1.[39] Diffusion editing is performed over the period Δ. To detect the phosphopantetheine moiety attached to PCP1, we used a diffusion period (Δ) of 150 ms, encoding/decoding gradient lengths of total duration δ = 2 ms with 47.5 G cm−1 strengths. For comparison, reference spectra were obtained with gradient strengths of 2.5 G cm−1. The delays in the filter periods are δ3 = 1/|4JNH|, δ1 = 1/|4JCH,1|, δ2 = 1/|4JNH| - 1/|4JCH,1|, δ4 = 1/|4JCH,2|, δ5 = 1/|4JNH| - 1/|4JCH, 2|, with the delayed decoupling filter element (Xd,J3) designed to target Δprep + τ’ = 1/|4JNH| and Δprep + τ = 1/|4JCH,3|. To accommodate a larger range of decoding gradient lengths, the concatenated filter period XJ1 should target the smallest JCH coupling constant such that JCH,1 = 120 Hz, JCH,2 = 150 Hz, and JCH,3 = 220 Hz. All filter elements are conveniently coded through constants to target individual coupling constants. Decoupling on carbon and nitrogen is applied with a GARP sequence [40] applied on resonance with the targeted signals using field strengths of 2.0833 kHz and 1.042 kHz, respectively. The phase cycle used was ϕ1 = x, x, −x, −x, ϕ2 = x, x, x, x, −x, −x, −x, −x, ϕ3 = x, −x, x, −x, −x, x, −x, x, and ϕrec = x, −x, −x, x, −x, x, x, −x, with all remaining phases being applied along x. Gradients were applied with lengths (τgi) and strengths (gi) along the z-axis with τg1 = δ/2 = 1 ms (bipolar gradients, Bruker shape SMSQ10.32), τg5 = τg6 = 1 ms (Bruker shape SMSQ10.32), τg2 = τg3 = = τg4 = 300 μs (Bruker shape SMSQ10.32), g1 = 47.5 G cm−1, g2 = 8.565 G cm−1, g3 = 6.585 G cm−1, g4 = 2.5 G cm−1, g5 =5.5 G cm−1, and g6 = 10 G cm−1.
Fig. 4. An isotope and diffusion filtered 1D experiment identifies signals of unlabeled moieties attached to labeled proteins.

We utilized a sequential, tuned isotope and diffusion filtered pulse sequence (Fig. 3) with delayed decoupling to selectively observe methyl groups from the unlabeled phosphopantetheine moiety of 3 (Fig. 1) attached to 15N/13C labeled PCP1 in presence of unlabeled reagents (bottom). The diffusion period was set to 150 ms and the bipolar gradient strength to 47.5 G cm−1. The same experiment with gradient strengths at 2.5 G cm−1 is shown in the middle to highlight the suppression of signals of fast-diffusing free substrates. A conventional 1D is also shown at the top. Double asterisks (**) denote the signals of methyls in 2, and triple asterisks (***) denote those in 3. † denote the signals of methyl groups upon covalent attachment of the phosphopantetheine arm to PCP1 (4). The preservation of these signals through a diffusion filter demonstrates that they belong to a moiety attached to the protein.
With spectroscopic signatures available (Figs. 2 and 4), we next investigated what experiments provided the best readouts for routine applications, e.g. when modifying an unlabeled protein. When the precursor in the reaction is present in excess, the more intense signals of the precursor stand-out from those of the protein, and standard 1D NMR spectra can readily report on the reaction progress until the last step, when the protein is modified. However, precursors are often challenging to produce, and we then perform one-pot reactions with conservative quantities of precursors (~1.2 equivalent). In this case, the intensities of precursor and protein signals are comparable, and it becomes difficult to identify changes in 1D spectra that faithfully report on the progress of the reaction. Here, diffusion and T2 filters can be exploited to emphasize signals of interest. Thus, the first steps of the one-pot reaction, preceding loading, can all be monitored through 1D T2 filters to attenuate the signals of the protein core (SI Fig. 3 a,b). We cannot isolate signals of the loaded moiety in the last step but can nevertheless identify them by comparing diffusion edited spectra (SI Fig. 3 c,d). Although the last step is only assessed in a very qualitative manner, verifying that the preceding steps have gone to completion and that loading is detected is nevertheless a powerful advantage as rescue plans may be designed on the spot as illustrated below for a doubly labeled protein.
Monitoring chemoenzymatic reactions by NMR permits to identify pitfalls and verify that remediations are successful. While we presented our methodology using the step-wise protocol described by Cryle and Co., we have also monitored reactions when we collected data to design, implement, and optimize pulse sequences. Under these conditions, timing could not be followed as the protein was incubated with enzymes for hours (see Methods) rather than 5 to 30 minutes as implemented by Cryle and Co. Most notably, when first optimizing the diffusion isotope edited pulse sequence, all previous steps had been subject to incubations longer than usual, and the sample was left to incubate overnight after addition of Sfp R4–4 at a late hour. We not only found that loading had stalled to 41% (Fig. 5a) but also that signals of molecules in the preceding steps were visible in the spectrum, including the original starting material, 1. Looking at data at the beginning and end of the incubation revealed that phosphoderivatives of adenosine were still present before incubation but all converted to adenosine 10 hours later (Fig. 5b,c), so stalling was not due to poisoning of Sfp R4–4. We concluded that CIP had outcompeted Sfp R4–4, most likely because the concentration of Sfp R4–4 was lower than expected from calculations, and that the remaining enzymes were then favoring the reverse reactions in absence of ATP, leading to 1. We next tried to rescue the reaction by adding more ATP, and we could verify the conversion of 1 to 2 and to the dpCoA derivative 3, before adding CIP and Sfp R4–4, the latter now being in excess. Conversion of phosphoderivatives was again monitored (Fig. 5 e,f), and this time we obtained conversion to 87% (Fig. 5d), and 100% of conversion was reached after spiking with ATP and precursors. The details of concentrations and timing are reported in the Method section. Clearly, these rather desperate measures were the consequences of highly inappropriate timing when first converting the pantetheine derivative to its dpCoA counterpart in the first place. Nevertheless, similar situations may occur accidentally during routine reactions. For example, reagents may be contaminated or the concentration of enzymes in the reaction tubes may differ from that predicted from the stock solutions, e.g. because of degradation or precipitation in the thawing stocks or because of mis-calibrated pipettors. SDS-PAGE and MALDI-TOF-MS are routinely used to verify the integrity of stock solutions before starting the reaction as they may reveal protein contaminants or degradation products. However, they are ill-suited to monitor reactions as sample preparation and data collection are time-consuming, and data analysis is performed a posteriori and only provides limited information (SI Fig. 4). Thus, the experimentalist is most often left with no other choice than start the entire reaction again if the protein is not entirely converted within a certain time. In contrast, monitoring the reaction by NMR is continuous and immediately identifies issues such that remediation can be attempted on the spot. For example, in a different reaction, we identified that ATP had been depleted when adding the second enzyme, PPAT, and addition of ATP rescued the reaction that had stalled at that stage (data not shown). We conclude this section by highlighting that, although we have employed the sequential one-pot protocol to be able to set-up new experiments, the all in-one approach that we also routinely employ can be monitored through the same experiments. Notably, the spectrum of CoA is markedly different from that of dpCoA (SI Fig. 5), and users who favor using the enzyme DPCK and wild-type Sfp may use our approach. In closing, we believe that our NMR framework is a formidable tool to prevent costly and time-consuming repeats in sample preparation and to provide homogeneous samples with fully modified proteins, thereby enhancing the reliability and reproducibility of subsequent experiments.
Conclusion
We have provided a 1D NMR framework to monitor complex chemoenzymatic reactions that modify proteins with an unlabeled moiety. The method was designed to follow a one-pot reaction involving four enzymes, which successively modify derivatives of pantetheines and tether them to a carrier protein. For a labelled protein, we employ 1D isotope filters to monitor modifications of the unattached precursors. We introduced a diffusion and isotope filtered experiment to isolate signals of the unlabeled moiety tethered to the labeled protein within a background of unlabeled reagents. For an unlabeled protein, the steps preceding loading can all be followed with T2 filters, and loading can be observed through a diffusion filtered 1D experiment. These 1D NMR readouts benefit from unambiguous spectral signatures of chemical modifications affecting intense methyl signals. This methodology enabled us not only to follow the progress of a successful reaction but also to rescue a reaction that had been stalled. The method readily identifies when enzymes are less active, substrates are limiting, or more generally when reaction kinetics impede product formation, e.g. when an undesirable reverse reaction dominates. This approach will facilitate otherwise cumbersome reaction optimizations that provide homogenous samples and enhance the reproducibility and integrity of subsequent studies by NMR or other techniques. Our study illustrates the critical role that NMR may play in enhancing the scientific rigor and reproducibility of biomolecular studies due to its non-invasive nature and an exquisite sensitivity to molecular changes.
Materials and Methods
Isotope labeling, expression, and purification of PCP1
Doubly labeled 15N/13C apo PCP1 of the Yersinia pestis irp2 1402–1482 gene fragment (accession number AAM85957) was expressed and purified as described in [29] in an E. coli BL21 (DE3) ΔEntD cell line (courtesy of Christian Chalut and Christophe Guilhot, CNRS, Toulouse, France). Isotope labeling was performed using M9 minimal media containing 1 g L−1 15NH4Cl and 2 g L−1 13C glucose to generate uniformly labeled 15N/13C PCP1.
Expression and purification of one-pot enzymes PanK, PPAT, and Sfp R4–4 (courtesy of Jun Yin, Georgia State University) were produced as described in [20] (PanK, PPAT) and [41] (Sfp R4–4), and purity was verified using 15% SDS-PAGE.
Isotopes used in the labeling of PCP1, buffer reagents used in the purification, and Quick CIP (alkaline phosphatase) were purchased from Cambridge Isotope Laboratories, VWR, and New England Biolabs, respectively.
Synthesis of an unlabeled non-hydrolyzable cysteine-linked pantetheine precursor
Loading of apo 15N/13C apo PCP1 was performed using a cysteine-linked pantetheine precursor wherein the native thioester linkage was replaced with an amino group to overcome hydrolysis of the cysteine substrate in solution (SI Fig. 6). The synthesis is described below.
Synthesis of III:
Boc-Cys(Trt)-OH I (1466 mg, 3.16 mmol) was mixed with HATU (1732 mg, 4.55 mmol) and DIEA (793 ul, 4.55 mmol) in DMF (12 ml) at room temperature for 10 minutes. The activated mixture was added to amine II (prepared according to [42]) in DMF (12 ml) and the resulting mixture was stirred for 12 hours. The reaction was quenched with water (60 ml) and the aqueous phase was extracted with EtOAc (60 ml x3). The combined organic phase was washed with 0.5 N aq. HCl (60 ml), water (60 ml), saturated NaHCO3 (60 ml), brine (60 ml x3), dried with anhydrous Na2SO4, and concentrated under reduced pressure. The concentrated crude product was purified by flash column chromatography (0 to 10% MeOH in CH2Cl2) to give III (1052 mg, 48%). 1H NMR (500 MHz, CDCl3) δ 7.42–7.47 (m, 8H), 7.30–7.34 (m, 8H), 7.26 (d, J= 8.7 Hz, 2H), 7.01 (br, 1H), 6.94 (d, J= 8.7 Hz), 2H), 6.58 (br, 1H), 6.50 (br, 1H), 5.50 (s, 1H), 4.94 (br, 1H), 4.12 (s, 1H), 3.84 (s, 3H) ,3.83–3.88 (m, 1H), 3.71 (dd, J1= 11.3 Hz, J2= 25.6 Hz, 2H), 3.23–3.58 (m, 6H), 2.75 (dd, J1= 6.8 Hz, J2= 12.7 Hz, 1H), 2.55 (dd, J1= 5.7 Hz, J2= 12.7 Hz, 1H), 2.30 (br, t, J= 7.5 Hz, 2H) 1.44 (s, 9H), 1,15 (s, 3H), 1.12 (s, 3H). 13C NMR (126 MHz, CDCl3) δ 171.33, 171.23, 169.45, 160.20, 144.23, 130.14, 129.49, 128.07, 126.95, 113.70, 101.33, 83.84, 78.45, 67.20, 55.30, 39.29, 36.21, 34.94, 33.06, 28.27, 21.86, 19.12.
Synthesis of IV:
To a solution of compound III in THF (20 ml), 1 N aqueous HCl (20 ml) was added slowly at room temperature and stirred for one hour. The resulting solution was neutralized by adding 1 N NaOH (10 ml) and saturated NaHCO3 (7.5 ml) and extracted with EtOAc. The combined extract was washed with water, brine (2x), and dried with Na2SO4. Purification by flash column chromatography (0 to 15% MeOH in methylene chloride) gave diol IV (592 mg, 69%) as a white solid. 1H NMR (500 MHz, CDCl3) δ 7.39–7.47 (m, 6H), 7.29–7.36 (m, 6H), 7.24–7.28 (m, 2H), 6.96 (br, 1H), 6.85 (br, 1H), 5.18 (br, 1H), 4,81 (d, J= 5.2 Hz, 1H), 4.09 (br, s, 1H), 4.01 (d, J= 5.0 Hz, 1H), 3.90 (dd, J1= 6.4 Hz, J2= 12.9 Hz, 1H),3.58 (br, s, 1H), 3.41–3.52 (m, 3H), 3.21–3.41 (m, 4H), 2.72 (dd, J1= 6.9 Hz, J2= 12.7 Hz, 1H), 2.56 (dd, J1= 5.3 Hz, J2= 12.7 Hz, 1H) 2.56 (m, 1H), 2.32 (br, 1H), 1.44 (s, 9H), 1.02 (s, 3H), 0.94 (s, 3H).
Synthesis of Cys-NH-Pantetheine analog:
To the diol IV (100 mg, 0.14 mmol) was added a cleavage cocktail (5 ml, TIPS/TFA = 5/95 (v/v)). Incubation was done at room temperature for 5 min and stopped by the addition of cold diethyl ether (40 ml). The precipitated white solid was centrifuged down, and the supernatant was decanted. The ether wash/centrifugation/decant steps were repeated 3 times in total. The final white precipitate was dried under N2 and collected as a white solid (Cys-NH-Pantetheine, 40 mg, 78%), which was used for the next enzymatic assays without any further purification steps. 1H NMR (500 MHz, CD3OD) δ 3.99 (dd, J1= 5.0 Hz, J2= 6.9 Hz, 1H), 3.92 (s, 1H), 3.45–3.55 (m, 3H), 3.28–3.44 (m, 5H), 3.07 (dd, J1= 5.0 Hz, J2= 14.6 Hz, 1H), 2.96 (dd, J1= 7.1 Hz, J2= 14.6 Hz, 1H), 2.43 (t, J= 6.6 Hz, 1H), 0.94 (s, 6H). 13C NMR (126 MHz, CD3OD) δ 215.67, 174.56, 168.74, 77.46, 70.42, 56.41, 40.72, 39.92, 37.08, 36.61, 26.34, 21.54, 21.03.
Chemoenzymatic loading of doubly labeled PCP1 with an unlabeled pantetheine analog
We implemented the one-pot reaction (Fig. 1) in a stepwise manner to monitor each step towards loading of PCP1. All reaction steps were performed at 25 °C and NMR experiments were optimized and collected at each step upon addition of enzymes and/or reagents. ATP was prepared as a 100 mM stock in one-pot reaction buffer (100 mM Tris, pH 7.55 at 22 °C, 10 mM MgCl2, 100 mM NaCl, 2.5 mM DTT, 10% v/v D2O, and 200 μM DSS for referencing). We used 200 μM stock solutions of PanK and PPAT in 20 mM Tris pH 7.5, 100 mM NaCl, and 10% (v/v) glycerol. We used a 2.5 mM stock solution of Sfp R4–4 in 10 mM Tris pH 7.5, 1 mM EDTA, and supplemented with 10% glycerol. Quick CIP stocks were used at 500 U mL−1 in one-pot reaction buffer.
In a first reaction providing the data for Figs. 2 and 4, 500 μL of 15N/13C labeled apo PCP1 (100.1 μM) in one-pot reaction buffer was transferred to an NMR tube and degassed. Reference 1D NOESY, 1D isotope filter, 1D isotope and diffusion filtered, and 2D HN-HSQC experiments were collected. The sample was supplemented with 473.5 μM of cysteine-linked pantetheine precursor 1 (from a stock at 7.62 mM in water). PanK was added to 2.5 μM, and reference spectra were again collected for 42 minutes. The reaction was initiated with the addition of ATP (2.3 mM) with an incubation of 35 minutes during which more spectra were recorded. PPAT was then added to 2.5 μM, and the reaction was incubated for approximately one hour as NMR spectra were collected. Quick CIP (1.9 U mL−1) was supplemented into the reaction and incubated for one hour and 38 minutes. Sfp R4–4 was added to 2.4 μM and incubated for two hours and 33 minutes. Following this period, apo PCP1 was fully converted to loaded PCP1 as determined by 2D HN-HSQC spectra, where loading efficacy was determined to be 100%. Accounting for all dilutions, the final sample contained 94.3 μM PCP1, 2.4 μM PanK, 2.4 μM PPAT, 1.9 U mL−1 Quick CIP, 2.4 μM Sfp R4–4, 2.4 mM ATP, and 471.2 μM Cys-NH-pantetheine analog. We underline that the acquisition of 1D isotope filtered, 1D-NOESY, and 1D isotope and diffusion filtered spectra each only take 2, 3, and 2 minutes, respectively.
We repeated this stepwise, one-pot reaction on a larger scale (~5 mL) but faced issues with incomplete loading of PCP1 due to prolonged incubation steps. This reaction was ultimately rescued and provided the data for Fig. 5 in the main text. At the start, 15N/13C apo PCP1 (134.3 μM) was supplemented with 544.1 μM of the cysteine-linked pantetheine precursor 1 in one-pot reaction buffer containing 10% (v/v) D2O and DSS (200 μM). PanK (2.6 μM) was added and incubated at 25 °C for 50 minutes. The reaction was started with the addition of ATP (2.6 mM) and incubated for 51 minutes. PPAT (2.5 μM) was then added and the reaction was incubated for one hour and two minutes. To assess whether Sfp R4–4 could efficiently load with phosphoadenylates present, we next added 2.5 μM Sfp R4–4 and incubated for one hour and 33 minutes. Only 5% loading of PCP1 was observed consistent with observations made by Cryle and Co.[23] Next, Quick CIP (2.0 U mL−1) was added and incubated for 1 hour and 40 minutes. Additional Sfp R4–4 (2.5 μM) was then added to try to push the reaction to completion. Following overnight incubation for 9 hours and 51 minutes, PCP1 still showed incomplete loading, as further verified by MALDI-TOF-MS (SI Fig. 4). To restart the reaction as the original pantetheine analog 1 had been reformed, ATP (2.5 mM) was added to the reaction and incubated for one hour and 43 minutes. Next, Quick CIP (0.5 U mL−1) was supplemented into the reaction and incubated for 43 minutes. An additional 4.9 μM Sfp R4–4 was then added to favor loading in presence of CIP. The reaction was incubated for 10 hours and 12 minutes overnight, and an aliquot was saved for subsequent SDS-PAGE and MALDI-TOF-analysis. Following overnight incubation, the reaction was supplemented with 1 (300.6 uM) and ATP (2.3 mM). The reaction was incubated for 1.5 hours after which PCP1 was determined to be fully loaded upon inspection of a 2D HN-HSQC spectrum. Accounting for all dilutions, the final reaction contained 106.4 μM PCP1, 2.3 μM PanK, 2.3 μM PPAT, 2.3 U mL−1 Quick CIP, 9.3 μM Sfp R4–4, 7.0 mM adenosine derivatives (ATP/ADP/AMP, and adenosine as a product of CIP), and 757.5 μM Cys-NH-pantetheine analog. The prolonged incubation times resulted from attempts at setting up new experiments not discussed in the manuscript.
NMR data acquisition
All NMR experiments were collected at 25 °C on a 600 MHz Bruker Avance III spectrometer equipped with a QCI cryoprobe using samples described in the previous sections. All spectra were processed in TopSpin 3.6.2.
All 1D experiments were collected with 32 scans (except the 1D NOESY which was collected with 16 scans), a spectral width of 16.0192 ppm centered at 4.698 ppm, and a 2 sec recycling delay. All 1D isotope filtered NMR experiments were collected with 3084 complex points. These experiments implement a 3-9-19 WATERGATE element for water suppression. Spectra were zero-filled to 16384 points, referenced to DSS, baseline corrected, and apodized using exponential multiplication (5 Hz) to reduce truncation artifacts from intense buffer signals. 1D NOESY experiments were collected using Bruker pulse program noesygppr1d, with continuous-wave presaturation during the recycling delay (2 seconds) and during the NOE mixing time (150 ms) applied on resonance with water with a field strength of 27.3 Hz. The 1D NOESY spectra were collected with 32,768 complex points, zero-filled to 131072 points, and referenced to DSS. All 1D diffusion and isotope filtered experiments implementing the pulse sequence in Fig. 3 were collected with 3084 complex points, zero-filled to 16384 points, apodized with a 4 Hz exponential function, and referenced to DSS. Continuous-wave presaturation was applied during the recycling delay with a field strength of 27.3 Hz. For the 1D diffusion spectra, we modified the Bruker pulse sequence ledbpgp2s1d in accordance with [38] and included 15N and 13C decoupling during acquisition. 1D diffusion spectra (Bruker pulse sequence ledbpgp2s1d) were collected with the same parameters as their isotope filtered counterparts (Fig. 3), but with 128 scans. 1D T2 filters were run using the Bruker pulse sequence cpmgpr1d but modified to include 15N and 13C decoupling during acquisition. Spectra were collected with a fixed echo time of 2 ms and a T2 filter length of 408 ms to attenuate PCP1 signals, while a 24 ms T2 filter was used for reference spectra. Spectra were collected with 128 scans, zero-filled to 16384 points, apodized with a 5 Hz exponential function, and referenced to DSS.
All 2D HN-HSQC spectra used to quantify loading of PCP1 at the end of the reaction were collected with 8 scans, 1 sec recycling delay, 128 complex points in the 15N dimension, 2048 points in the detected dimension, spectral widths of 16.0192 ppm (1H) and 28 ppm (15N), with carriers set at 4.698 ppm (1H) and 117.0 ppm (15N). Nitrogen decoupling was applied with 1.042 kHz field strength using a GARP sequence. Spectra were apodized with a cosine-squared bell function, extracted over the amide region (1H), zero-filled to 2048 (1H) and 512 (15N) points, and referenced directly (1H) and indirectly (15N) using DSS.
The assignment of the cysteine-linked pantetheine analog 1 (SI Fig. 7, SI Table 1) was aided by existing assignments of pantetheine derivatives[43,44] and completed with the following experiments using a 1 mM sample of 1 in water (pH 5–6), containing 10% (v/v) D2O, and 200 μM DSS. A 2D 1H-1H TOCSY spectrum (Bruker pulse sequence dipsi2esgpph) was collected with 60 ms DIPSI-2 [45] mixing sequence applied with a field strength of 10.006 kHz, 2048 t2 points and 512 t1 complex points, spectral widths of 16.0192 ppm (F2) and 16 ppm (F1), carriers at 4.697 ppm, 1 second recycling delay, and 16 scans. Additionally, a 2D NOESY (Bruker pulse sequence noesyesgpph) spectrum was collected using a 200 ms mixing time, 16 scans, spectral widths of 16.0192 ppm (F1 and F2 dimensions), with all other acquisition parameters as in the 2D TOCSY. To assign carbon resonances of 1, a 2D HC-HSQC spectrum (Bruker pulse sequence hsqcetgpsisp2) was collected with the following parameters: 16 scans, 1.5 sec recycling delay, 2048 (t2) and 256 (t2) points, spectral widths of 16.0192 ppm (1H) and 100 ppm (13C), and carriers of 4.698 ppm (1H) and 50 ppm (13C). Assignment of 15N resonances in 1 was performed using a 2D HN-HSQC (Bruker pulse sequence hsqcfpf3gpphwg) using: 256 scans, 1 second recycling delay, 2048 (1H) and 128 (15N) points, spectral widths of 16.0192 ppm (1H) and 28 ppm (15N), and carriers of 4.698 ppm (1H) and 117 ppm (15N). All spectra were referenced with respect to DSS before assigning resonances.
MALDI-TOF-MS sample preparation and data acquisition
All one-pot reaction MALDI-TOF-MS samples were quenched with 20 mM EDTA at the time of sampling and stored at −20 °C. Samples were thawed at room temperature, diluted five-fold, desalted using a C18 zip tip, and prepared for plating in an eluent containing 50% acetonitrile and 0.1% trifluoroacetic acid (TFA). Samples were plated and layered with sinapinic acid (10 mg mL−1 in 50% acetonitrile and 0.1% TFA) as the matrix. Spectra were collected in linear mode over the mass range 2500 to 25000 Da on a Voyager DE-STR (Applied Biosystems). The instrument was calibrated over the range of 5734.51 to 16952.30 Da using a calibration standard (Protein Calibration Standard I, Bruker).
Supplementary Material
Funding.
This work was supported by the National Institute of General Medical Sciences [D.P.F: grant number R01GM104257]; D.J.M. acknowledges funding from the Flight Attendant Medical Research Institute (FAMRI) and the Institute for Clinical and Translational Research, and the National Institutes of Health [award number UL1TR003098].
Footnotes
Declaration of Competing Interest. The authors declare that they have no known competing financial interests or personal relationships that could have appeared to influence the work reported in this paper.
Appendix A. Supplementary material.
Supplementary data to this article can be found online at https://doi.org/10.1016/j.jmr.2022.107265.
Code and Data Availability.
All raw NMR and MALDI-TOF-MS data and the newly introduced isotope and diffusion filtered 1D NMR pulse sequence are available through Zenodo at https://doi.org/10.5281/zenodo.6660812 . Additionally, the isotope and diffusion filtered 1D NMR pulse sequence is available from https://frueh.med.jhmi.edu/software-downloads/.
References
- [1].Nakane T, Kotecha A, Sente A, McMullan G, Masiulis S, Brown PMGE, Grigoras IT, Malinauskaite L, Malinauskas T, Miehling J, Uchański T, Yu L, Karia D, Pechnikova EV, de Jong E, Keizer J, Bischoff M, McCormack J, Tiemeijer P, Hardwick SW, Chirgadze DY, Murshudov G, Aricescu AR, Scheres SHW, Single-particle cryo-EM at atomic resolution, Nature. 587 (2020) 152–156. 10.1038/s41586-020-2829-0. [DOI] [PMC free article] [PubMed] [Google Scholar]
- [2].Jumper J, Evans R, Pritzel A, Green T, Figurnov M, Ronneberger O, Tunyasuvunakool K, Bates R, Žídek A, Potapenko A, Bridgland A, Meyer C, Kohl SAA, Ballard AJ, Cowie A, Romera-Paredes B, Nikolov S, Jain R, Adler J, Back T, Petersen S, Reiman D, Clancy E, Zielinski M, Steinegger M, Pacholska M, Berghammer T, Bodenstein S, Silver D, Vinyals O, Senior AW, Kavukcuoglu K, Kohli P, Hassabis D, Highly accurate protein structure prediction with AlphaFold, Nature. 596 (2021) 583–589. 10.1038/s41586-021-03819-2. [DOI] [PMC free article] [PubMed] [Google Scholar]
- [3].Henzler-Wildman K, Kern D, Dynamic personalities of proteins, Nature. 450 (2007) 964–972. 10.1038/nature06522. [DOI] [PubMed] [Google Scholar]
- [4].Iwahara J, Clore GM, Detecting transient intermediates in macromolecular binding by paramagnetic NMR, Nature. 440 (2006) 1227–1230. 10.1038/nature04673. [DOI] [PubMed] [Google Scholar]
- [5].Goodrich AC, Frueh DP, A nuclear magnetic resonance method for probing molecular influences of substrate loading in nonribosomal peptide synthetase carrier proteins, Biochemistry. 54 (2015) 1154–1156. 10.1021/bi501433r. [DOI] [PMC free article] [PubMed] [Google Scholar]
- [6].Serber Z, Dotsch V, In-Cell NMR Spectroscopy, Biochemistry. 40 (2001) 14317–14323. [DOI] [PubMed] [Google Scholar]
- [7].Whittier SK, Hengge AC, Loria PJ, Conformational Motions Regulate Phosphoryl Transfer in Related Protein Tyrosine Phosphatases, Science (80-. ). 341 (2013) 899–903. [DOI] [PMC free article] [PubMed] [Google Scholar]
- [8].Bozhüyük KA, Micklefield J, Wilkinson B, Engineering enzymatic assembly lines to produce new antibiotics, Curr. Opin. Microbiol 51 (2019) 88–96. 10.1016/j.mib.2019.10.007. [DOI] [PMC free article] [PubMed] [Google Scholar]
- [9].Finking R, Marahiel MA, Biosynthesis of nonribosomal peptides, Annu. Rev. Microbiol 58 (2004) 453–488. 10.1146/annurev.micro.58.030603.123615. [DOI] [PubMed] [Google Scholar]
- [10].Süssmuth RD, Mainz A, Nonribosomal Peptide Synthesis—Principles and Prospects, Angew. Chemie - Int. Ed 56 (2017) 3770–3821. 10.1002/anie.201609079. [DOI] [PubMed] [Google Scholar]
- [11].Reimer JM, Eivaskhani M, Harb I, Guarné A, Weigt M, Martin Schmeing T, Structures of a dimodular nonribosomal peptide synthetase reveal conformational flexibility, Science (80-. ). 366 (2019). 10.1126/science.aaw4388. [DOI] [PubMed] [Google Scholar]
- [12].Izoré T, Ho YTC, Kaczmarski JA, Gavriilidou A, Chow KH, Steer DL, Goode RJA, Schittenhelm RB, Tailhades J, Tosin M, Challis GL, Krenske EH, Ziemert N, Jackson CJ, Cryle MJ, Structures of a non-ribosomal peptide synthetase condensation domain suggest the basis of substrate selectivity, Nat. Commun 12 (2021) 1–14. 10.1038/s41467-021-22623-0. [DOI] [PMC free article] [PubMed] [Google Scholar]
- [13].Tarry MJ, Haque AS, Bui KH, Schmeing TM, X-Ray Crystallography and Electron Microscopy of Cross- and Multi-Module Nonribosomal Peptide Synthetase Proteins Reveal a Flexible Architecture, Structure. 25 (2017) 783–793.e4. 10.1016/j.str.2017.03.014. [DOI] [PubMed] [Google Scholar]
- [14].Goodrich AC, Harden BJ, Frueh DP, Solution Structure of a Nonribosomal Peptide Synthetase Carrier Protein Loaded with Its Substrate Reveals Transient, Well-Defined Contacts, J. Am. Chem. Soc 137 (2015) 12100–12109. 10.1021/jacs.5b07772. [DOI] [PMC free article] [PubMed] [Google Scholar]
- [15].Jaremko MJ, Lee DJ, Opella SJ, Burkart MD, Structure and Substrate Sequestration in the Pyoluteorin Type II Peptidyl Carrier Protein PltL, J. Am. Chem. Soc 137 (2015) 11546–11549. 10.1021/jacs.5b04525. [DOI] [PMC free article] [PubMed] [Google Scholar]
- [16].Worthington AS, Burkart MD, One-pot chemo-enzymatic synthesis of reporter-modified proteins, Org. Biomol. Chem 4 (2006) 44–46. 10.1039/b512735a. [DOI] [PubMed] [Google Scholar]
- [17].Nazi I, Koteva KP, Wright GD, One-pot chemoenzymatic preparation of coenzyme A analogues, Anal. Biochem 324 (2004) 100–105. 10.1016/j.ab.2003.09.005. [DOI] [PubMed] [Google Scholar]
- [18].Lambalot RH, Gehring AM, Flugel RS, Zuber P, LaCelle M, Marahiel MA, Reid R, Khosla C, Walsh CT, A new enzyme superfamily - The phosphopantetheinyl transferases, Chem. Biol 3 (1996) 923–936. 10.1016/S1074-5521(96)90181-7. [DOI] [PubMed] [Google Scholar]
- [19].Hur GH, Meier JL, Baskin J, Codelli JA, Bertozzi CR, Marahiel MA, Burkart MD, Crosslinking Studies of Protein-Protein Interactions in Nonribosomal Peptide Biosynthesis, Chem. Biol 16 (2009) 372–381. 10.1016/j.chembiol.2009.02.009. [DOI] [PMC free article] [PubMed] [Google Scholar]
- [20].Goodrich AC, Meyers DJ, Frueh DP, Molecular impact of covalent modifications on nonribosomal peptide synthetase carrier protein communication, J. Biol. Chem 292 (2017) 10002–10013. 10.1074/jbc.M116.766220. [DOI] [PMC free article] [PubMed] [Google Scholar]
- [21].Kosa NM, Pham KM, Burkart MD, Chemoenzymatic exchange of phosphopantetheine on protein and peptide, Chem. Sci 5 (2014) 1179–1186. 10.1039/c3sc53154f. [DOI] [PMC free article] [PubMed] [Google Scholar]
- [22].Zou Y, Yin J, Phosphopantetheinyl transferase catalyzed site-specific protein labeling with ADP conjugated chemical probes, J. Am. Chem. Soc 131 (2009) 7548–7549. 10.1021/ja902464v. [DOI] [PubMed] [Google Scholar]
- [23].Kittilä T, Cryle MJ, An enhanced chemoenzymatic method for loading substrates onto carrier protein domains, Biochem. Cell Biol 96 (2018) 372–379. 10.1139/bcb-2017-0275. [DOI] [PubMed] [Google Scholar]
- [24].Miller JR, Ohren J, Sarver RW, Mueller WT, De Dreu P, Case H, Thanabal V, Phosphopantetheine adenylyltransferase from Escherichia coli: Investigation of the kinetic mechanism and role in regulation of coenzyme A biosynthesis, J. Bacteriol 189 (2007) 8196–8205. 10.1128/JB.00732-07. [DOI] [PMC free article] [PubMed] [Google Scholar]
- [25].Geerlof A, Lewendon A, Shaw WV, Purification and characterization of phosphopantetheine adenylyltransferase from Escherichia coli, J. Biol. Chem 274 (1999) 27105–27111. 10.1074/jbc.274.38.27105. [DOI] [PubMed] [Google Scholar]
- [26].Rootman I, de Villiers M, Brand LA, Strauss E, Creating cellulose-binding domain fusions of the coenzymea biosynthetic enzymes to enable reactor-based biotransformations, ChemCatChem. 2 (2010) 1239–1251. 10.1002/cctc.201000197. [DOI] [Google Scholar]
- [27].Strauss E, de Villiers M, Rootman I, Biocatalytic Production of Coenzyme A Analogues, ChemCatChem. 2 (2010) 929–937. 10.1002/cctc.201000139. [DOI] [Google Scholar]
- [28].Gehring AM, Mori I, Perry RD, Walsh CT, The nonribosomal peptide synthetase HMWP2 forms a thiazoline ring during biogenesis of yersiniabactin, an iron-chelating virulence factor of Yersinia pestis, Biochemistry. 37 (1998) 11637–11650. 10.1021/bi9812571. [DOI] [PubMed] [Google Scholar]
- [29].Marincin KA, Pal I, Frueh DP, Using delayed decoupling to attenuate residual signals in editing filters, Magn. Reson 2 (2021) 475–487. 10.5194/mr-2-475-2021. [DOI] [PMC free article] [PubMed] [Google Scholar]
- [30].Breeze AL, Isotope-filtered NMR methods for the study of biomolecular structure and interactions, Prog. Nucl. Magn. Reson. Spectrosc 36 (2000) 323–372. 10.1016/S0079-6565(00)00020-0. [DOI] [Google Scholar]
- [31].Gemmecker G, Olejniczak ET, Fesik SW, An Improved Method for Selectively Observing Protons Attached to 12C in the Presence of 1H-13C Spin Pairs, J. Magn. Reson 96 (1992) 199–204. 10.1016/0022-2364(92)90304-P. [DOI] [Google Scholar]
- [32].Zangger K, Oberer M, Keller W, Sterk H, X-filtering for a range of coupling constants: Application to the detection of intermolecular NOEs, J. Magn. Reson 160 (2003) 97–106. 10.1016/S1090-7807(02)00176-3. [DOI] [PubMed] [Google Scholar]
- [33].Stejskal EO, Tanner JE, Spin diffusion measurements: Spin echoes in the presence of a time-dependent field gradient, J. Chem. Phys 42 (1965) 288–292. 10.1063/1.1695690. [DOI] [Google Scholar]
- [34].Tanner JE, Use of the stimulated echo in nmr diffusion studies, J. Chem. Phys 52 (1970) 2523–2526. 10.1063/1.1673336. [DOI] [Google Scholar]
- [35].Johnson CS, Diffusion ordered nuclear magnetic resonance spectroscopy: Principles and applications, Prog. Nucl. Magn. Reson. Spectrosc 34 (1999) 203–256. 10.1016/S0079-6565(99)00003-5. [DOI] [Google Scholar]
- [36].Gonnella N, Lin M, Shapiro MJ, Wareing JR, Zhang X, Isotope-Filtered Affinity NMR, J. Magn. Reson 131 (1998) 336–338. 10.1006/jmre.1997.1376. [DOI] [PubMed] [Google Scholar]
- [37].Wu DH, Chen A, Johnson CS, An Improved Diffusion-Ordered Spectroscopy Experiment Incorporating Bipolar-Gradient Pulses, J. Magn. Reson. Ser. A 115 (1995) 260–264. 10.1006/jmra.1995.1176. [DOI] [Google Scholar]
- [38].Yao S, Weber DK, Separovic F, Keizer DW, Measuring translational diffusion coefficients of peptides and proteins by pfg-nmr using band-selective rf pulses, Eur. Biophys. J 43 (2014) 331–339. 10.1007/s00249-014-0965-x. [DOI] [PubMed] [Google Scholar]
- [39].Böhlen JM, Bodenhausen G, Experimental aspects of chirp NMR spectroscopy, J. Magn. Reson. - Ser. A 102 (1993) 293–301. 10.1006/jmra.1993.1107. [DOI] [Google Scholar]
- [40].Shaka AJ, Barker PB, Freeman R, Computer-optimized decoupling scheme for wideband applications and low-level operation, J. Magn. Reson 64 (1985) 547–552. 10.1016/0022-2364(85)90122-2. [DOI] [Google Scholar]
- [41].Yin J, Lin AJ, Golan DE, Walsh CT, Site-specific protein labeling by Sfp phosphopantetheinyl transferase, Nat. Protoc 1 (2006) 280–285. 10.1038/nprot.2006.43. [DOI] [PubMed] [Google Scholar]
- [42].Meier JL, Mercer AC, Rivera H, Burkart MD, Synthesis and evaluation of bioorthogonal pantetheine analogues for in vivo protein modification, J. Am. Chem. Soc 128 (2006) 12174–12184. 10.1021/ja063217n. [DOI] [PubMed] [Google Scholar]
- [43].Wishart DS, Knox C, Guo AC, Eisner R, Young N, Gautam B, Hau DD, Psychogios N, Dong E, Bouatra S, Mandal R, Sinelnikov I, Xia J, Jia L, Cruz JA, Lim E, Sobsey CA, Shrivastava S, Huang P, Liu P, Fang L, Peng J, Fradette R, Cheng D, Tzur D, Clements M, Lewis A, de souza A, Zuniga A, Dawe M, Xiong Y, Clive D, Greiner R, Nazyrova A, Shaykhutdinov R, Li L, Vogel HJ, Forsythei I, HMDB: A knowledgebase for the human metabolome, Nucleic Acids Res. 37 (2009) 603–610. 10.1093/nar/gkn810. [DOI] [PMC free article] [PubMed] [Google Scholar]
- [44].Gowda GAN, Abell L, Tian R, Extending the Scope of 1 H NMR Spectroscopy for the Analysis of Cellular, Anal. Chem 91 (2019) 2464–2471. https://doi.org/doi: 10.1021/acs.analchem.8b05286. [DOI] [PMC free article] [PubMed] [Google Scholar]
- [45].Rucker SP, Shaka AJ, Broadband homonuclear cross polarization in 2D N.M.R. using DIPSI-2, Mol. Phys 68 (1989) 509–517. https://doi.org/ 10.1080/00268978900102331. [DOI] [Google Scholar]
Associated Data
This section collects any data citations, data availability statements, or supplementary materials included in this article.
Supplementary Materials
Data Availability Statement
All raw NMR and MALDI-TOF-MS data and the newly introduced isotope and diffusion filtered 1D NMR pulse sequence are available through Zenodo at https://doi.org/10.5281/zenodo.6660812 . Additionally, the isotope and diffusion filtered 1D NMR pulse sequence is available from https://frueh.med.jhmi.edu/software-downloads/.