Abstract
Objective
Cell division cycle 42 (CDC42) regulates neurite outgrowth, neurotransmitter, and T help (Th) cell‐mediated neuroinflammation, while its clinical implication in Alzheimer's disease (AD) is not clear. The present study aimed to investigate the correlation of CDC42 with Th1, Th2, and Th17 cells, as well as CDC42’ longitudinal change and relation to cognitive function decline in AD patients.
Methods
150 AD patients were enrolled, then their blood Th1, Th2, and Th17 cells were quantified by flow cytometry at baseline; CDC42 was detected by RT‐qPCR and MMSE score was assessed at baseline and during 3‐year follow‐up. Meanwhile, CDC42, Th1, Th2, and Th17 cells were quantified in 30 Parkinson's disease (PD) patients and 30 healthy controls (HCs).
Results
CDC42 (p < 0.001) and Th2 cells (p < 0.001) were lowest in AD patients, followed by PD patients, highest in HCs; but Th1 cells (p = 0.001) and Th17 cells (p < 0.001) showed opposite trends. CDC42 was not related to Th1 cells (p = 0.134), positively correlated with Th2 cells (p = 0.023) and MMSE (p < 0.001), while negatively associated with Th17 cells (p < 0.001) in AD patients. CDC42 was only related to Th17 cells (p = 0.048) and MMSE (p = 0.048) in PD patients; and it was not linked with Th1, Th2, Th17 cells, or MMSE in HCs (all p > 0.05). During a 3‐year follow‐up, CDC42 was gradually declined in AD patients (p < 0.001), its decline was positively correlated with MMSE decline at 1 year (p = 0.004), 2 years (p = 0.005), and 3 years (p = 0.026).
Interpretation
CDC42 might have the potency to serve as a biomarker for estimating AD risk and progression.
Introduction
Alzheimer's disease (AD) is a common neurodegenerative disease accounting for 50%–70% of total dementia patients 1 , 2 ; meanwhile, a recent data estimation forecasts its prevalence would double in Europe and then triple globally till the year 2050, not to mention the underrated clinical diagnosis than biological manifestations. 3 , 4 AD is extremely complicated with much unknown pathogenesis, at present, it's considered that extra‐cellular amyloid plaque, intra‐cellular nerve fiber tangle, synapses loss and deficits, neuroinflammation, etc., are closely involved in AD’ etiology. 5 , 6 , 7 Current treatment options (mainly donepezil, galantamine, rivastigmine, and memantine) are limited, symptomatic, and exhibit confined benefits, making AD a critically global healthy issue. 7 , 8 Therefore, exploring novel treatment target of AD is always full of vigor; apart from that, probing convenient, feasible, and novel biomarkers to assist AD management is never stopped. 9 , 10
Cell division cycle 42 (CDC42), an important Rho‐GTPase family member, is closely implicated in the neurological disorders and degenerative diseases. 11 , 12 , 13 For instance, CDC42 enhances neurite outgrowth and its cone protrusion, which serves as a momentous modifier of neural morphology 11 ; besides, investigations on applying CDC42 as therapeutic option for AD are already carried out in vitro and in vivo. 14 Clinically, altered blood CDC42 is observed in patients with frontotemporal lobar degeneration or stroke. 12 , 15 Furthermore, blood CDC42 relates to stroke severity and its decrement predicts stroke recurrence and mortality. 15 Apart from the above information, CDC42 is wildly known for its regulation on T helper (Th) cells 16 , 17 , 18 ; meanwhile, Th cells are discovered to highly relate to cognitive impairment progression in AD. 19 , 20 , 21 For instance, Th17 cells positively links with cognitive impairment in AD patients, 20 and Th1/Th2 imbalance is activated in mice after immunization with Aβ42. 22 Conclusively, CDC42 have potency to serve as a biomarker for AD progression, while related evidence is lacking.
Therefore, the present study aimed to investigate the aberrant expression and correlation of CDC42 with Th1, Th2, and Th17 cells, as well as CDC42’ longitudinal change and relation to cognitive function decline during 3‐year follow‐up in AD patients.
Methods
Subjects
A total of 150 AD patients admitted to our hospital from May 2017 to September 2018 were enrolled in this study. The enrollment criteria were: (a) confirmed as AD per the AD diagnosis clinical criteria 23 ; (b) aged older than 45 years; (c) able to cooperate in completing the evaluation of Mini‐Mental State Examination (MMSE). Patients who had the following conditions were ineligible for inclusion: (a) complicated with other neurological diseases (such as epilepsy, amyotrophic lateral sclerosis, and Huntington's disease); (b) had systemic inflammatory diseases or autoimmune diseases; (c) had a prior history of solid tumors or hematological malignant diseases.
Besides, the study also recruited 30 patients with Parkinson's disease (PD) as disease controls. The recruitment criteria for PD patients were: (a) diagnosed as PD according to the Validation of the Movement Disorder Society diagnosis criteria 24 ; (b) age‐matched to AD patients; (c) voluntary for participating in the study; (d) without other neurological diseases, systemic inflammatory diseases, autoimmune diseases cancers, or hematological malignancies; (e) willing to comply with the protocol.
Additionally, a total of 30 healthy subjects were included as healthy controls (HCs), who were required to meet the following conditions: (a) had no abnormalities in the physical examination; (b) age‐matched to AD patients; (c) had normal cognition (MMSE score > 26); (d) willing to comply with the protocol.
The study was permitted by Ethics Committee. Each subject signed the informed consent.
Data documentation and sample collection
Clinical characteristics of AD patients, PD patients, and HCs were documented after recruitment, and MMSE score was evaluated for all subjects. Peripheral blood (PB) samples were obtained from PD patients and HCs at enrollment, as well as from AD patients at baseline (n = 150), 3 months (M3, n = 143), 6 months (M6, n = 139), 1 year (Y1, n = 136), 2 years (Y2, n = 126), and 3 years (Y3, n = 113) after inclusion, then, peripheral blood mononuclear cells (PBMCs) were separated from the PB samples to detect the percentages of Th1 cells, Th2 cells, and Th17 cells, as well as CDC42 expression.
Sample detection
All subjects' PB samples at recruitment were used to examine the percentages of Th1 cells, Th2 cells, and Th17 cells by flow cytometry using the Human Th1/Th2/Th17 Phenotyping Kit (BD, USA) per the manual. Briefly, the samples were treated with ionomycin (Beyotime, China), phorbol myristic acetate (PMA) (Beyotime, China), and BD GolgiStop (BD) for 4 h. Next, the samples were incubated using fixation or permeabilization reagents, then stained with specific antibodies for a half‐hour. Finally, Th1 cells, Th2 cells, and Th17 cells were measured using FACSCanto II (BD) and then analyzed using FlowJo 7.6 software (BD).
CDC42 expression was examined with the PBMCs of PD patients at enrollment, HCs at enrollment, as well as AD patients at baseline, M3, M6, Y1, Y2, and Y3. The examination was performed by reverse transcription‐quantitative polymerase chain reaction (RT‐qPCR). In short, total RNA was isolated by TRIzol™ Reagent (Invitrogen, USA), followed by cDNA reverse transcription by iScript™ cDNA Synthesis Kit (Bio‐Rad, USA), then PCR was carried out by QuantiNova SYBR Green PCR Kit (Qiagen, Germany). The PCR condition was as follows: 95°C for 2 min, 1 cycle; 95°C for 5 s, 61°C for 30 s, 40 cycles. 2−ΔΔCt was used to calculate CDC42 expression with GAPDH as internal reference. The following primers were applied: CDC42, CCATCGGAATATGTACCGACTG (forward), and CTCAGCGGTCGTAATCTGTCA (reverse); GAPDH, GAGTCCACTGGCGTCTTCAC (forward), ATCTTGAGGCTGTTGTCATACTTCT (reverse).
Follow‐up and assessment for AD patients
Regular follow‐up was carried out for AD patients for consecutive 3 years: the patients were followed up by visit or telephone every 1–3 months. The last follow‐up date was September 30, 2021. During the follow‐up, MMSE was evaluated at Y1, Y2, and Y3 to assess the patients' cognitive impairment.
Statistics
Statistics were completed using SPSS (version 22.0, IBM Corp., USA). Graphs were made using GraphPad Prism (version 7.02, GraphPad Software Inc., USA). For analysis, CDC42 expression decline at Y1/Y2/Y3 was defined as the difference value of baseline CDC42 expression minus Y1/Y2/Y3 CDC42 expression, respectively; meanwhile, MMSE score decline at Y1/Y2/Y3 was defined as the difference value of baseline MMSE score minus Y1/Y2/Y3 MMSE score, respectively. Comparisons among groups were evaluated using Kruskal–Wallis H rank‐sum test, one‐way analysis of variance (ANOVA), and chi‐square test. Post hoc comparisons were analyzed using Bonferroni test. The feasibilities of variables as diagnostic tools for the detection of AD from PD and HCs were assessed using receiver‐operating characteristic (ROC) curves. Associations of two variables were analyzed using Spearman's rank correlation test. Changes in CDC42 expression or MMSE score over time were checked using Friedman's test or univariate repeated measures ANOVA. p < 0.05 was considered significant.
Results
Participants' characteristics
The AD patients had an age of 71.8 ± 7.0 years, consisting of 70.7% females and 29.3% males. The PD patients (disease controls) had an age of 69.8 ± 7.4 years, including 46.7% females and 53.3% males. The HCs had an age of 69.9 ± 7.9 years, making up of 60.0% females and 40.0% males. By comparison, age (p = 0.190) and education level (p = 0.961) were not different among AD patients, PD patients, and HCs; meanwhile, gender, MMSE score, Aβ42, T‐tau, and P‐tau were differed among them (all p < 0.05) (Table 1). Meanwhile, the study flow is presented in Figure 1.
Table 1.
Clinical characteristics.
| Items | AD patients (N = 150) | PD patients (N = 30) | HCs (N = 30) | P value |
|---|---|---|---|---|
| Age (years), mean ± SD | 71.8 ± 7.0 | 69.8 ± 7.4 | 69.9 ± 7.9 | 0.190 |
| Gender, No. (%) | 0.032 | |||
| Female | 106 (70.7) | 14 (46.7) | 18 (60.0) | |
| Male | 44 (29.3) | 16 (53.3) | 12 (40.0) | |
| Education level, No. (%) | 0.916 | |||
| Primary school or below | 34 (22.7) | 5 (16.7) | 6 (20.0) | |
| Middle or high school | 81 (54.0) | 16 (53.3) | 16 (53.3) | |
| Undergraduate or above | 35 (23.3) | 9 (30.0) | 8 (26.7) | |
| MMSE score, mean ± SD | 18.1 ± 3.7 | 27.1 ± 1.0 | 28.4 ± 1.0 | <0.001 |
| Aβ42 (pg/ml), median (IQR) | 363.5 (290.6–433.1) | 831.7 (726.1–1009.4) | 895.6 (664.7–975.5) | <0.001 |
| T‐tau (pg/ml), median (IQR) | 938.4 (809.1–1090.4) | 196.1 (182.9–260.6) | 231.5 (188.8–270.3) | <0.001 |
| P‐tau (pg/ml), median (IQR) | 112.6 (100.3–138.0) | 42.9 (36.4–54.0) | 50.9 (41.7–57.1) | <0.001 |
| AD duration (years), median (IQR) | 6.0 (4.0–7.0) | ‐ | ‐ | ‐ |
AD, Alzheimer's disease; PD, Parkinson's disease; HCs, healthy controls; SD, standard deviation; MMSE, Mini‐Mental State Examination; Aβ42, amyloid‐beta 1–42; IQR, interquartile range; T‐tau, total‐tau; P‐tau, phosphorylated‐tau.
Figure 1.
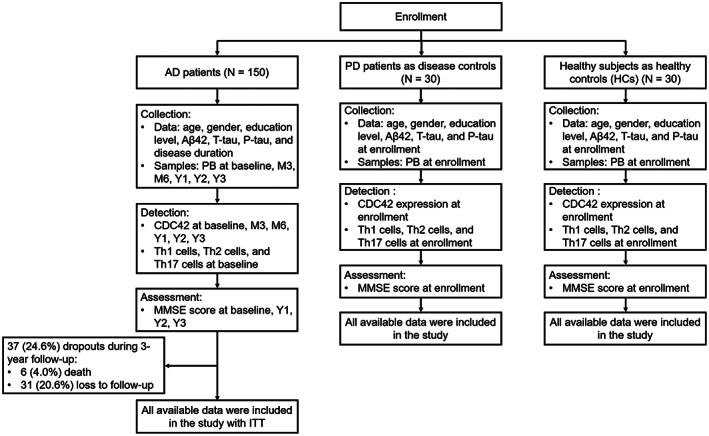
Study flowchart.
Levels of CDC42, Th1, Th2, and Th17 cells
CDC42 was different among AD patients, PD patients, and HCs (p < 0.001) by three‐group comparison; then followed post hoc two‐group comparisons revealed that CDC42 was lower in AD patients compared to PD patients (p = 0.001) and HCs (p < 0.001) (Fig. 2A). Further ROC curves exhibited that CDC42 could tell AD patients from PD patients (AUC = 0.718, 95%CI: 0.620–0.816) (Fig. 2B), and from HCs (AUC = 0.848, 95% CI: 0.778–0.919) (Fig. 2C).
Figure 2.
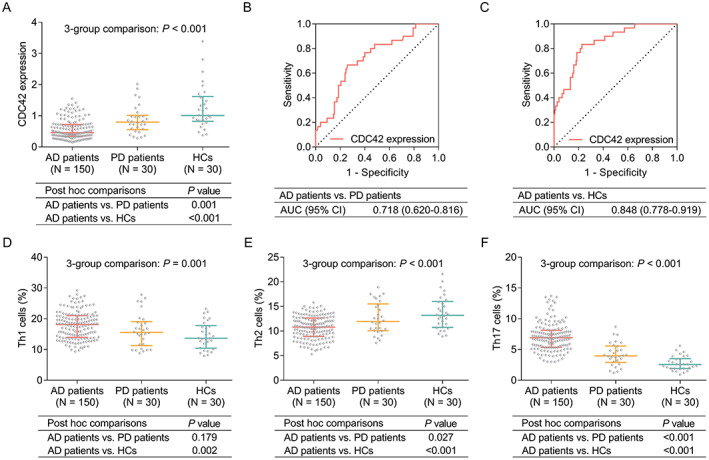
Comparison of CDC42, Th1, Th2, and Th17 cells among AD patients, PD patients, and HCs. Comparison of CDC42 among AD patients, PD patients, and HCs (A), ROC curve analysis of CDC42’s ability to tell AD patients from PD patients (B) and from HCs (C). Comparison of Th1 cells (D), Th2 cells (E), and Th17 (F) among AD patients, PD patients, and HCs.
In terms of Th1, Th2, and Th17 cells: Th1 cells (p = 0.001) (Fig. 2D) and Th17 cells (p < 0.001) (Fig. 2F) were highest in AD patients, followed by PD patients, then lowest in HCs. Meanwhile, Th2 cells exhibited a opposite trend as that of Th1/Th17 cells among them (p < 0.001) (Fig. 2E).
Correlation of CDC42 with Th1, Th2, and Th17 cells
In AD patients, CDC42 was not related to Th1 cells (p = 0.134) (Fig. 3A), while positively correlated with Th2 cells (p = 0.023) (Fig. 3B), then negatively associated with Th17 cells (p < 0.001) (Fig. 3C). In PD patients, CDC42 was not linked with Th1 cells (p = 0.150) (Fig. 3D) or Th2 cells (p = 0.103) (Fig. 3E), but was negatively correlated with Th17 cells (p = 0.048) (Fig. 3F). In HCs, CDC42 was not correlated with Th1 cells (p = 0.361) (Fig. 3G), Th2 cells (p = 0.135) (Fig. 3H), or Th17 cells (p = 0.131) (Fig. 3I).
Figure 3.
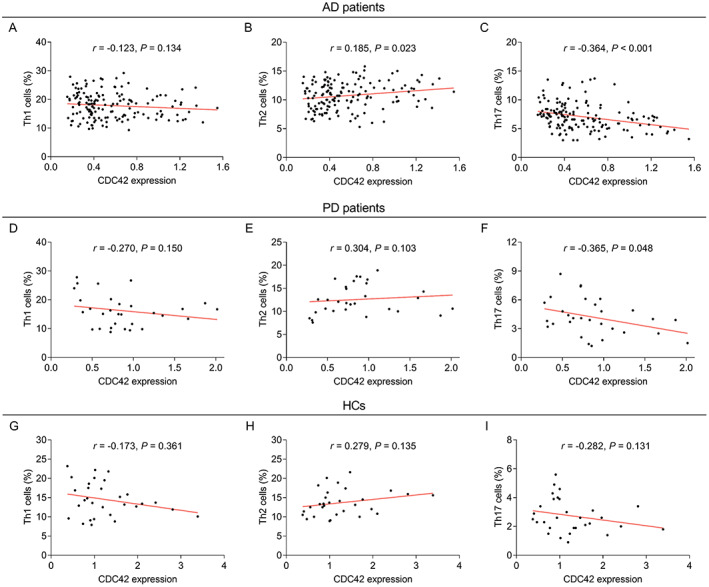
Correlation of CDC42 with Th1, Th2, and Th17 cells in AD patients, PD patients, and HCs. Correlation of CDC42 with Th1 cells (A), Th2 cells (B), and Th17 cells (C) in AD patients. Correlation of CDC42 with Th1 cells (D), Th2 cells (E), and Th17 cells (F) in PD patients. Correlation of CDC42 with Th1 cells (G), Th2 cells (H), and Th17 cells (I) in HCs.
Correlation of CDC42, Th1, Th2, and Th17 cells with MMSE score at baseline
CDC42 was positively correlated with MMSE score in AD patients (p < 0.001) (Fig. 4A) and PD patients (p = 0.048) (Fig. 4B), but was not related to MMSE score in HCs (p = 0.180) (Fig. 4C). Th1 cells and Th2 cells were not associated with MMSE score in AD patients, PD patients, or HCs (all p > 0.05) (Table 2). Meanwhile, Th17 cells was negatively correlated with MMSE score in AD patients (p = 0.001), PD patients (p = 0.012), but not in HCs (p = 0.665) (Table 2).
Figure 4.

Relation of CDC42 with MMSE score. Correlation of CDC42 with MMSE score at baseline in AD patients (A), PD patients (B), and HCs (C).
Table 2.
Correlation of Th1 cells, Th2 cells, and Th17 cells with MMSE score.
| Items | MMSE score | |
|---|---|---|
| r value | p value | |
| AD patients | ||
| Th1 cells | −0.114 | 0.164 |
| Th2 cells | 0.013 | 0.873 |
| Th17 cells | −0.271 | 0.001 |
| PD patients | ||
| Th1 cells | 0.002 | 0.990 |
| Th2 cells | 0.201 | 0.286 |
| Th17 cells | −0.454 | 0.012 |
| HCs | ||
| Th1 cells | −0.069 | 0.716 |
| Th2 cells | 0.020 | 0.918 |
| Th17 cells | 0.082 | 0.665 |
Th, T‐helper; MMSE, Mini‐Mental State Examination; AD, Alzheimer's disease; PD, Parkinson's disease; HCs, healthy controls.
CDC42’ longitudinal change and relation to cognitive function decline in AD patients
During a 3‐year follow‐up, CDC42 was gradually declined in AD patients (p < 0.001) (Fig. 5). Meanwhile, MMSE score was also declined during 3 years in AD patients (p < 0.001) (Fig. 6A). More importantly, it was discovered that CDC42 decline was positively correlated with MMSE score decline at Y1 (p = 0.004) (Fig. 6B), Y2 (p = 0.005) (Fig. 6C), and Y3 (p = 0.026) (Fig. 6D) in AD patients.
Figure 5.
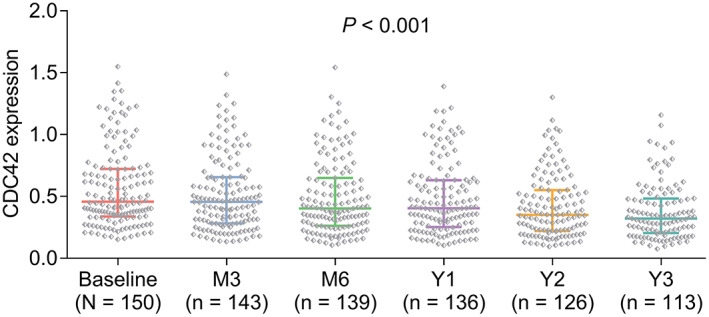
CDC42 was declined from baseline to 3 years in AD patients.
Figure 6.
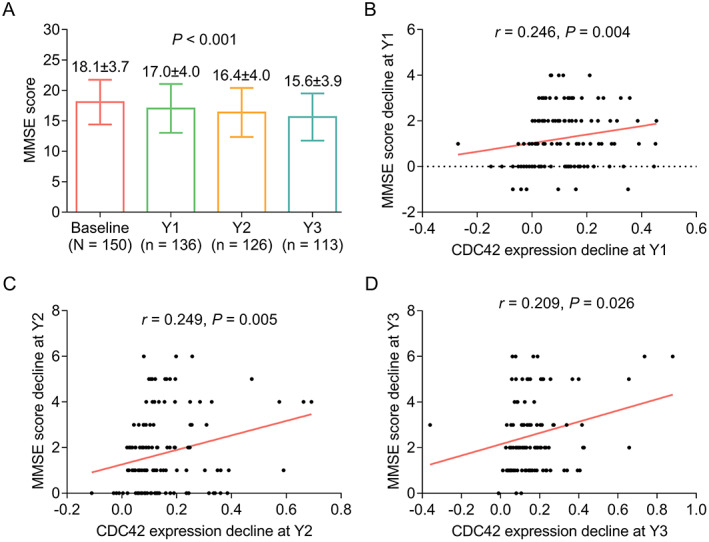
Correlation of CDC42 decline with MMSE decline in AD patients. Longitude changes of MMSE score during 3‐year follow‐up (A). Correlation between CDC42 decline and MMSE score decline at Y1 (B), Y2 (C), and Y3 (D).
Discussion
CDC42 belongs to the Rho GTPase family which is closely involved in regulating the morphogenesis and remodeling of actin‐based neuronal structures. 25 , 26 Based on these findings, the CDC42 dysregulation and its clinical value in serving as a biomarker for the neurodegenerative disease have been explored in recent studies. 27 , 28 , 29 , 30 For, instance, one study exhibits that the CDC42 is overexpressed in Huntington's disease patients. 27 Another study discloses that CDC42 serves as a differentially expressed RNA in AD patients by bioinformatics analysis from the GSE48350 data. 28 However, the study about detecting CDC42 expression in AD patients is rarely reported. In the present study, it was shown that the CDC42 was downregulated in AD patients compared with the PD patients and HCs, and it had a certain value in distinguishing them. This could be explained as that: The inhibition of CDC42 was associated with the neuron death and hippocampal neuron dendritic spine death, while the latter two phenomena were frequently observed in AD patients; therefore, CDC42 was downregulated in AD patients. 31 , 32 Besides, the study noticed that the diagnostic value of CDC42 for AD was not excellent, which might result from the circulating blood marker was not heavily affected by AD. Therefore, other markers in addition to CDC42 could be further explored.
Previous studies indicate that dysregulation of CDC42 is involved in the morphogenesis of neurons, thus, further involved in the pathogenesis of neurodegenerative disease through several mechanisms, such as regulating Th cells differentiation. 33 , 34 , 35 For instance, one study indicates that the dysregulation of CDC42 could promote the differentiation of T cells. 34 In another study, it is reported that CDC42 participates in the naïve T cells' activation and differentiation into Th1, Th2, and Th17 cells. 35 Recently, several clinical studies also determine the correlation of CDC42 with T cell differentiation in several inflammation‐related diseases (such as acute ischemic stroke and rheumatoid arthritis). 15 , 36 For instance, in rheumatoid arthritis patients, it is reported that CDC42 is negatively correlated with Th17 cells but not Th1 cells. 36 Another study conducted on acute ischemic stroke patients shows that CDC42 is positively associated with Th2 cells but negatively correlated with Th17 cells. 15 However, the correlation of CDC42 with T cell differentiation in AD patients is seldom reported. In the present study, it was exhibited that CDC42 exhibited a strong negative correlation with Th17, to a certain extent positive correlation with Th2 which revealed a similar trend to the previous study conducted in acute ischemic stroke patients. 15 These findings could be explained as that 1 : CDC42 could restrain the T cell differentiation into Th2 cell but promote its differentiation into Th17 cell, therefore, the CDC42 was positively correlated with Th17 cells while negatively associated with Th2 cells. 16 , 18
As mentioned above, CDC42 could regulate neuron death and the latter is closely related to the loss of cognitive function in AD patients. 32 Hence, the association of CDC42 with the cognitive function (reflected by MMSE) score was also checked in our study, which showed that baseline CDC42 was positively linked with the MMSE score. This phenomenon was apparently easy to understand: CDC42 served a neuron‐protective role in AD patients, and the downregulated CDC42 in AD patients indicated the loss of protection of neurons leading to an increment of neuron loss 32 ; therefore, the cognitive function was decreased in AD patients. Hence, the CDC42 was positively associated with the MMSE score. These findings generate an alternative way to monitor the cognitive function in AD patients, especially for those AD patients with dyslexia or those patients who are inconvenient to finish the MMSE questionnaire. However, further studies are needed to explore this idea.
As a neurodegenerative disease, the disease progression of AD is continuous; therefore, long‐term disease monitoring is necessary which might help the clinicians to adjust the treatment strategy timely. Hence, one innovative point of this study should be mentioned here: multiple‐time‐point CDC42 was determined in this study, and an interesting finding was shown that the CDC42 gradually decreased during the 3‐year follow‐up; besides, it could also reflect the variation of MMSE score in AD patients. These findings revealed that the cognitive‐function loss continuously occurred during the follow‐up period which was reflected by the MMSE score decrement. On the other hand, the high correlation between CDC42 variation and MMSE alteration also indicated the ability of CDC42 in monitoring the cognitive function in AD patients. Thus, the regular determining of CDC42 in AD patients is meaningful for the patients to better manage their disease progression, and for the neurologist to make the corresponding treatment strategy timely.
Some specific issues could be also mentioned. Firstly, since blood CDC42 and Th cells would be greatly affected by systemic inflammatory diseases or autoimmune diseases; therefore, “had systemic inflammatory diseases or autoimmune diseases” was set as an exclusion. Secondly, Th17/Treg imbalance is an important process during AD, while Treg was not evaluated in our study. Besides, due to that the samples were not available now, its level could not be detected at present. Thirdly, PD is a common disease control set to AD, therefore PD patients were enrolled as disease controls in this study.
Despite the innovation of the present study, some limitations still existed 1 : Some studies had illuminated that the Rho GTPase family members (such as Rho, Rac, and Cdc42) might be involved in the pathogenesis of AD, while due to the limitation of the fund, only CDC42 was determined in our study; further study that generated a new biomarker (a panel containing the Rho GTPase family members) could be conducted to elevate the utility of this biomarker in estimating the prognosis of AD patients 2 ; Even though 150 AD patients were enrolled in this study, and CDC42 had been determined in these patients for multiple‐time‐point, however, the sample size was still not large enough to make a solid conclusion, and the follow‐up period was still relatively short 3 ; The detailed mechanism of CDC42 involving the pathogenesis of AD patients still needed further exploration.
Conclusions
In conclusion, CDC42 is downregulated and relates to Th2 and Th17 cells in AD patients; meanwhile, it gradually reduced during a 3‐year follow‐up, and the decrement is linked with cognitive function decline in AD patients. These indicate CDC42 might have potency to serve as a biomarker for AD progression.
Conflicts of Interest
The authors declare that they have no conflict of interest.
Acknowledgment
None.
References
- 1. Zhang XX, Tian Y, Wang ZT, Ma YH, Tan L, Yu JT. The epidemiology of Alzheimer's disease modifiable risk factors and prevention. J Prev Alzheimers Dis. 2021;8:313‐321. [DOI] [PubMed] [Google Scholar]
- 2. Tahami Monfared AA, Byrnes MJ, White LA, Zhang Q. Alzheimer's disease: epidemiology and clinical progression. Neurol Ther. 2022;11:553‐569. [DOI] [PMC free article] [PubMed] [Google Scholar]
- 3. Scheltens P, De Strooper B, Kivipelto M, et al. Alzheimer's disease. Lancet. 2021;397:1577‐1590. [DOI] [PMC free article] [PubMed] [Google Scholar]
- 4. Lopez OL, Kuller LH. Epidemiology of aging and associated cognitive disorders: prevalence and incidence of Alzheimer's disease and other dementias. Handb Clin Neurol. 2019;167:139‐148. [DOI] [PubMed] [Google Scholar]
- 5. Ju Y, Tam KY. Pathological mechanisms and therapeutic strategies for Alzheimer's disease. Neural Regen Res. 2022;17:543‐549. [DOI] [PMC free article] [PubMed] [Google Scholar]
- 6. Onyango IG, Jauregui GV, Carna M, et al. Neuroinflammation in Alzheimer's disease. Biomedicine. 2021;9:524. [DOI] [PMC free article] [PubMed] [Google Scholar]
- 7. Vaz M, Silvestre S. Alzheimer's disease: recent treatment strategies. Eur J Pharmacol. 2020;887:173554. [DOI] [PubMed] [Google Scholar]
- 8. Cummings JL, Tong G, Ballard C. Treatment combinations for Alzheimer's disease: current and future pharmacotherapy options. J Alzheimers Dis. 2019;67:779‐794. [DOI] [PMC free article] [PubMed] [Google Scholar]
- 9. Mahaman YAR, Embaye KS, Huang F, et al. Biomarkers used in Alzheimer's disease diagnosis, treatment, and prevention. Ageing Res Rev. 2022;74:101544. [DOI] [PubMed] [Google Scholar]
- 10. Leuzy A, Mattsson‐Carlgren N, Palmqvist S, Janelidze S, Dage JL, Hansson O. Blood‐based biomarkers for Alzheimer's disease. EMBO Mol Med. 2022;14:e14408. [DOI] [PMC free article] [PubMed] [Google Scholar]
- 11. Chen C, Wirth A, Ponimaskin E. Cdc42: an important regulator of neuronal morphology. Int J Biochem Cell Biol. 2012;44:447‐451. [DOI] [PubMed] [Google Scholar]
- 12. Saraceno C, Catania M, Paterlini A, et al. Altered expression of circulating Cdc42 in frontotemporal lobar degeneration. J Alzheimers Dis. 2018;61:1477‐1483. [DOI] [PubMed] [Google Scholar]
- 13. Yang Y, Zhang K, Chen X, et al. SVCT2 promotes neural stem/progenitor cells migration through activating CDC42 after ischemic stroke. Front Cell Neurosci. 2019;13:429. [DOI] [PMC free article] [PubMed] [Google Scholar]
- 14. Aguilar BJ, Zhu Y, Lu Q. Rho GTPases as therapeutic targets in Alzheimer's disease. Alzheimers Res Ther. 2017;9:97. [DOI] [PMC free article] [PubMed] [Google Scholar]
- 15. Cheng X, Ye J, Zhang X, Meng K. Longitudinal variations of CDC42 in patients with acute ischemic stroke during 3‐year period: correlation with CD4(+) T cells, disease severity, and prognosis. Front Neurol. 2022;13:848933. [DOI] [PMC free article] [PubMed] [Google Scholar]
- 16. Kalim KW, Yang JQ, Li Y, Meng Y, Zheng Y, Guo F. Reciprocal regulation of glycolysis‐driven Th17 pathogenicity and regulatory T cell stability by Cdc42. J Immunol. 2018;200:2313‐2326. [DOI] [PMC free article] [PubMed] [Google Scholar]
- 17. Zhou M, Wu J, Tan G. The relation of circulating cell division cycle 42 expression with Th1, Th2, and Th17 cells, adhesion molecules, and biochemical indexes in coronary heart disease patients. Ir J Med Sci. 2021. Online ahead of print. 10.1007/s11845-021-02836-4 [DOI] [PubMed] [Google Scholar]
- 18. Yang JQ, Kalim KW, Li Y, et al. Rational targeting Cdc42 restrains Th2 cell differentiation and prevents allergic airway inflammation. Clin Exp Allergy. 2019;49:92‐107. [DOI] [PMC free article] [PubMed] [Google Scholar]
- 19. Machhi J, Yeapuri P, Lu Y, et al. CD4+ effector T cells accelerate Alzheimer's disease in mice. J Neuroinflammation. 2021;18:272. [DOI] [PMC free article] [PubMed] [Google Scholar]
- 20. Zeng J, Liu J, Qu Q, Zhao X, Zhang J. JKAP, Th1 cells, and Th17 cells are dysregulated and inter‐correlated, among them JKAP and Th17 cells relate to cognitive impairment progression in Alzheimer's disease patients. Ir J Med Sci. 2021;191:1855‐1861. [DOI] [PubMed] [Google Scholar]
- 21. Cipollini V, Anrather J, Orzi F, Iadecola C. Th17 and cognitive impairment: possible mechanisms of action. Front Neuroanat. 2019;13:95. [DOI] [PMC free article] [PubMed] [Google Scholar]
- 22. Town T, Vendrame M, Patel A, et al. Reduced Th1 and enhanced Th2 immunity after immunization with Alzheimer's beta‐amyloid(1‐42). J Neuroimmunol. 2002;132:49‐59. [DOI] [PubMed] [Google Scholar]
- 23. McKhann G, Drachman D, Folstein M, Katzman R, Price D, Stadlan EM. Clinical diagnosis of Alzheimer's disease: report of the NINCDS‐ADRDA work group under the auspices of Department of Health and Human Services Task Force on Alzheimer's disease. Neurology. 1984;34:939‐944. [DOI] [PubMed] [Google Scholar]
- 24. Postuma RB, Poewe W, Litvan I, et al. Validation of the MDS clinical diagnostic criteria for Parkinson's disease. Mov Disord. 2018;33:1601‐1608. [DOI] [PubMed] [Google Scholar]
- 25. Pichaud F, Walther RF, Nunes de Almeida F. Regulation of Cdc42 and its effectors in epithelial morphogenesis. J Cell Sci. 2019;132:jcs217869. [DOI] [PubMed] [Google Scholar]
- 26. Johnson DI. Cdc42: an essential rho‐type GTPase controlling eukaryotic cell polarity. Microbiol Mol Biol Rev. 1999;63:54‐105. [DOI] [PMC free article] [PubMed] [Google Scholar]
- 27. Seefelder M, Kochanek S. A meta‐analysis of transcriptomic profiles of Huntington's disease patients. PLoS One. 2021;16:e0253037. [DOI] [PMC free article] [PubMed] [Google Scholar]
- 28. Xu H, Jia J. Immune‐related hub genes and the competitive endogenous RNA network in Alzheimer's disease. J Alzheimers Dis. 2020;77:1255‐1265. [DOI] [PubMed] [Google Scholar]
- 29. Odumpatta R, Arumugam M. Integrative analysis of gene expression and regulatory network interaction data reveals the protein kinase C family of serine/threonine receptors as a significant druggable target for Parkinson's disease. J Mol Neurosci. 2021;71:466‐480. [DOI] [PubMed] [Google Scholar]
- 30. Chi J, Xie Q, Jia J, et al. Integrated analysis and identification of novel biomarkers in Parkinson's disease. Front Aging Neurosci. 2018;10:178. [DOI] [PMC free article] [PubMed] [Google Scholar]
- 31. Cai Y, Sun Z, Jia H, et al. Rpph1 upregulates CDC42 expression and promotes hippocampal neuron dendritic spine formation by competing with miR‐330‐5p. Front Mol Neurosci. 2017;10:27. [DOI] [PMC free article] [PubMed] [Google Scholar]
- 32. Crocker SJ, Hayley SP, Smith PD, et al. Regulation of axotomy‐induced dopaminergic neuron death and c‐Jun phosphorylation by targeted inhibition of cdc42 or mixed lineage kinase. J Neurochem. 2006;96:489‐499. [DOI] [PubMed] [Google Scholar]
- 33. Zong W, Gouda M, Cai E, et al. The antioxidant phytochemical Schisandrin a promotes neural cell proliferation and differentiation after ischemic brain injury. Molecules. 2021;26:7466. [DOI] [PMC free article] [PubMed] [Google Scholar]
- 34. Guo F, Zhang S, Tripathi P, et al. Distinct roles of Cdc42 in thymopoiesis and effector and memory T cell differentiation. PLoS One. 2011;6:e18002. [DOI] [PMC free article] [PubMed] [Google Scholar]
- 35. Guo F. RhoA and Cdc42 in T cells: are they targetable for T cell‐mediated inflammatory diseases? Precis Clin Med. 2021;4:56‐61. [DOI] [PMC free article] [PubMed] [Google Scholar]
- 36. Li Y, Yang W, Wang F. The relationship of blood CDC42 level with Th1 cells, Th17 cells, inflammation markers, disease risk/activity, and treatment efficacy of rheumatoid arthritis. Ir J Med Sci. 2021. Online ahead of print. 10.1007/s11845-021-02858-y [DOI] [PMC free article] [PubMed] [Google Scholar]


