Abstract
We are able to temporally organize multiple movements in a purposeful manner in everyday life. Both the dorsal premotor (PMd) area and pre-supplementary motor area (pre-SMA) are known to be involved in the performance of motor sequences. However, it is unclear how each area differentially contributes to controlling multiple motor sequences. To address this issue, we recorded single-unit activity in both areas while monkeys (one male, one female) performed sixteen motor sequences. Each sequence comprised either a series of two identical movements (repetition) or two different movements (nonrepetition). The sequence was initially instructed with visual signals but had to be remembered thereafter. Here, we showed that the activity of single neurons in both areas transitioned from reactive- to predictive encoding while motor sequences were memorized. In the memory-guided trials, in particular, the activity of PMd cells preferentially represented the second movement (2M) in the sequence leading to a reward generally regardless of the first movement (1M). Such activity frequently began even before the 1M in a prospective manner, and was enhanced in nonrepetition sequences. Behaviorally, a lack of the activity enhancement often resulted in premature execution of the 2M. In contrast, cells in pre-SMA instantiated particular sequences of actions by coordinating switching or nonswitching movements in sequence. Our findings suggest that PMd and pre-SMA play complementary roles within behavioral contexts: PMd preferentially controls the movement that leads to a reward rather than the sequence per se, whereas pre-SMA coordinates all elements in a sequence by integrating temporal orders of multiple movements.
SIGNIFICANCE STATEMENT Although both dorsal premotor (PMd) area and pre-supplementary motor area (pre-SMA) are involved in the control of motor sequences, it is not clear how these two areas contribute to coordination of sequential movements differently. To address this issue, we directly compared neuronal activity in the two areas recorded while monkeys memorized and performed multiple motor sequences. Our findings suggest that PMd preferentially controls the final action that ultimately leads to a reward in a prospective manner, whereas the pre-SMA coordinates switching among multiple actions within the context of the sequence. Our findings are of significance to understand the distinct roles for motor-related areas in the planning and executing motor sequences and the pathophysiology of apraxia and/or Parkinson's diseases that disables skilled motor actions.
Keywords: dorsal premotor area, memory, monkey, motor sequence, presupplementary motor area, single-unit
Introduction
Much of our goal-directed behavior comprises multiple movements. These could be either repetition of the same movement or a series of appropriately ordered different movements. A good example of the latter is the action sequence to open a locked door: one has to first turn a key to unlock it before turning the door knob. Lashley (1951) called the problem of integrating specific motor elements into a temporal sequence the “action syntax” problem. Occasionally, one may prematurely turn or try to turn the door knob before unlocking the door. This type of error is analogous to what Lashley referred to as “misplacement” or “anticipation” during typing. Despite accumulated evidence on the medial sector of the frontal higher motor areas concerning temporal organization of multiple movements (for review, see Tanji, 2001), the paucity of knowledge about the lateral sector has limited our understanding of each sector's role in reference to the other.
It has been established that the medial motor areas [supplementary motor area (SMA) and pre-SMA] play critical roles in the performance of sequential movements (Tanji, 2001). Single-unit recordings of primates (Mushiake et al., 1991; Shima and Tanji, 2000; Nakajima et al., 2009, 2013) have demonstrated selective activity for particular motor sequences. In humans, the involvement of these areas in the organization of complex motor sequences has been shown in imaging studies (Roland et al., 1980) and single-unit recordings (Amador and Fried, 2004). These findings comply with the reported disturbance in the temporal organization of movements caused by lesions affecting these areas (Lurii︠a︡, 1966; Laplane et al., 1977) and transcranial magnetic stimulation (Gerloff et al., 1997). In particular, pre-SMA has been implicated in learning motor sequences (Nakamura et al., 1998, 1999), updating motor plans (Matsuzaka and Tanji, 1996; Shima et al., 1996), and switching from automatic to volitional actions (Isoda and Hikosaka, 2007). However, these studies did not address the role of this area in switching between different movements that constitute a sequence.
The dorsal premotor area (PMd), a part of the lateral surface of the frontal lobe, has been classically implicated in motor planning and execution (Kurata and Wise, 1988; di Pellegrino and Wise, 1993; Crammond and Kalaska, 2000). Subsequent studies have implicated PMd activity in covert mental rehearsal (Cisek and Kalaska, 2004) and simultaneous encoding of multiple potential movement options (Cisek and Kalaska, 2005). Furthermore, competitive representation of options is biased by the value associated with each option (Pastor-Bernier and Cisek, 2011). Regarding the performance of motor sequences, Mushiake et al. (1991) pointed out the potential involvement of PMd. However, the area was overlooked until more recent studies highlighted its role in planning and executing spatial motor sequences (Shanechi et al., 2012; Ohbayashi et al., 2016). Although these studies lead us to postulate that PMd works together with pre-SMA for temporal organization of multiple movements, it remains unclear how these areas collaborate.
To allow for a comparison of cell activity responsible for the preparation and execution of motor sequence between these areas, it is necessary to minimize the effects of the visuospatial aspect in a behavioral task. This is because activity in both pre-SMA (Matsuzaka and Tanji, 1996; Hoshi and Tanji, 2004) and PMd (Boussaoud and Wise, 1993; Crammond and Kalaska, 1994; Raos et al., 2004; Hoshi and Tanji, 2006) reflects the visual attributes of cues. Controlling the visuospatial aspect, we aimed to investigate the activity in pre-SMA and PMd in terms of the following aspects: (1) the extent to which movement representation is rank-order specific; (2) activity transition from reactive- to predictive encoding; (3) activity modification concerning switching movements in a sequence; and (4) the predictability of the erroneous performance. Thus, we characterized encoding property of single-unit activity recorded in both areas while monkeys performed multiple motor sequences initially under visual guidance and thereafter from memory. We discuss the distinct roles of PMd and pre-SMA in the performance of multiple motor sequences.
Materials and Methods
Experimental model and subject details
Two Japanese monkeys [Macaca fuscata; monkeys N (female, weighing 6.0 kg) and L (male, 8.0 kg)] were cared for at Tohoku University in accordance with the Regulations for Animal Experiments and Related Activities published by Tohoku University. Monkey N was used in our previous experiments (Nakajima et al., 2009, 2013). All experiments were approved by the Institutional Animal Care and Use Committee of Tohoku University Environmental and Safety Committee.
Behavioral task
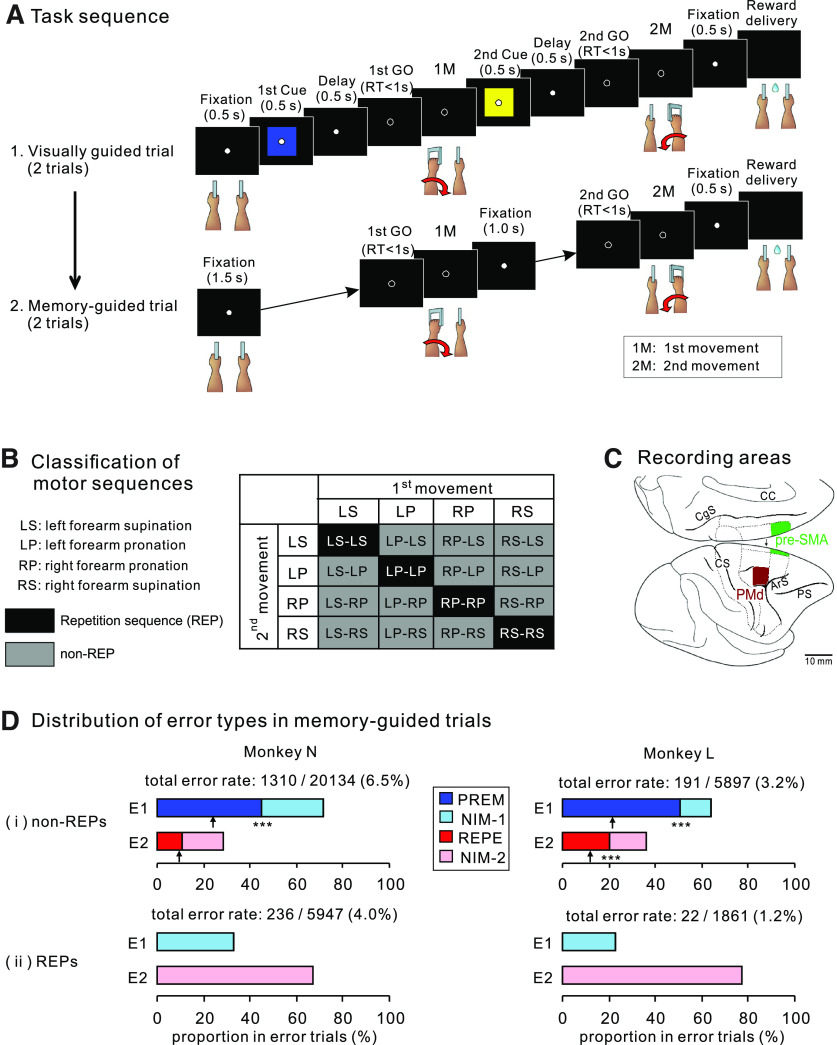
We trained the monkeys to memorize and perform a motor sequence comprising two movements. An experimental session was divided into blocks, each of which consisted of three trial conditions: the first and second visually guided (VIS1 and VIS2, respectively) trials followed by memory-guided trials (MEMs). In each VIS trial, the animals had to perform a sequence of two movements in response to colored cues presented one after the other with an intervening delay. The color of the cue indicated left forearm supination (red) or pronation (blue), and right forearm pronation (yellow) or supination (green). These movements were abbreviated as LS, LP, RP, and RS, respectively. The animals had to memorize the particular motor sequence while performing it twice in the two VISs. In the subsequent MEMs, the animal performed the motor sequence instructed in the previous VISs with no visual cues twice. As shown in Figure 1A, at the onset of a trial, the animal had to place the two handles in the neutral position with eyes fixated on the central fixation point (FP) on the screen in front. The monkey was required to maintain handle placement and eye fixation for 1.5 s, during which the instructional cue for the first movement (1M) was presented for 0.5 s in the VISs. Subsequently, the FP was dimmed, which served as 1M-trigger signal (first GO). The animal was required to perform the 1M within the reaction-time limit (1 s), and the handle was returned to the neutral position. After a delay period of 1 s, during which the instructional cue for the second movement (2M) was presented for 0.5 s (in the VISs), the animal was given the trigger signal for 2M (second GO). In the MEM, the monkey was required to wait 1.5 s before the first GO and 1 s before the second GO, during which only the FP was presented on the screen during these intervals. A series of correct movements without a fixation break was rewarded with the delivery of juice 500-ms later, followed by a 1.5-s interval before the next trial. During this interval, the FP was not presented on the screen and eye fixation was not required. After the two MEMs were completed, an auditory signal indicated the end of the current block and the beginning of a new block, where a new sequence was selected pseudorandomly.
Figure 1.
Behavioral task, recording areas, and task performance. A, Task sequence of events in an example trial block of a behavioral task. The top row illustrates an example of a visually guided trial (VIS), in which the animals performed a series of two movements in accordance with two cues. The monkey was required to memorize a particular motor sequence (left forearm pronation–right forearm pronation in this example) while performing the visually guided trials twice. The bottom row depicts a memory-guided trial (MEM) in which the order of the two movements is memorized; only the GO signals are given. In MEMs, the memorized motor sequence was performed twice. B, Classification of motor sequences performed by the monkeys. A matrix of 16 motor sequences determines the order of pronation or supination of the forearm. Shaded cells in the matrix indicate repetition sequences (REPs, black) and nonrepetition sequences (non-REPs, gray). C, Recorded areas. Medial view of the right cerebrum upside-down (top) and lateral view (bottom). Rostral is to the right in both views. Recorded areas are shaded light gray (PMd) or dark gray (pre-SMA). CC, corpus callosum; CgS, cingulate sulcus; CS, central sulcus; ArS, arcuate sulcus; PS, principal sulcus. D, Classifications of error trials when each monkey had to perform (i) non-REPs and (ii) REPs from memory. Each pair of bar graphs indicates the percentage of errors that occurred in the 1M (E1) and 2M (E2). For i, errors in the 1M are classified into PREM and NIM-1 errors, whereas the errors in the 2M are subdivided into REPE and NIM-2 errors. The upward arrow under each bar indicates the chance level of the occurrence ratio (1:2) for PREM versus NIM-1 errors and that for REP versus NIM-2 errors; ***p < 0.001. For ii, note that PREM or REPE errors cannot be determined for REPs by definition.
A total of 16 motor sequences were presented in an entire recording (Fig. 1B), and a sequence was classified according to whether it comprised a series of two identical movements (repetition sequence; REP) or two different movements (nonrepetition sequence; non-REP). Data for a given sequence were recorded for at least three blocks, which included at least six MEMs.
Surgery
After 18 months of training, the monkeys performed MEMs at a correct rate of >90%. Two acrylic recording chambers and head-fixation bolts were implanted on the skull of each animal under aseptic conditions. For both monkeys, a chamber covering both pre-SMA and bolts was implanted during the initial surgery, and the other covering PMd in the right hemisphere was placed during the second surgery. Each surgery was performed under general anesthesia using ketamine hydrochloride (10 mg/kg, i.m.) and pentobarbital sodium (30 mg/kg, i.m.) with atropine sulfate (0.02 mg/kg, s.c.). Antibiotics and analgesics were used to prevent postsurgical infection and pain. A recovery period of two weeks was allowed after each surgery.
Recordings
After complete recovery from the surgery, we localized PMd (Hoshi and Tanji, 2002) and pre-SMA (Luppino et al., 1991; Matsuzaka et al., 1992) based on previously established physiological criteria (sensory response profiles and microstimulation effects). Thereafter, single-unit recordings were made in the right PMd and pre-SMA in both hemispheres using either a glass-insulated Elgiloy microelectrode or linear arrays, which were inserted through the dura mater using a hydraulic microdrive (MO-81; Narishige). Cells in the two areas were simultaneously recorded in some experimental sessions. The linear arrays were Plexon U-probes with platinum-iridium recording sites and 16 channels spaced 150 μm apart. Online data collection was performed using a multichannel acquisition processor (Plexon). Single-unit activity was sorted using spike-sorting software (Offline Sorter, Plexon). The sorted unit activity was stored with a record of behavioral events on a computer hard drive. Statistical analyses were performed using R software (version 3.4.2; R Core Development Team). For monkey N, we recorded the activity of 46 forelimb and axial muscles using electromyography. Although these muscles exhibited movement-related activity, no consistent changes in activity occurred before the execution of movement. Eye position was monitored using an infrared corneal reflection monitoring system at 1 kHz (Millennium G200, Matrox).
Experimental design and statistical analysis
Classification of instantaneous neuronal activities and task-related cells
The interval used in the data analysis started 2.5 s before the onset of 1M and ended 0.5 s after the onset of 2M. Instantaneous spike counts during the interval were calculated with a 200-ms centered sliding bin that stepped across the analysis interval in 20-ms increments. To characterize the time course of the effect of 1M and 2M on cell activity, we conducted a two-way ANOVA on the distribution of spike counts in a bin by using each movement as the main factor. This allowed us to determine the significance of the two factors and their interaction, and to estimate the effect size of each factor. The effect size was calculated as η2, which is the ratio of the effect variance () to the total variance (; Zar, 2010). When any main effect and/or the interaction was significant for the activity in a given bin, we classified the activity into one of the following three groups. 1M-selective activity, which was significantly (p < 0.01) influenced by 1M and met the following condition:
where and represent the for 1M and 2M, and represents for the interaction.
2M-selective activity, which was significantly (p < 0.01) influenced by 2M and satisfied the following condition:
Sequence-selective activity, which was significantly (p < 0.01) influenced by either of the main factors and/or their interaction but satisfied neither of the abovementioned formulas.
Because these three groups were mutually exclusive, activity of a cell during one single bin could not be classified into more than one group. A cell was defined as “task-related” if its activity was classified as one of the three groups described above for at least five consecutive bins. If the cell activity was 1M selective for five consecutive bins during the interval analyzed, the onset time of 1M-selective activity was defined as the center of the first bin in which the activity satisfied the criteria. The onset times and duration of both 2M-selective activity and sequence-selective activity were defined in similar ways.
Our database included task-related cells defined in the MEMs. These cells were primarily classified into the following four groups based on their activity in MEMs. 1M-specific (1MS) cells, for which the onset of 1M-selective activity could be defined but the onset of 2M-selective activity could not; 2M-specific (2MS) cells, for which the onset of 2M-selective activity could be defined but the onset of 1M-selective activity could not; RNS cells, for which the onset of both 1M-selective and 2M-selective activity could be defined; and SEQ cells, for which the onset of only sequence-selective activity could be defined.
To characterize how the presence of visual cues affected the task-related information conveyed by cell activity, we further classified the cells in each of the above four groups according to the activity in VIS1. This classification was performed in a similar manner. Briefly, we first determined whether the cell exhibited task-related activity in VIS1. If it did, the encoding property of the cell in VIS1 was classified as 1MS, 2MS, RNS, or SEQ type.
Correlation in selectivity for 2M between visually guided trials and memory-guided trials
Despite potential influence of visual cues on cell activity in VISs, the activity in VISs and that in MEMs could exhibit similar selectivity for movements. To quantify the correlation in the selectivity for 2M between VIS1 and MEMs, in particular, we chose the 2MS and RNS cells that also exhibited 2M-selective activity in VIS1. For each of these cells, we identified the bin that yielded maximum η2 for 2M (e.g., Fig. 2C, shaded area) and applied a bootstrap method for the activity that occurred in the bin. Specifically, we classified MEMs into 4 groups with respect to 2M, regardless of 1M, and randomly selected a trial from each group. We subsequently counted the spikes that occurred within the bin for each selected trial and generated a vector:
where denotes the spike count in the trial whose 2M was X. In a similar way, we constructed a vector for VIS1 using the bin at which η2 for 2M peaked (Fig. 2A, shaded area):
where denotes the spike count in the trial whose 2M was X.
Figure 2.
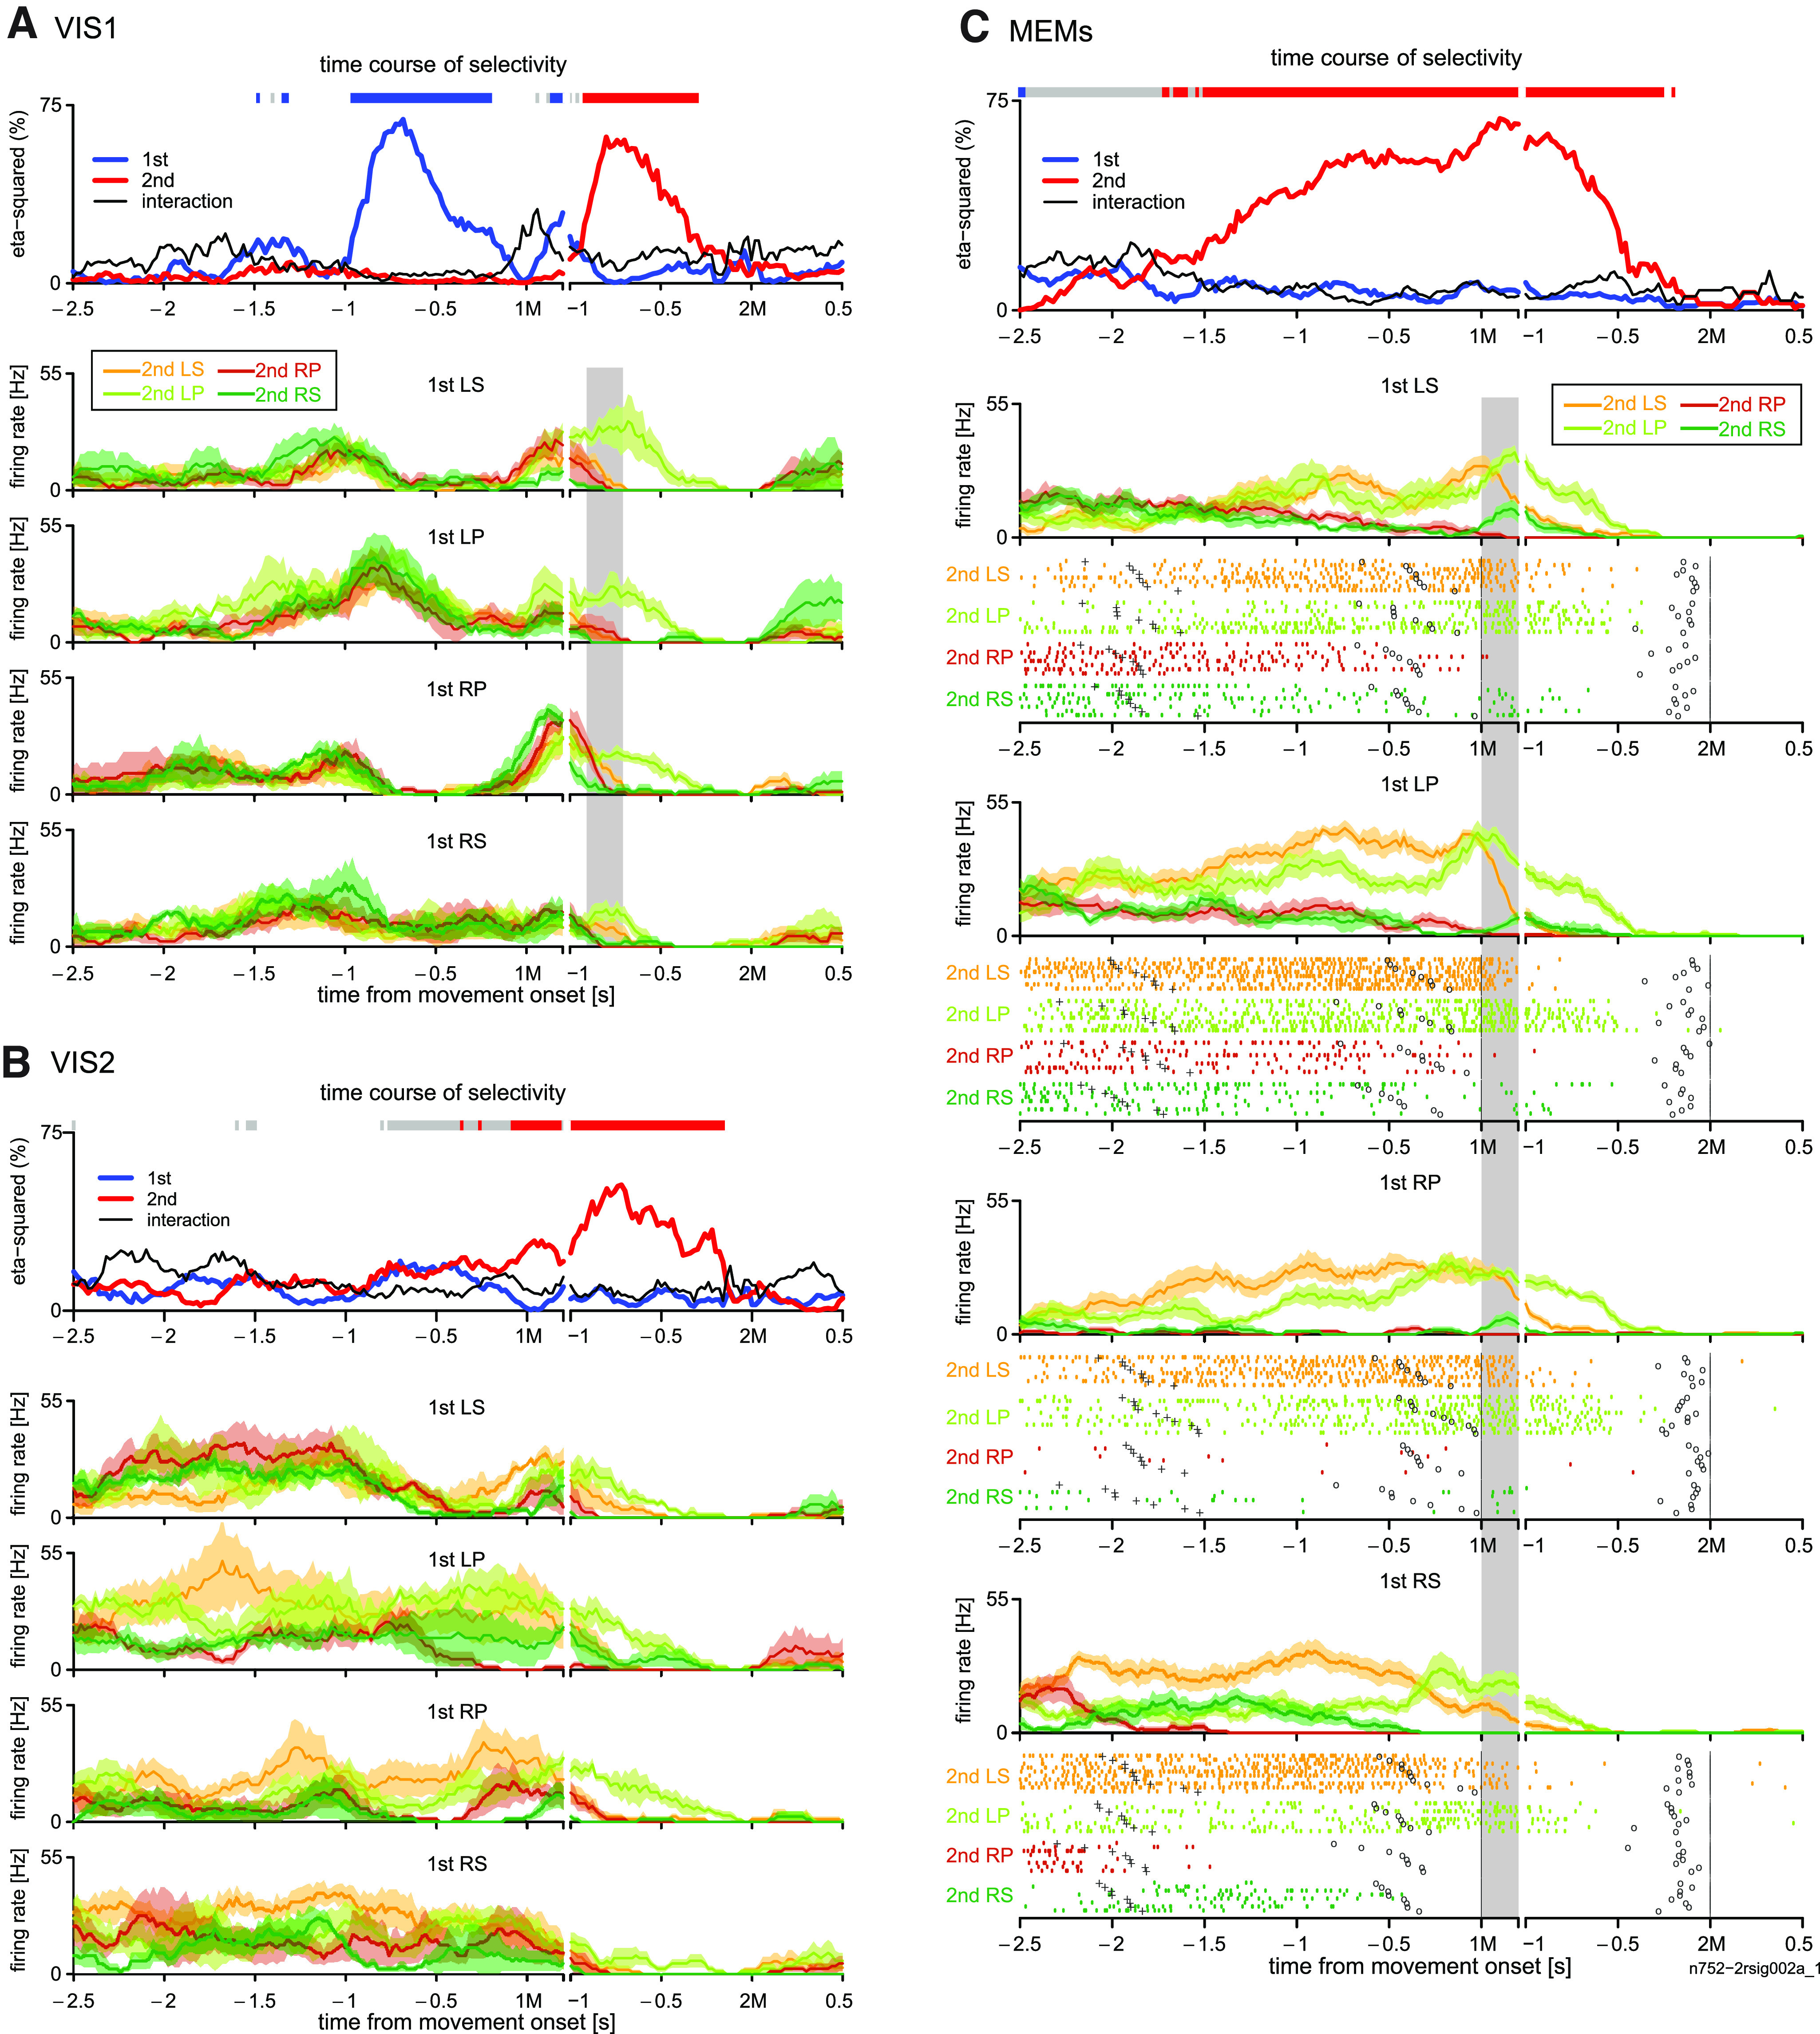
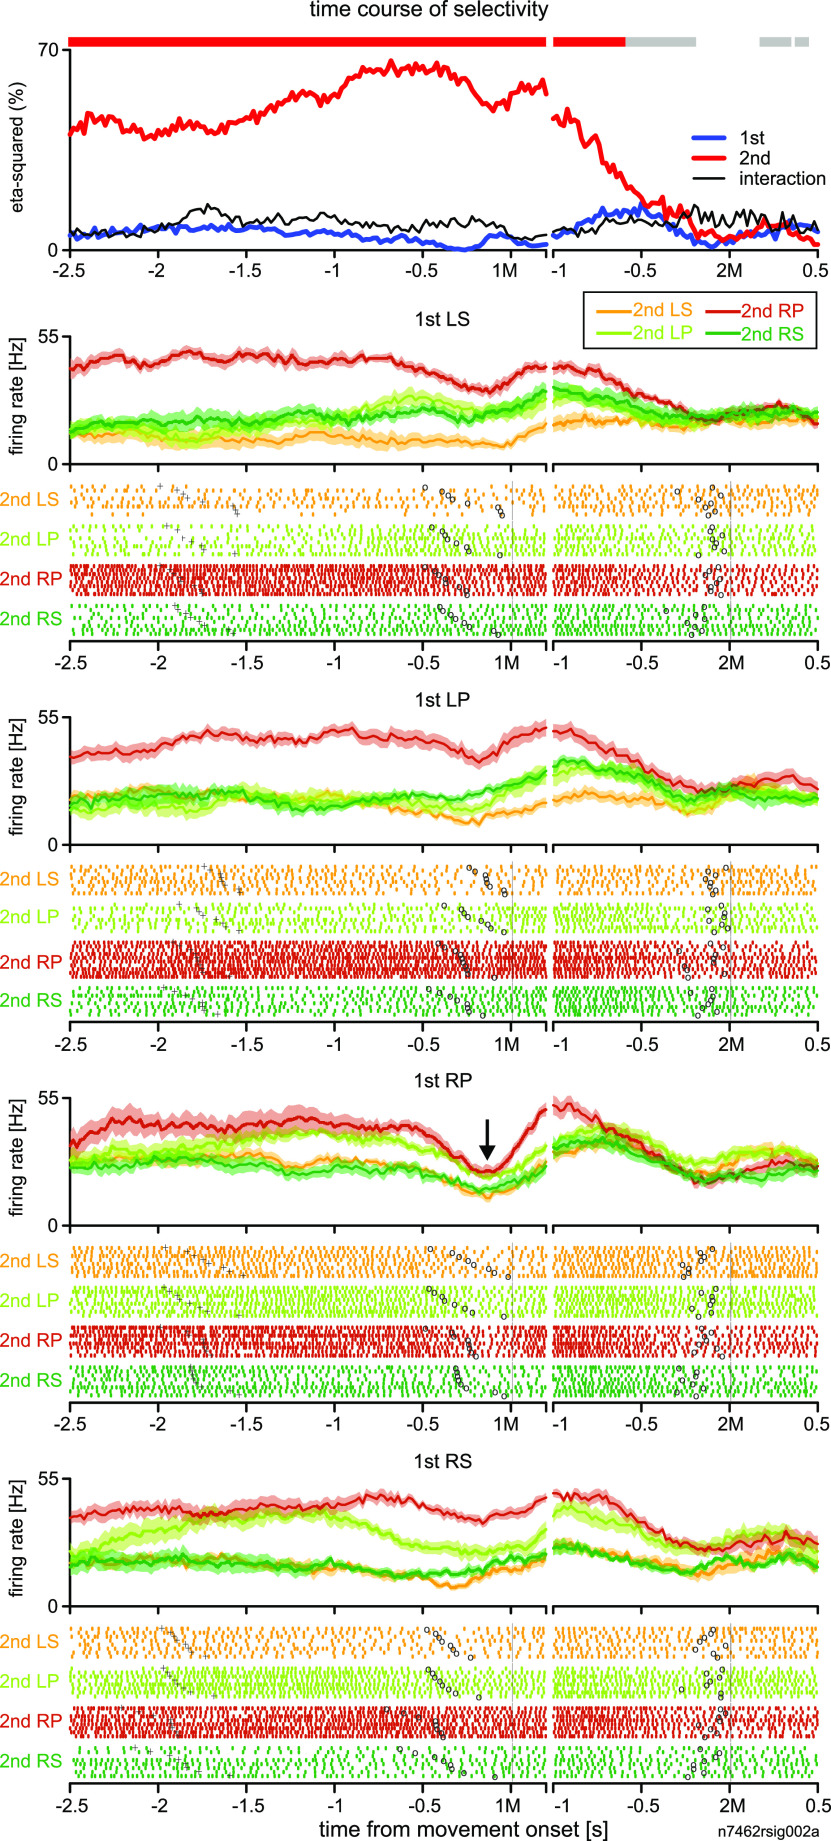
Transition of encoding property in example 2MS cell in PMd. A, B, Activity of an example 2MS cell in PMd during the analysis interval, which starts 2.5 s before the 1M and ends 0.5 s after the 2M in the first (A) and second (B) visually guided trials. In each panel, the top row visualizes the time course of moment-to-moment η2 values that explain the 1M (thick blue trace), 2M (thick red trace), and interaction of the two factors (thin black trace), on which selectivity of activity in the analysis interval is indicated with horizontal segments colored in blue (1M selective), red (2M selective), or gray (sequence selective). For display purposes, we adjusted variation of the interval between the two movements by inserting a gap between 200 ms after the 1M onset and 1 s before the 2M. The bottom four rows display perievent histograms (PEHs) for instantaneous firing rates (mean ± SE) for each sequence sorted by the 1M and then color-coded with respect to the 2M (see C, inset). C, Time course of the activity of the same cell as (A, B) in memory-guided trials. The display format for the top row and PEHs are the same as for A, B. Rastergrams under each PEH depict temporal distribution of spiking activity of the cell color-coded by the 2M. +, initiation of a trial; o, occurrence of a GO signal. The shaded areas in A, C, denote the bins where the η2 for 2M peaked.
The above procedure was repeated 1000 times, and we computed the Pearson's correlation coefficient between and for each iteration. We defined the mean of the coefficient values as V-M correlation index of the cell. The index takes a value between −1 and 1. As the selectivity for 2M in VIS1 and that in MEMs become more correlated to each other, the index took a value closer to 1. Conversely, the more inversely correlated the selectivities were, the index was closer to −1.
Comparison of neuronal activity between REP and non-REP sequences
The activity of a 2MS cell was often enhanced more in non-REP than in REP sequences. To quantify the activity enhancement in non-REPs in reference to the REPs in a 2MS cell, we introduced the “enhancement score,” which measured the activity difference from the mean activity while performing the REP. To calculate the enhancement score at a single-neuron level, we first determined the 2M yielding the greatest mean instantaneous firing rate and defined the movement as “preferred 2M.” This preferred 2M was determined for each bin, where 2M-selective activity was observed. Next, we calculated the mean instantaneous firing rate observed during the REPs (μrep), where the preferred 2M was repeated. We then computed the enhancement score in each trial by subtracting μrep from the instantaneous firing rate at a matched bin in the trial.
To quantify the activity enhancement at the population level, the enhancement score was computed separately for the REPs and non-REPs, both of which included the preferred 2M, and pooled across 2MS cells. We subsequently performed a two-tailed t test to examine whether the mean enhancement score in the non-REPs significantly differed from that in the REPs (i.e., zero).
Comparison of neuronal activity between error trials and correct trials
To infer the relationship between cell activity and task performance, we compared the activity before 1M between error and correct trials at single-neuron and population levels. Because the most frequent error was the one where the monkey prematurely executed 2M instead of 1M (PREM error), we focused on the influence of 2MS cell activity on this type of error. Specifically, we defined the “first premovement period” as the 200-ms interval immediately preceding the onset of 1M. We then selected the subpopulation of 2MS cells whose activity was 2M-selective during this period. For each cell in this subpopulation, we counted the spikes that occurred during the first premovement period in the MEMs with the cell's preferred 2M, including the correct and error trials with PREM errors.
Data/code accessibility
Raw data and custom code are available at https://data.mendeley.com/datasets/w9s5jd7fbz/1.
Results
Premature execution of the 2M as the major cause of error
At the beginning of each experimental block, the monkeys had to memorize a two-movement sequence while they executed the movements instructed with colored cues presented one after the other (Fig. 1A, visually guided trial; VIS). Thereafter, they performed the memorized sequence twice without instruction cues (Fig. 1A, memory-guided trial; MEM). One of the 16 motor sequences (Fig. 1B) was selected pseudorandomly for each block.
Both monkeys performed the task proficiently; the proportion of MEMs where the monkeys performed an erroneous movement (error rate) was only 5.93% (1546/26,081 for monkey N and 2.74% (213/7758) for monkey L. Moreover, we observed a significantly higher error rate in non-REPs (1310/20,134, 6.5% for monkey N; 191/5897, 3.2% for monkey L) than in REPs (236/5947, 4.0% for monkey N; 22/1861, 1.2% for monkey L) in both monkeys N (z = 7.25, p < 10−12 by two-tailed Z-test) and L (z = 4.65, p < 10−5). In the following analyses, we subdivide error trials in non-REPs and demonstrate that the premature performance of the 2M was the most significant across all types of errors.
In non-REPs, most errors occurred in the 1M than in the 2M in both monkeys (935/1310, 71.4% in monkey N; 122/191, 63.9% in monkey L). We then investigated what type of errors were prevalent in the 1M in non-REPs. One possibility was that the monkey did not perform the 1M in the instructed sequence but prematurely executed the movement that had to be performed as the 2M (PREM error; Fig. 1Di, blue bar). Alternatively, the monkey might have erroneously executed either of the two movements not contained in the instructed sequence (noninstructed movement error in the 1M; NIM-1 error; Fig. 1Di, cyan bar). Given that each of the three incorrect movements other than the correct one is equiprobable, PREM errors should account for only a third (33% chance level) of errors that occurred in the 1M. However, we found that PREM errors were the majority (63%, 590/935 for monkey N; 80%, 97/122 for monkey L). Indeed, these proportions were significantly more frequent than chance (z = 19.2 for monkey N, z = 10.7 for monkey L, p < 10−26 by two-tailed Z-test for both monkeys).
To examine the profile of errors occurring in the 2M in non-REPs, we classified the errors into those in which the 1M in the instructed sequence was repeated (REPE error; Fig. 1Di, red bar) and those in which a noninstructed movement was performed (NIM-2 error, pink bar). The proportion of REPE errors in the 2M (37%, 139/375 for monkey N; 55%, 38/69 for monkey L) was significantly greater than chance (33%) only in monkey L (z = 3.70, p = 0.00021), as shown by two-tailed Z-test.
In REPs, where errors occurred significantly less often than in non-REPs, all the error trials were accounted for by noninstructed movement by definition. Of these, NIM-2 errors occurred more often (66.9% in monkey N, 77.3% in monkey L) than NIM-1 errors (33.1% in monkey N, 22.7% in monkey L) in both monkeys (Fig. 1Dii). The foregone analyses revealed the predominance of PREM errors in the 1M of non-REPs. In the next section, we analyze the cell activity underlying the performance of motor sequences.
Neuronal database
Figure 1C shows the recording areas. More precisely, the recording area in PMd spanned 5 mm (monkey N) or 4 mm (monkey L) rostrally from the edge of the adjacent primary motor area. For pre-SMA, the recording area extended up to 7 mm (monkey N) or 6 mm (monkey L) rostrally to SMA. We recorded a total of 333 cells in PMd (215 in monkey N, 118 in monkey L) and 273 cells in pre-SMA (170 in monkey N, 103 in monkey L). Of these, 275/333 (82.6%) in PMd and 211/273 (77.3%) in pre-SMA were classified as task-related during the MEMs and included in our database. Task-related cells were operationally classified into the following four groups based on their activity during the entire analysis period in MEMs. Briefly, cells considered to be selective for either the 1M only or the 2M only were defined as 1MS or 2MS cells, respectively. Cells exhibiting activity selective for each movement at least once were defined as rank nonspecific (RNS) cells. The remaining task-related cells were the sequence-only selective (SEQ) cells. We similarly characterized the activity of each task-related cell in VIS1 and VIS2.
Encoding properties in PMd: single-unit examples
We found many 2MS cells with a variety of onsets in MEMs. The selectivity of these cells often started before the 1M. Figure 2 shows the activity of an example cell recorded during the VIS and MEMs. Our ANOVA-based analysis revealed that the 2M was clearly the dominant factor that explained cell activity in MEMs (Fig. 2C, top). The 2M selectivity started >1.5 s before the initiation of the 1M and continued until ∼250 ms before the 2M.
We further analyzed the contribution of each sequence to 2M selectivity. The rastergrams and perievent histograms (PEHs) in Figure 2C show that LS, as 2M, mainly contributed to 2M selectivity in the early phase of the analysis period, namely several hundred milliseconds before the 1M. In the later phase, LP, as the 2M, was the dominant contributor to 2M selectivity. Despite the temporal preference, 2M selectivity persisted from the beginning of the trial to the delay period before the 2M.
To examine how the 2M specificity emerged, we analyzed the activity of the cell in Figure 2C in VISs. During VIS1, the selectivity for 1M and 2M appeared one after the other (Fig. 2A, top); the activity was characterized as RNS-type. As shown in the PEHs in Figure 2A, the cell was preferentially active when a visual cue instructed LP regardless of its rank order. In contrast, the activity during VIS2 was similar to that in MEMs and was characterized as 2MS type (Fig. 2B, top). The 1M selectivity did not appear. Instead, 2M selectivity started just before the 1M, reflecting activity elevation when the 2M was LS (PEHs in Fig. 2B). For this cell, the preferred 2M (LP) and second preferred 2M (LS) were common in VIS1 and MEMs when the selectivity for 2M peaked (Fig. 2A,C, shaded areas). This is reflected in the high V-M correlation index of this cell (0.69; Fig. 11B, top). We present another example of a 2MS cell, where 2M-selective activity emerged >2.5 s before 1M and discriminated between REP and non-REPs (Fig. 3). The rastergram and PEH for each motor sequence show that the activity was preferentially enhanced when the 2M was RP in the MEMs. However, the activity was temporally attenuated just before the performance of the first-RP in the RP-RP repetition sequence (REP), whereas the activity enhancement was continuous in non-REPs. It is intriguing to note that in both 2MS cells shown in Figures 2C and 3, 2M selectivity discontinued before the 2M, suggesting that these cells were not related to the execution of the 2M per se.
Figure 11.
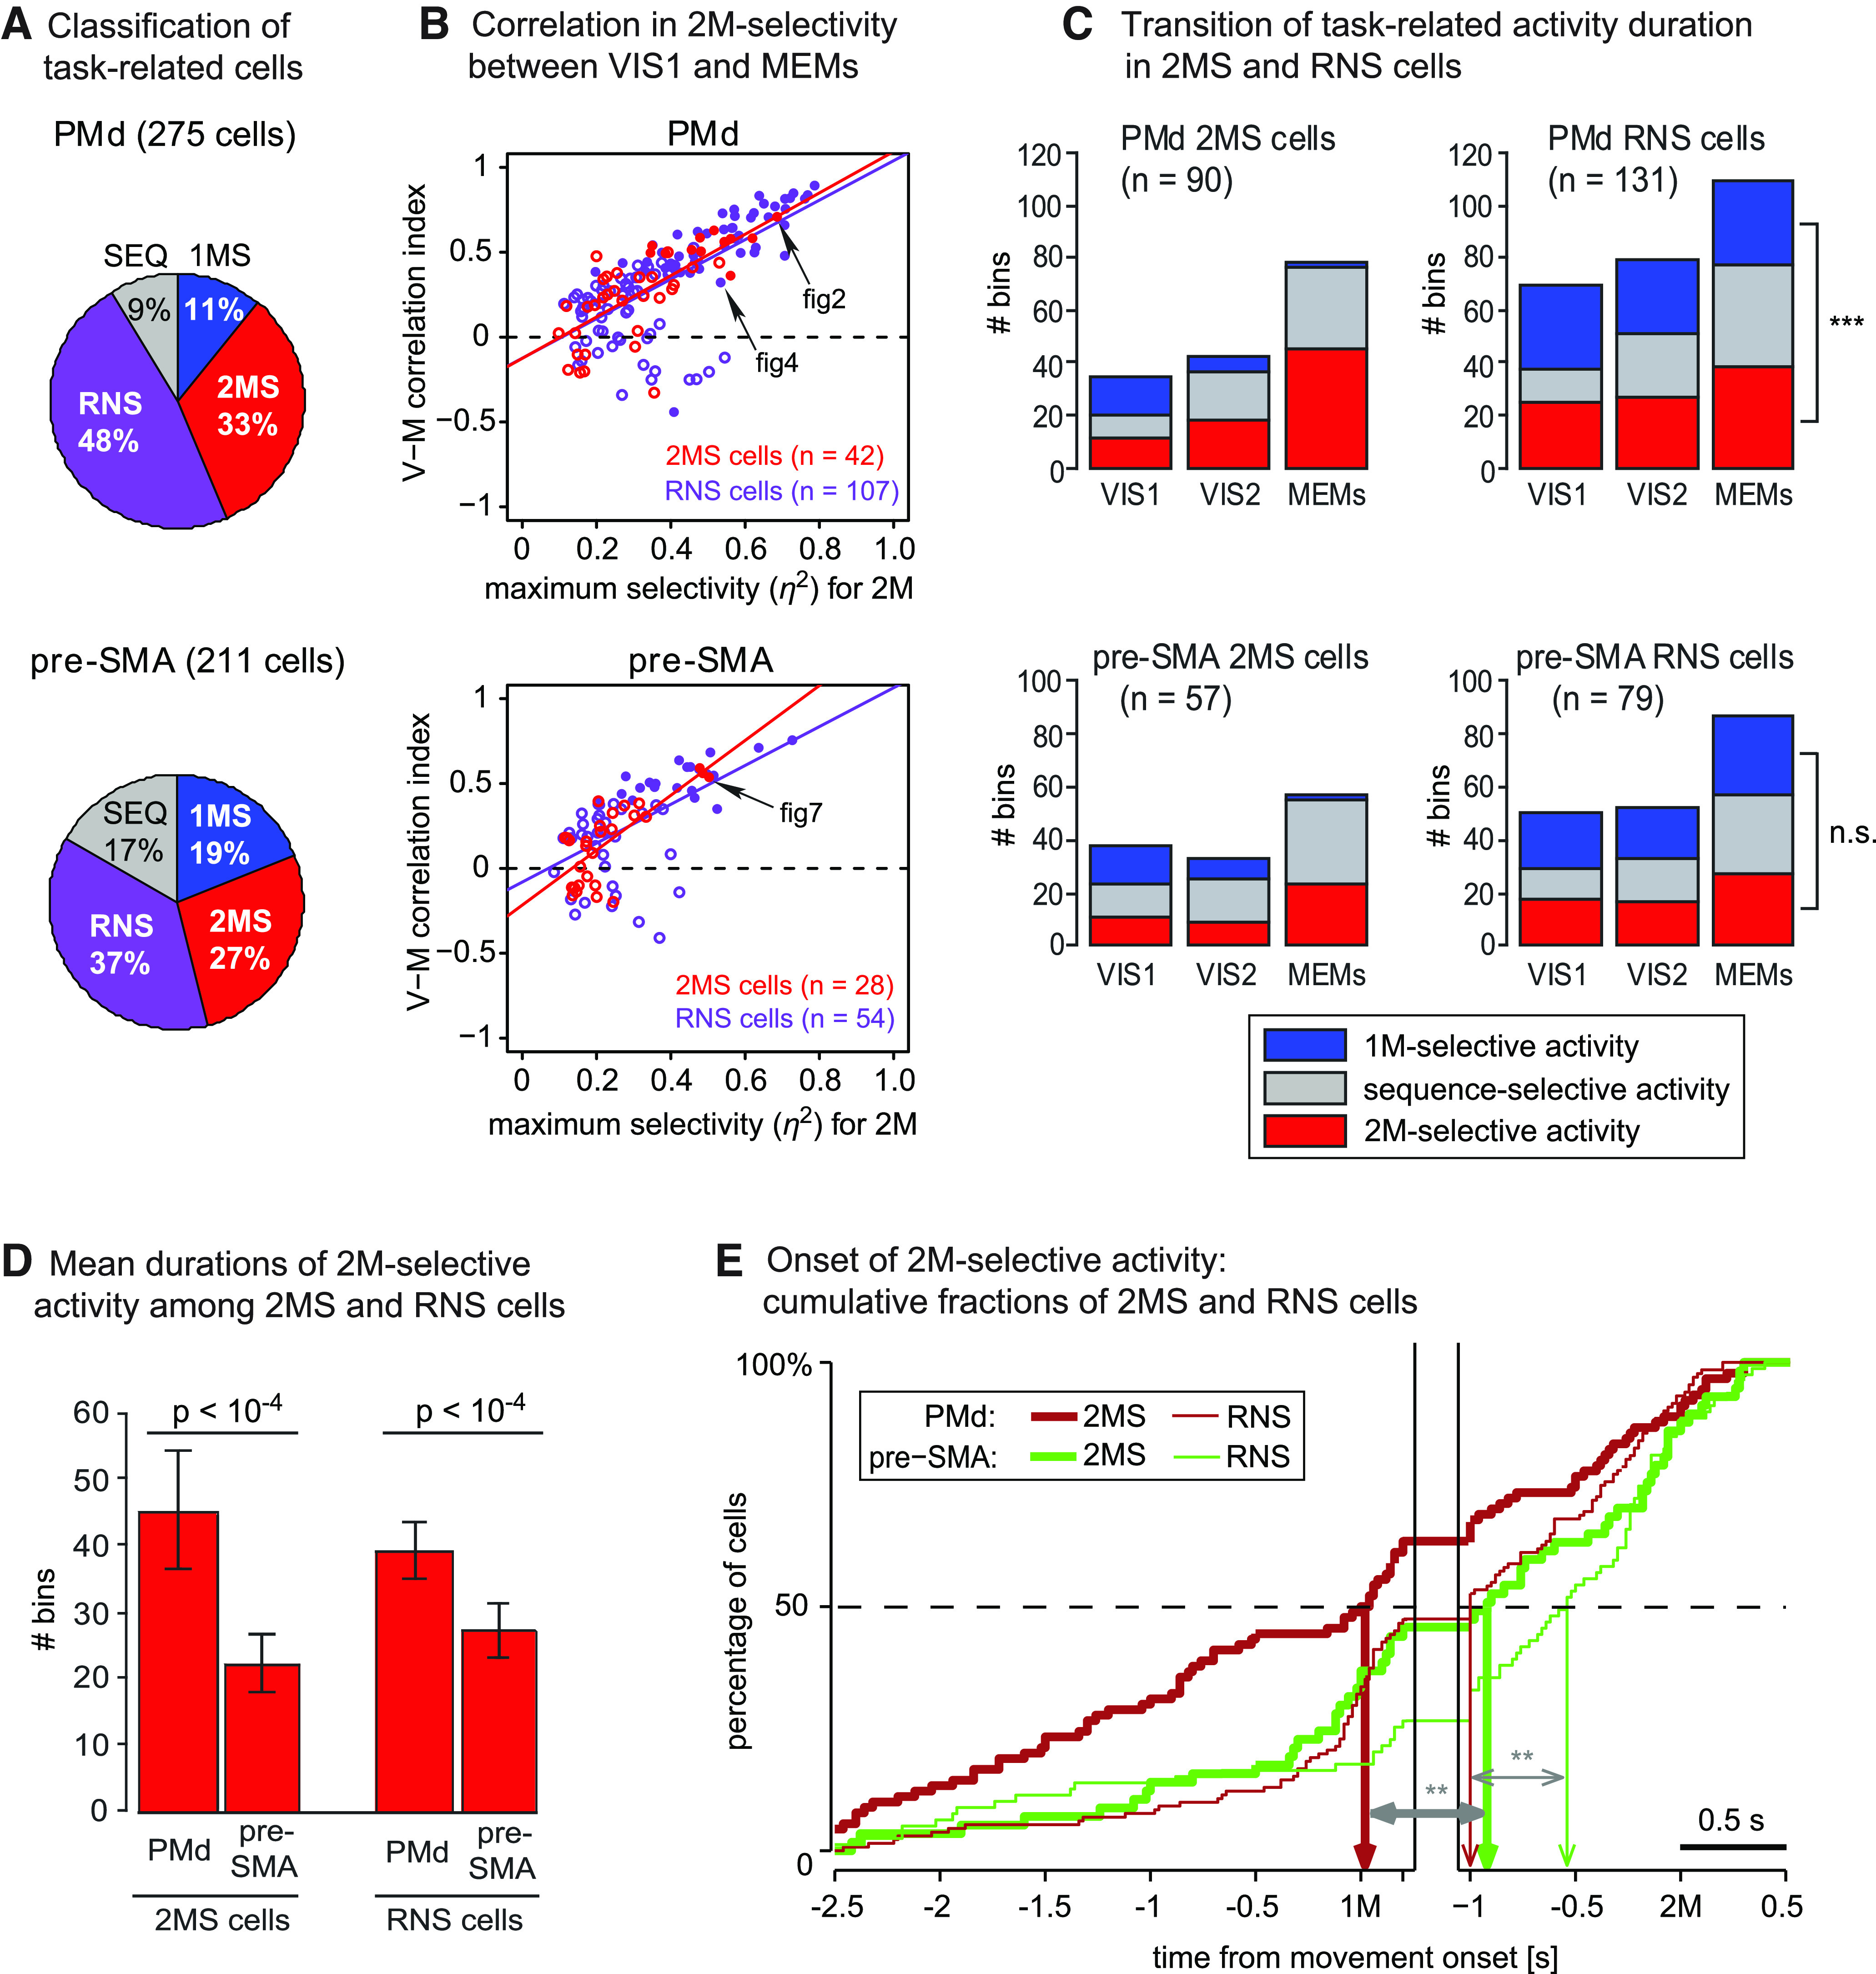
Comparison of 2MS and RNS cells between PMd and pre-SMA. A, Classification of task-related cells recorded in each cortical area. B, Correlation in 2M selectivity between VIS1 and MEMs as a function of the strength of 2M selectivity. For the 2MS (red symbol) and RNS cells (purple) that also exhibited 2M-selective activity in VIS1, the V-M correlation index is plotted against the maximum η2 (for 2M) measured in MEMs. Filled circles represent the cells with “strong” positive or inverse correlation that was defined by a positive or negative coefficient in >75% of iterations in the bootstrap test (see Materials and Methods). Open circles represent the cells without the strong correlation. Arrows depict the cells shown in Figures 2, 4, 7. C, Transition of task-related activity duration in 2MS (left panels) and RNS cells (right panels) in each cortical area, from VIS to MEMs. Each segment of a bar indicates the mean number of bins where task-related activity was detected (see inset for color code). ***, a significant (p < 0.001) difference between the mean number of bins containing 1M-selective activity and that containing 2M-selective activity for RNS cells. n.s., no significant difference (p > 0.05). D, Comparisons of 2M-selective activity duration in 2MS (left) and RNS (right) cells between two areas. The ordinate indicates the mean number of 200-ms bins containing 2M-selective activity. Error bars indicate 95% confidence intervals. E, Comparison of the onset of 2M-selective activity. Cumulative fractions of the 2MS (thick trace) and RNS (thin trace) cells that showed the 2M-selective activity in PMd (brown) and in pre-SMA (green) are plotted during the analysis period that started 2.5 s before the 1M and ended 0.5 s after the 2M. Each downward arrow in the corresponding color and thickness indicates the time at which 50% of the cells in each category showed 2M selectivity. Each gray horizontal arrow indicates a significant difference in the activity onset of 2MS cells (thick arrow) or RNS cells (thin arrow) between PMd and pre-SMA via Mann–Whitney U test (**p < 0.01, two-tailed).
Figure 3.
Tonic 2M-selective activity before 1M. Activity of another example PMd 2MS cell is shown. The basic display format is the same as that shown in Figure 2C. The downward arrow indicates the transient activity attenuation in the repetition sequence “RP-RP” (brown trace).
In the MEMs, the majority of the task-related cells other than the 2MS cells were classified as RNS cells. They often showed RNS-type activity likewise in VISs. Figure 4 shows an example. In both VISs (Fig. 4A,B) and MEMs (Fig. 4C), the cell exhibited an increase in activity when the forthcoming movement was LS or LP, regardless of its rank order. This is reflected by the 1M selectivity and 2M selectivity appearing one after the other. Indeed, the cell yielded a positive V-M correlation index (0.32; Fig. 11B, top). We therefore suggest that the cell took part in the preparation or execution of individual movement regardless of its rank order or the availability of a visual cue.
Figure 4.
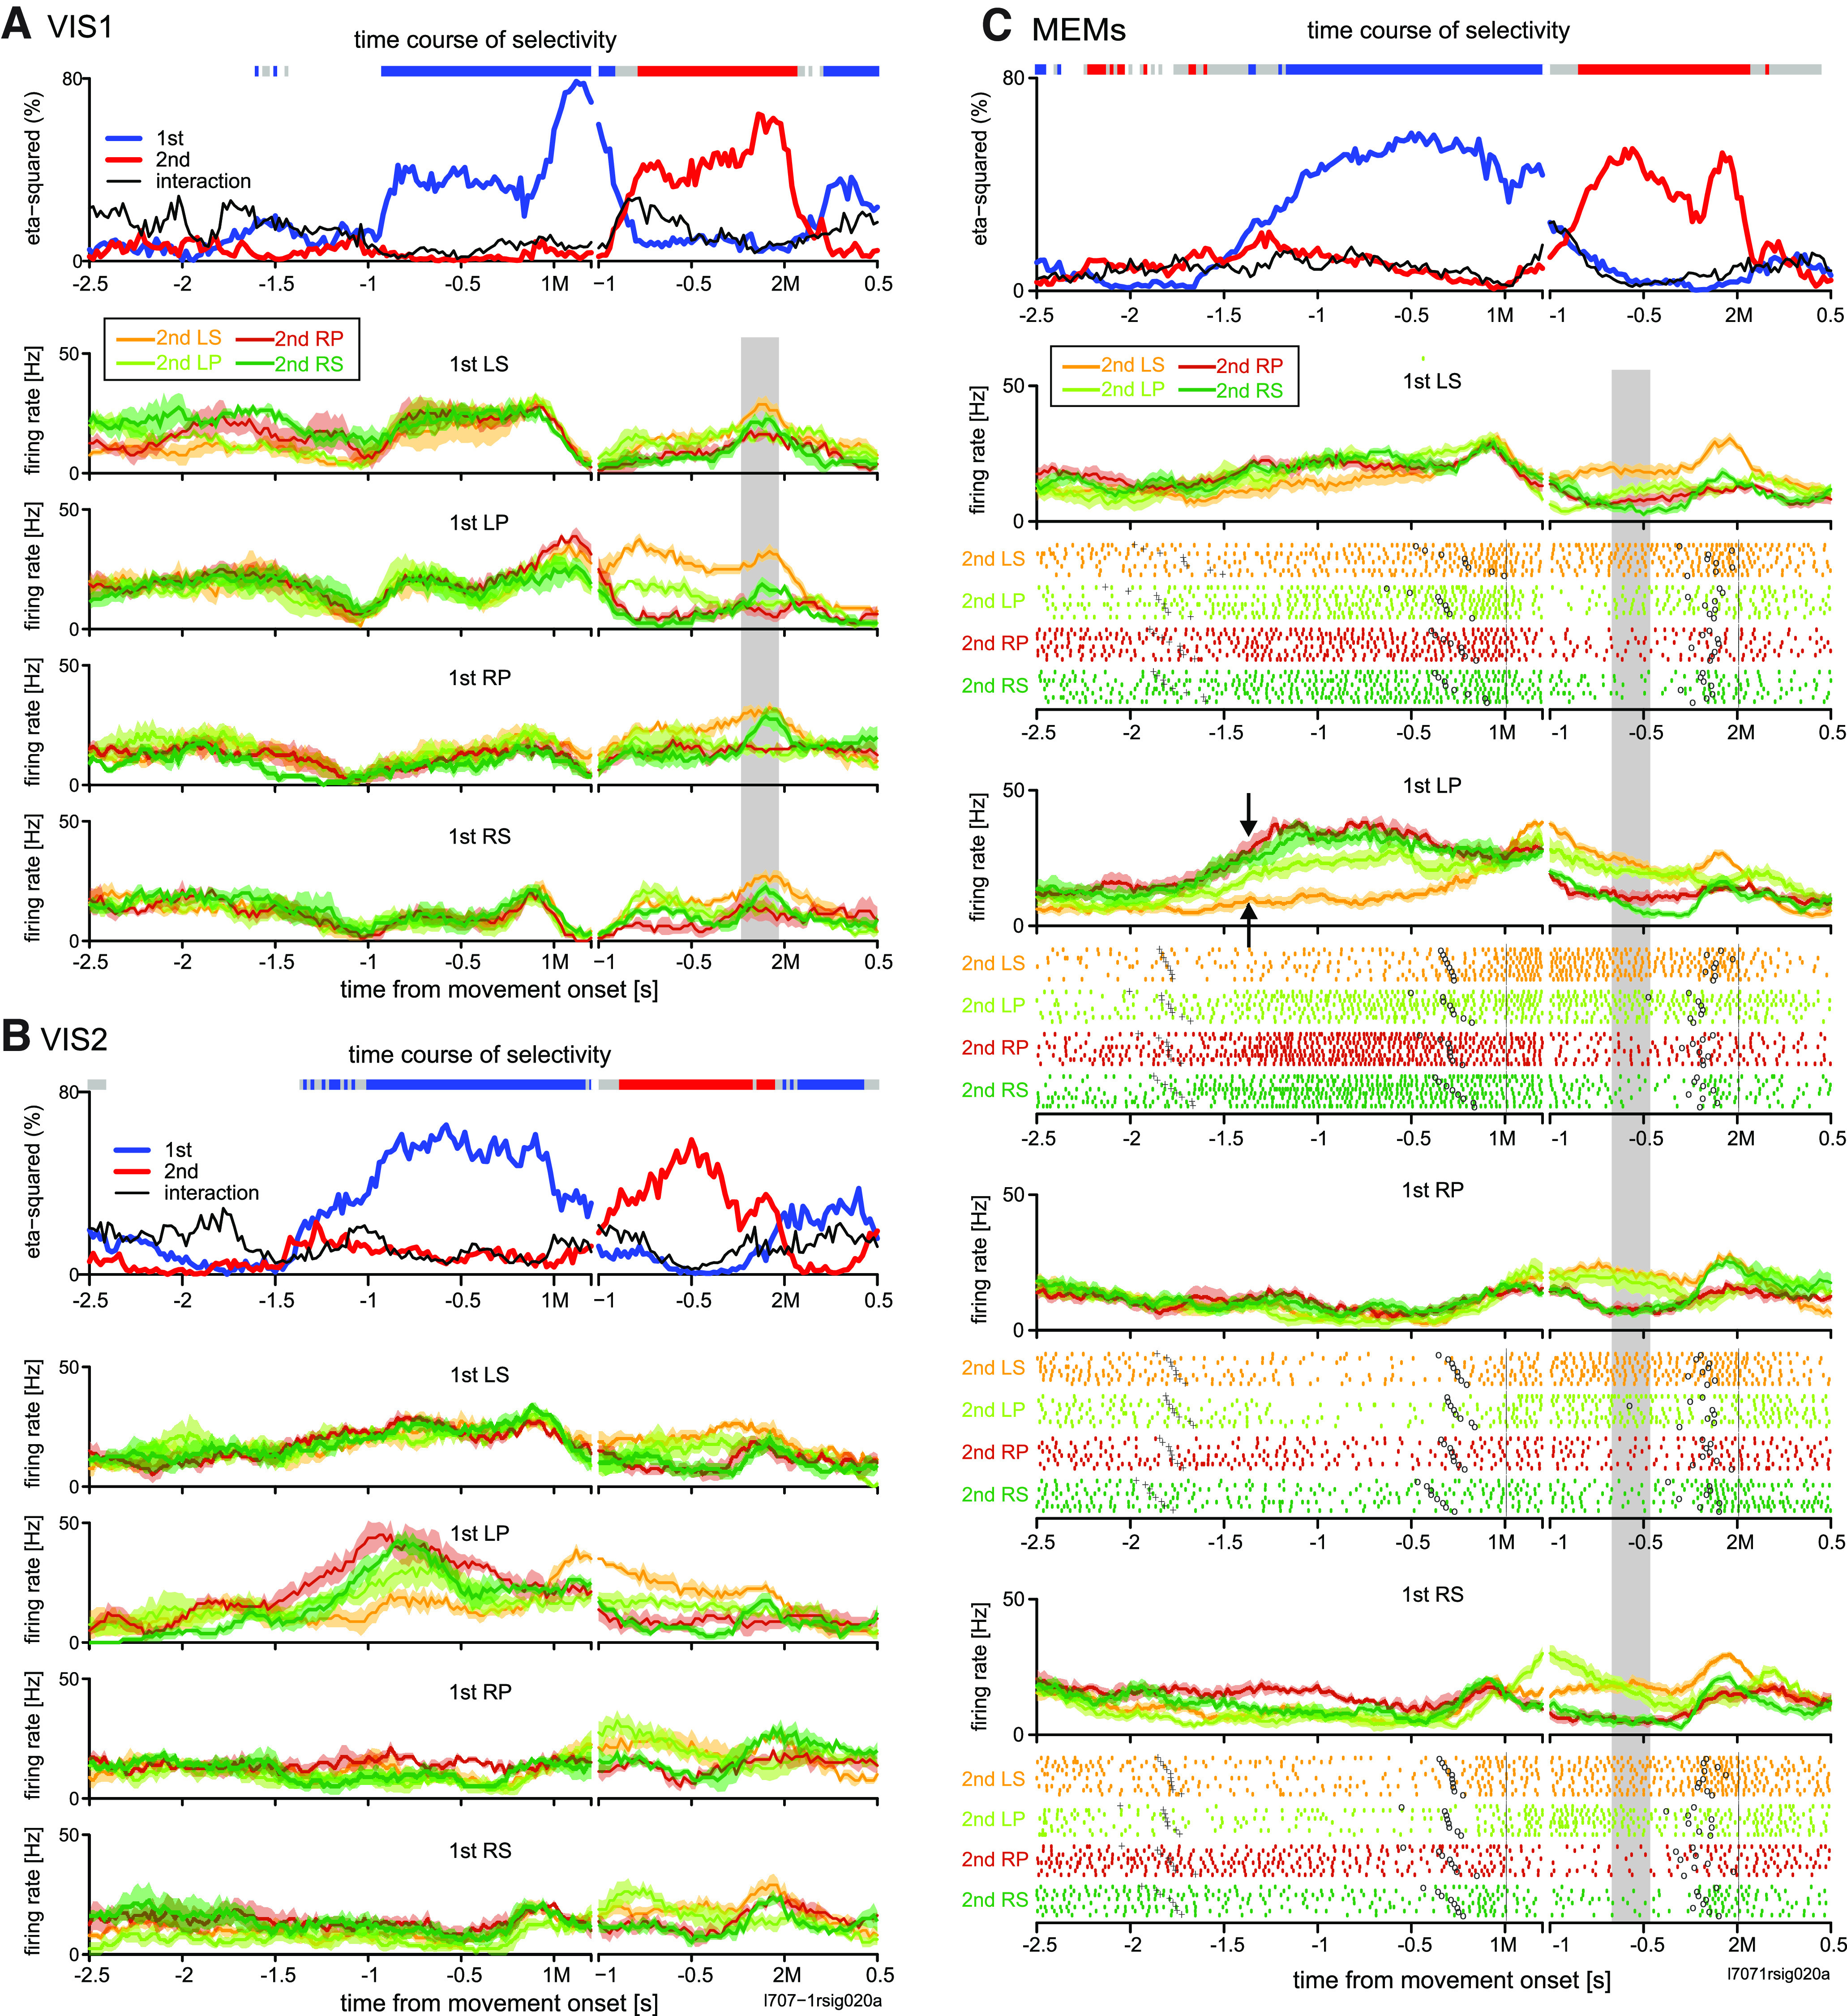
Activity transition in example RNS cell in PMd. A–C show the activity in the first (A), second visually guided trials (B), and memory-guided trials (C), using the same format as that shown in Figure 2A–C. Paired arrows in C indicate the range of different activity levels with respect to 2M that occurred before 1M (LP).
The 1M-selective activity occurred earlier in VIS2 and MEMs than in VIS1, indicating that the 1M was being memorized. However, it should be noted that in MEMs the activity more than ∼1.2 s before 1M was often sequence-selective, reflecting the graded activity level with respect to 2M when 1M was LP (Fig. 4C, pair of arrows).
Encoding property in PMd: population level analyses
Next, we present the population activity profile of task-related cells classified by the encoding property observed in the MEMs (Fig. 5). Among the task-related cells, we encountered RNS cells most often (131/275, 47.6%), followed by 2MS (90/275, 33%) cells. However, we describe the 2MS cells first because we characterized the roles of PMd and pre-SMA in controlling motor sequences mainly based on the activity pattern of the 2MS cells in the sections that follow.
Figure 5.
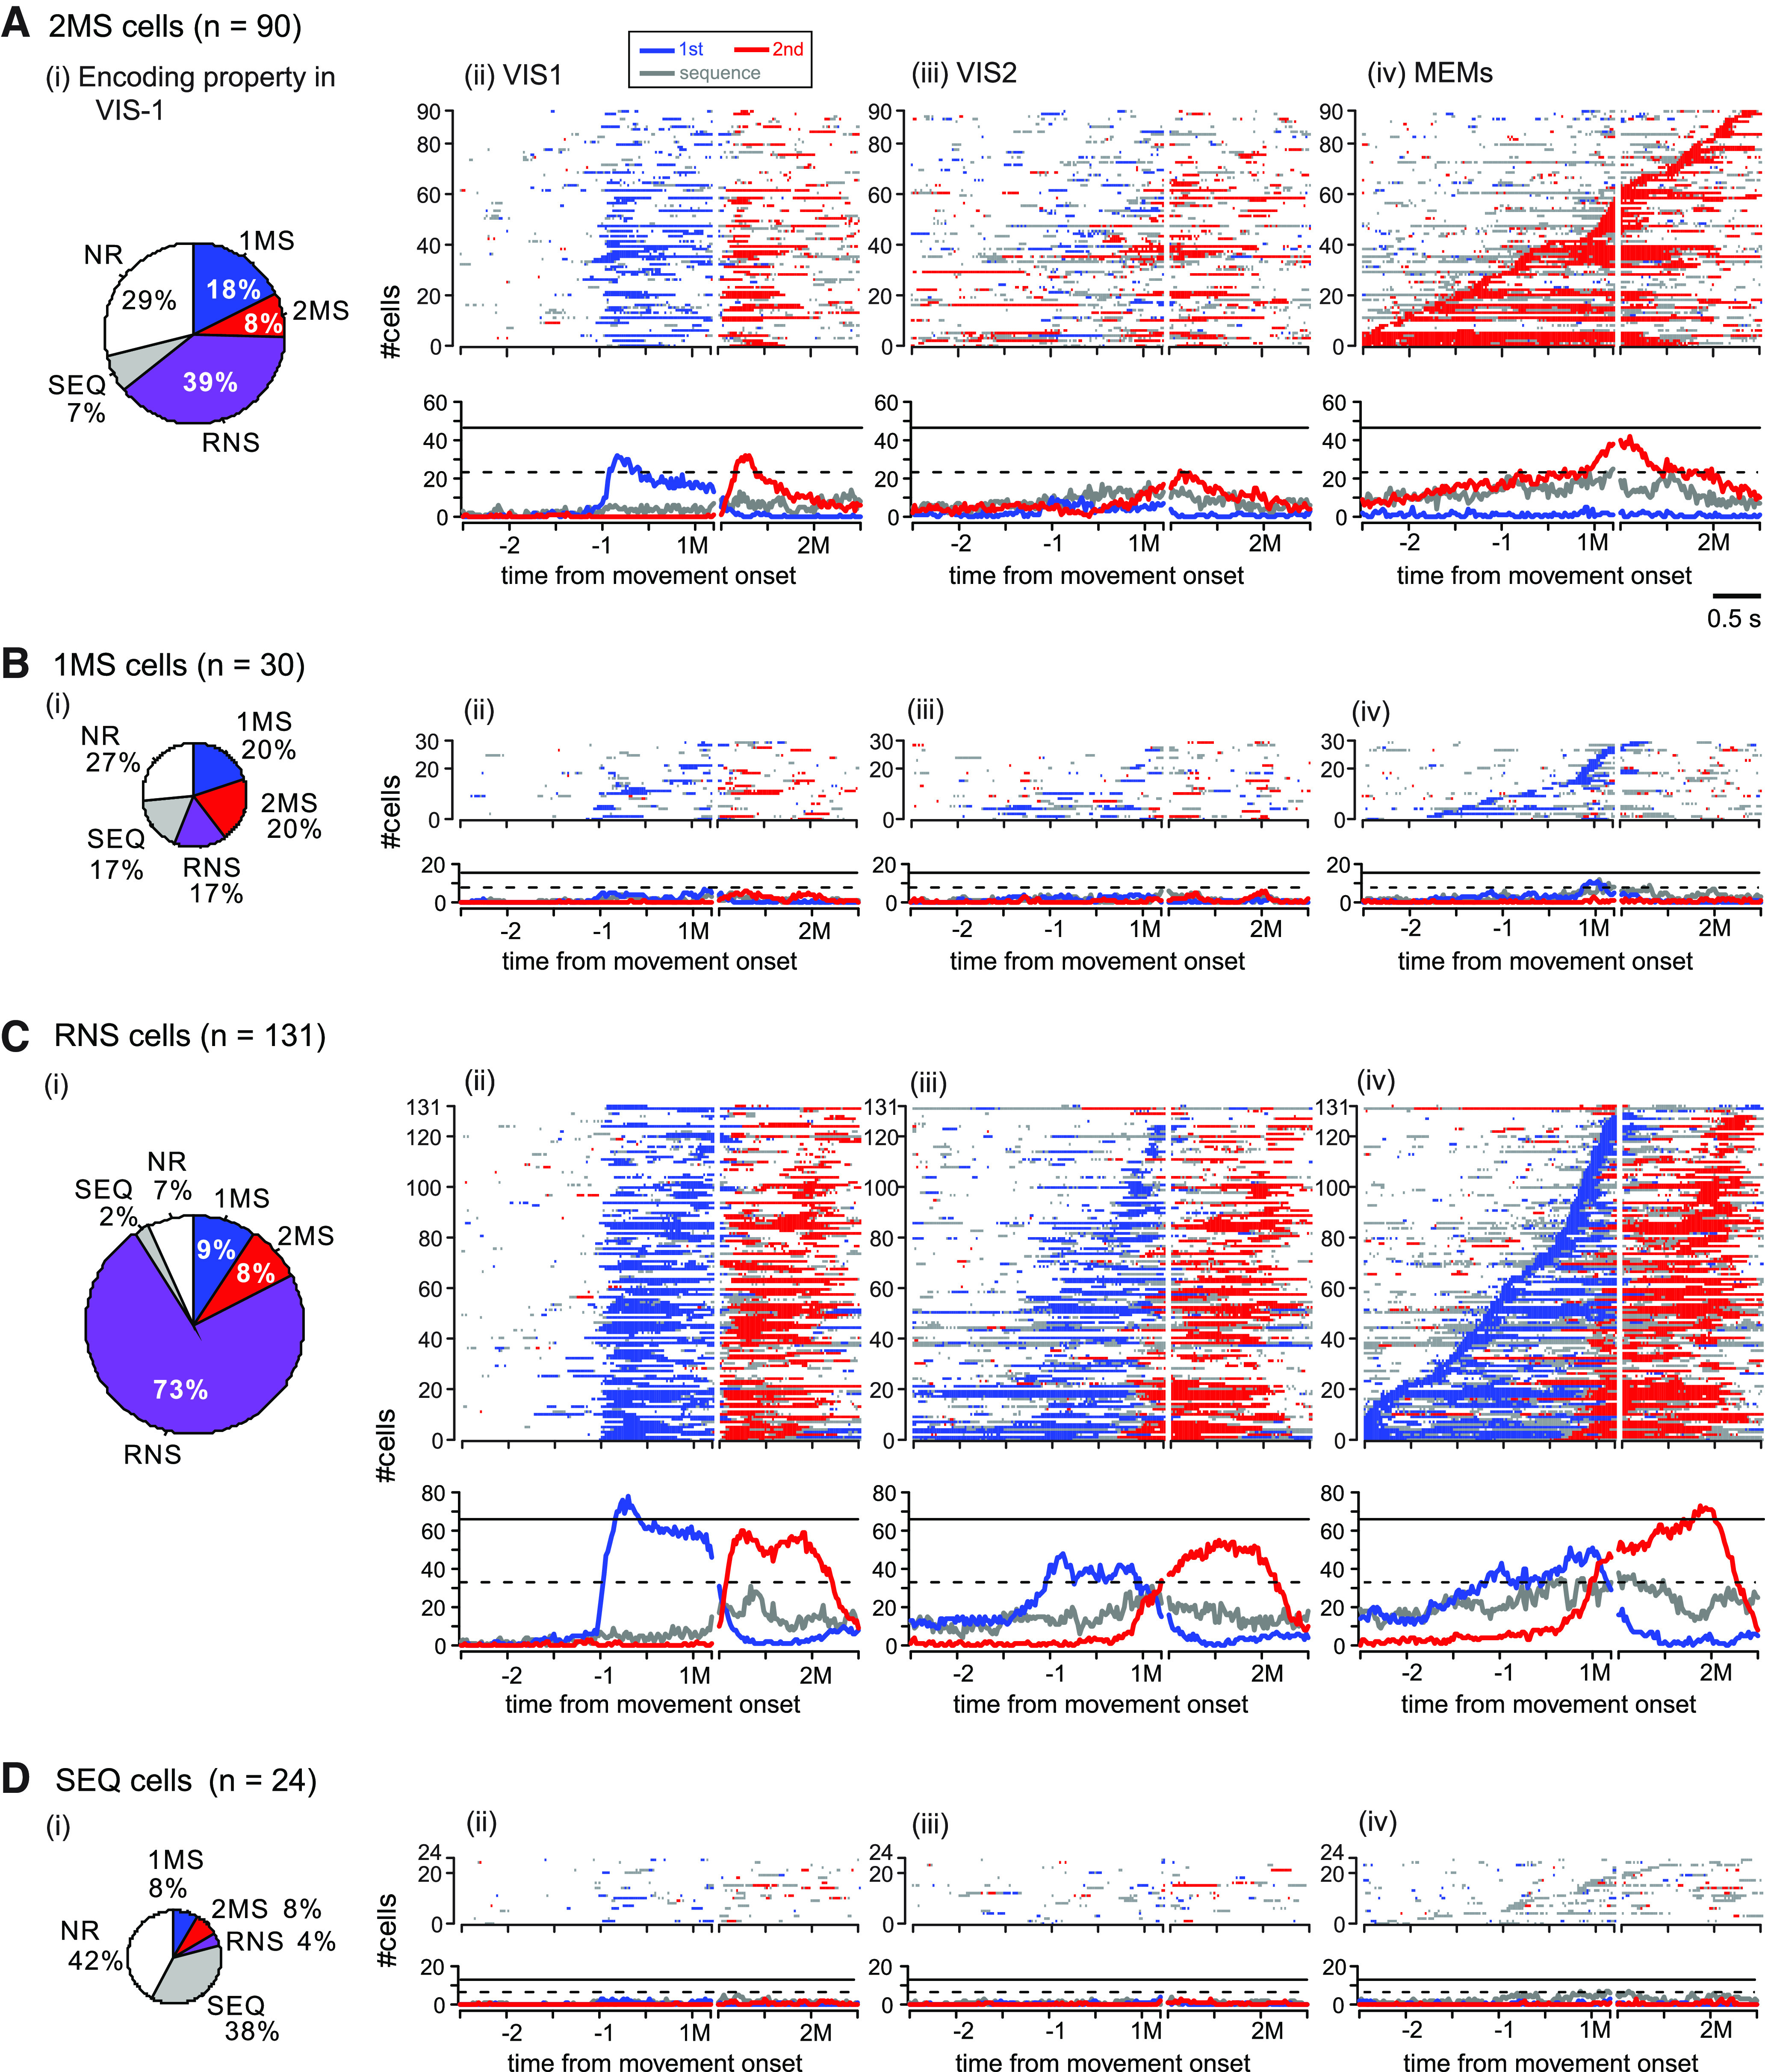
Population activity of task-related cells in PMd. A, Population activity of the 2MS cells. i, Subdivision of the 2MS cells according to the encoding property in VIS1. 1MS, 1M-specific; 2MS, 2M-specific; RNS, rank nonspecific; SEQ, sequence only selective; NR, task nonrelated. ii–iv, Top row, Phase diagram showing the temporal profile of selectivity detected among the 2MS cells during the (ii) VIS1, (iii) VIS2 (iii), and (iv) MEMs. Activity profiles of individual cells are color-coded, as shown in the inset; each row represents data for a single cell. Cell activity was sorted by the onset of 2M-selective activity that was determined in the MEMs and arranged for display in the order of its first appearance (from bottom to top). Bottom row, Time course of the number of cells in each instance that exhibited 1M-selective activity (red trace), 2M-selective activity (blue trace), and sequence-selective activity (gray trace) are plotted during the analysis period. The horizontal lines indicate 25% (dashed line) and 50% (solid line) of all 2MS cells. For display purposes, we adjusted the variation of the interval between the two movements by inserting a gap between 200 ms after the 1M onset (1M) and 1 s before the 2M onset (2M). B–D, Population activity of (B) 1MS, (C) RNS, and (D) SEQ cells. The basic display format is the same as A, except that cell activity in B, C was sorted by the onset of 1M-selective activity, and the activity in D was sorted by the onset of sequence-selective activity, both of which were determined in MEMs. See Figure 6 for the population activity aligned with cue onsets in VIS1 and VIS2.
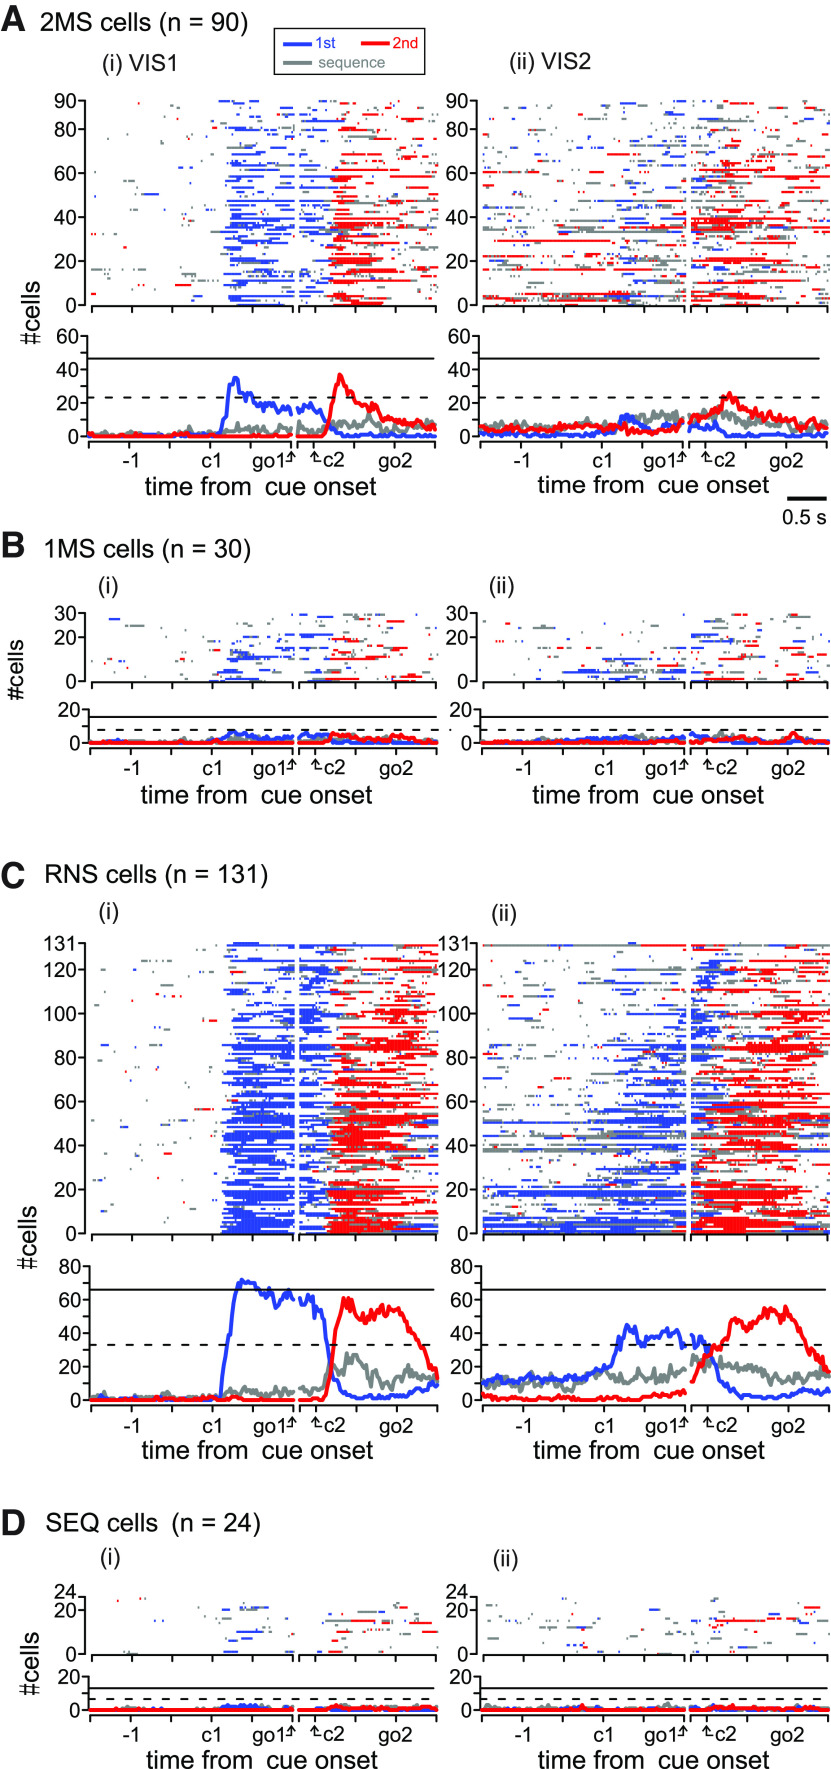
We sorted the activity of 2MS cells in VIS1, VIS2, and MEMs according to the onset of 2M selectivity in the MEMs (Fig. 5Aii–iv, top). As observed in the activity in the MEMs (Fig. 5Aiv, top), onset times spanned the entire analysis period. Qualitatively, 50% (45/90) of 2MS cells exhibited the onset before the 1M, and the selectivity often continued until after the 1M. To elucidate the temporal profile of information encoded by the 2MS cells at the population level, we plotted the number of 2MS cells for which the activity was selective for the 1M, 2M, or sequence against time (Fig. 5Aiv, bottom). The number of cells showing 2M-selective activity gradually increased until the 1M. The number increased more rapidly after the 1M, peaked ∼1 s before the 2M, and then declined. This implies that most 2MS cells were not directly involved in the execution of the 2M. It should be noted that 10–20 2MS cells (11–22%) often exhibited sequence-selective activity. In contrast, during VIS1 (Fig. 5Aii; see also Fig. 6Ai showing data aligned with cue onset), a sizable proportion of the 2MS cells exhibited selective activity for the 1M in response to the first visual cue. Thereafter, most of these cells exhibited 2M selectivity in response to the second visual cue. Thus, the encoding property was more variable in VIS1 (Fig. 5Ai). In particular, 39% (35/90) of the 2MS cells, whose activity in MEMs was selective for 2M only, exhibited RNS-type activity in VIS1 (Fig. 5Ai). Subsequently, during VIS2, the activity responding to the visual cue presentations was dramatically attenuated (Fig. 5Aiii; see also Fig. 6Aii), suggesting that the cells were much less reactive. Moreover, the cells selective for the 1M decreased, and some cells showed 2M-selective activity before the 1M. These observations indicate that the population activity was transitioning from reactive to predictive encoding. One can also appreciate the emergence of sequence-selective activity before the 1M. Finally, in the MEMs, 1M selectivity disappeared, and 2M selectivity became more prominent than that observed in VIS2 (Fig. 5Aiv). These findings indicate a dynamic transition in the encoding properties of the 2MS cells from VIS1 to MEM trials.
Figure 6.
Population activity of PMd cells aligned with visual cue onsets. A–D show population activity of 2MS (A), 1MS (B), RNS (C) and SEQ cells (D) during the first (i) and second (ii) visually-guided trials. The basic display format is similar to that shown in Figure 5, ii, iii. For display purposes, we adjusted the variation of the interval between the presentations of the first and second cues (c1, c2) by inserting a gap between the first GO signal (go1) and 200 ms before the second cue presentation. go2, second GO signal.
The number of 1MS cells (n = 30) was only one-third that of 2MS cells. Although 24/30 1MS cells measured the onset of 1M selectivity before the 1M (Fig. 5Biv, top), this number was still smaller than that of the 2MS cells exhibiting 2M-selective activity before the 1M (n = 45). This suggests that neuronal representation in PMd is strongly biased toward the 2M at the population level. Like the 2MS cells, the 1MS cells showed various encoding properties in VIS1 (Fig. 5Bi) and exhibited a transition in the encoding property from VIS1 to MEMs (Fig. 5Bii–iv).
Nearly half of the task-related cells (47.6%, 131/275) were RNS (Fig. 5Civ, top). Of these, 125/131 (95.5%) cells measured the onset of 1M-selective activity no later than 200-ms after the onset of the 1M, and the 2M-selective activity occurred thereafter. They were thus considered to be involved in the preparation or execution of an individual movement regardless of its rank order. As shown in Figure 5Civ, bottom panel, ∼10% of RNS cells exhibited 1M-selective activity at the beginning of the analysis period. Before the proportion peaked, a rapid increase in cells exhibiting 2M selectivity had already begun. It is noteworthy that activities of the RNS and 2MS cells before 1M simultaneously represented two movements in a sequence. Compared with this predictive nature of the activity in the MEMs, the activity in VISs was reactive. In VIS1, in particular, the number of cells selective for 1M or 2M sharply increased in response to the presentation of the corresponding visual cue (Figs. 5Cii, 6Ci). Accordingly, the vast majority of RNS cells (96/131, 73%) exhibited RNS-type activity in VIS1 (Fig. 5Ci), suggesting that RNS cells encode the immediate-next movement more robustly than the other cells. In VIS2, the onset of the 1M-selective and 2M-selective activity was less time-locked to the cue presentations (Figs. 5Ciii, 6Cii). In some cells, movement-selective or sequence-selective activity emerged earlier, resembling the activity during the MEMs.
The SEQ cells (24/275, 9%) formed the smallest group (Fig. 5D). While 38% of the SEQ cells also exhibited SEQ-type activity in VIS1, a total of 20% of the SEQ cells exhibited 1M-selective and/or 2M-selective activity in the trial (Fig. 5Di).
Encoding properties in pre-SMA: single-unit examples
Likewise, we found many 2MS cells in pre-SMA. However, the activity of pre-SMA 2MS cells began later, and its duration was shorter than that of PMd 2MS cells in general. A typical example of the pre-SMA 2MS cell is shown in Figure 7. This cell elevated the firing rate immediately after 1M in the non-REP sequences (LS-RS, LP-RS, and RP-RS), in which 2M was RS (Fig. 7C, green traces). In case RS was repeated (RS-RS), the activity elevation was weaker (Fig. 7C, black arrow) than that in non-REPs (Fig. 7C, red arrows). As observed in the PMd cells, there was a transition from reactive to predictive encoding. In VIS1, 2M selectivity started reactively, in response to the second visual cue (Fig. 7A). However, there was a difference from the PMd 2MS cell shown in Figure 2; in VIS-1 (Fig. 7A), 1M selectivity reflected the inhibitory response to the first visual cue that instructed LP or RP (black arrow). In the subsequent VIS2, the onset of the 2M selectivity was brought forward, indicating that the activity was turning predictive (Fig. 7B). The activity finally turned exclusively selective for 2M in the MEMs. This cell yielded a high V-M correlation index (0.52; Fig. 11B, bottom), reflecting similar preference for 2M in VIS1 and MEMs (Fig. 7A,C, shaded areas).
Figure 7.
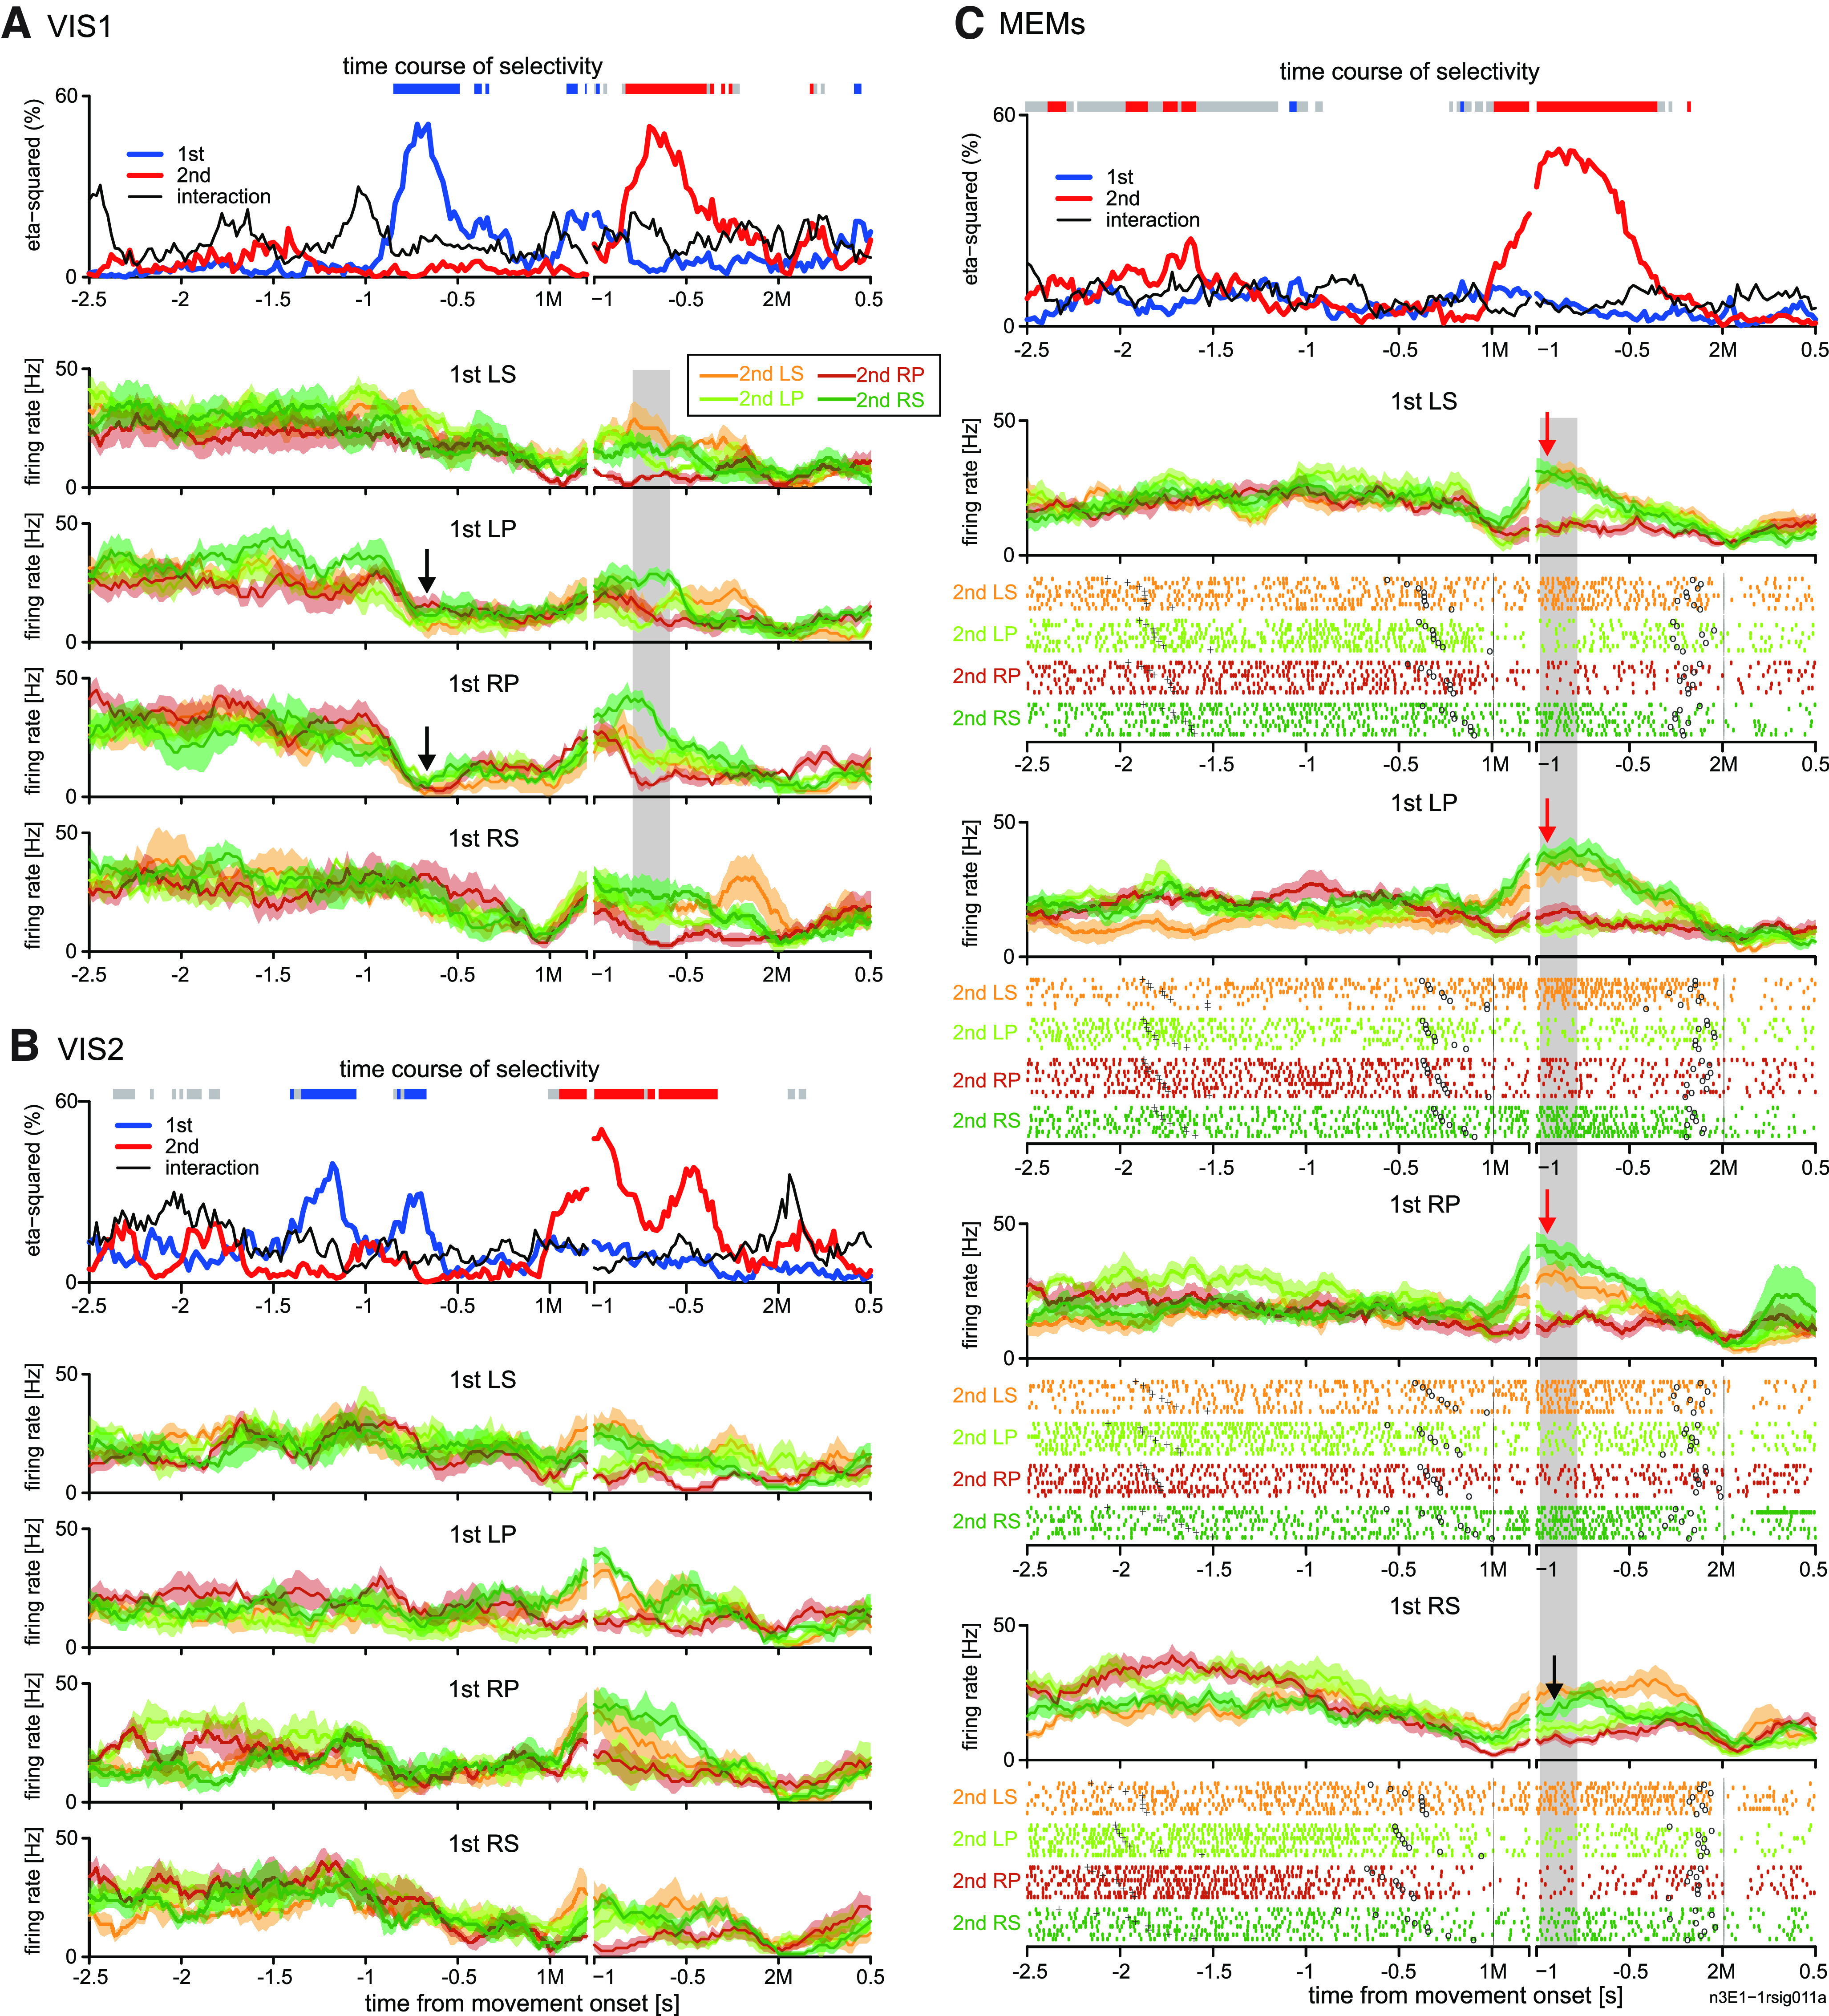
Transition of encoding property in example 2MS cell in pre-SMA. A–C show the activity in the first (A), second visually-guided trials (B), and memory-guided trials (C), using the same format as that shown in Figure 2A–C. Black arrows in A depicts inhibitory response to the first visual cue that instructed LP or RP. Each red arrow in C indicates an increase in activity while performing a movement other than right forearm supination (RS) in 1M when the 2M was RS, whereas the black arrow in C indicates a smaller activity increase (green trace) when RS is to be repeated.
Another example cell (Fig. 8A) exhibited phasic activity before and during the initiation of the 1M in the MEMs. This activity was selective for the second RS movement in the non-REPs (red arrows). Intriguingly, the cell was almost silent when the monkey performed an RS-RS repetition sequence (black arrow). The cell did not show activity selective for either movement in VIS1 (data not shown).
Figure 8.
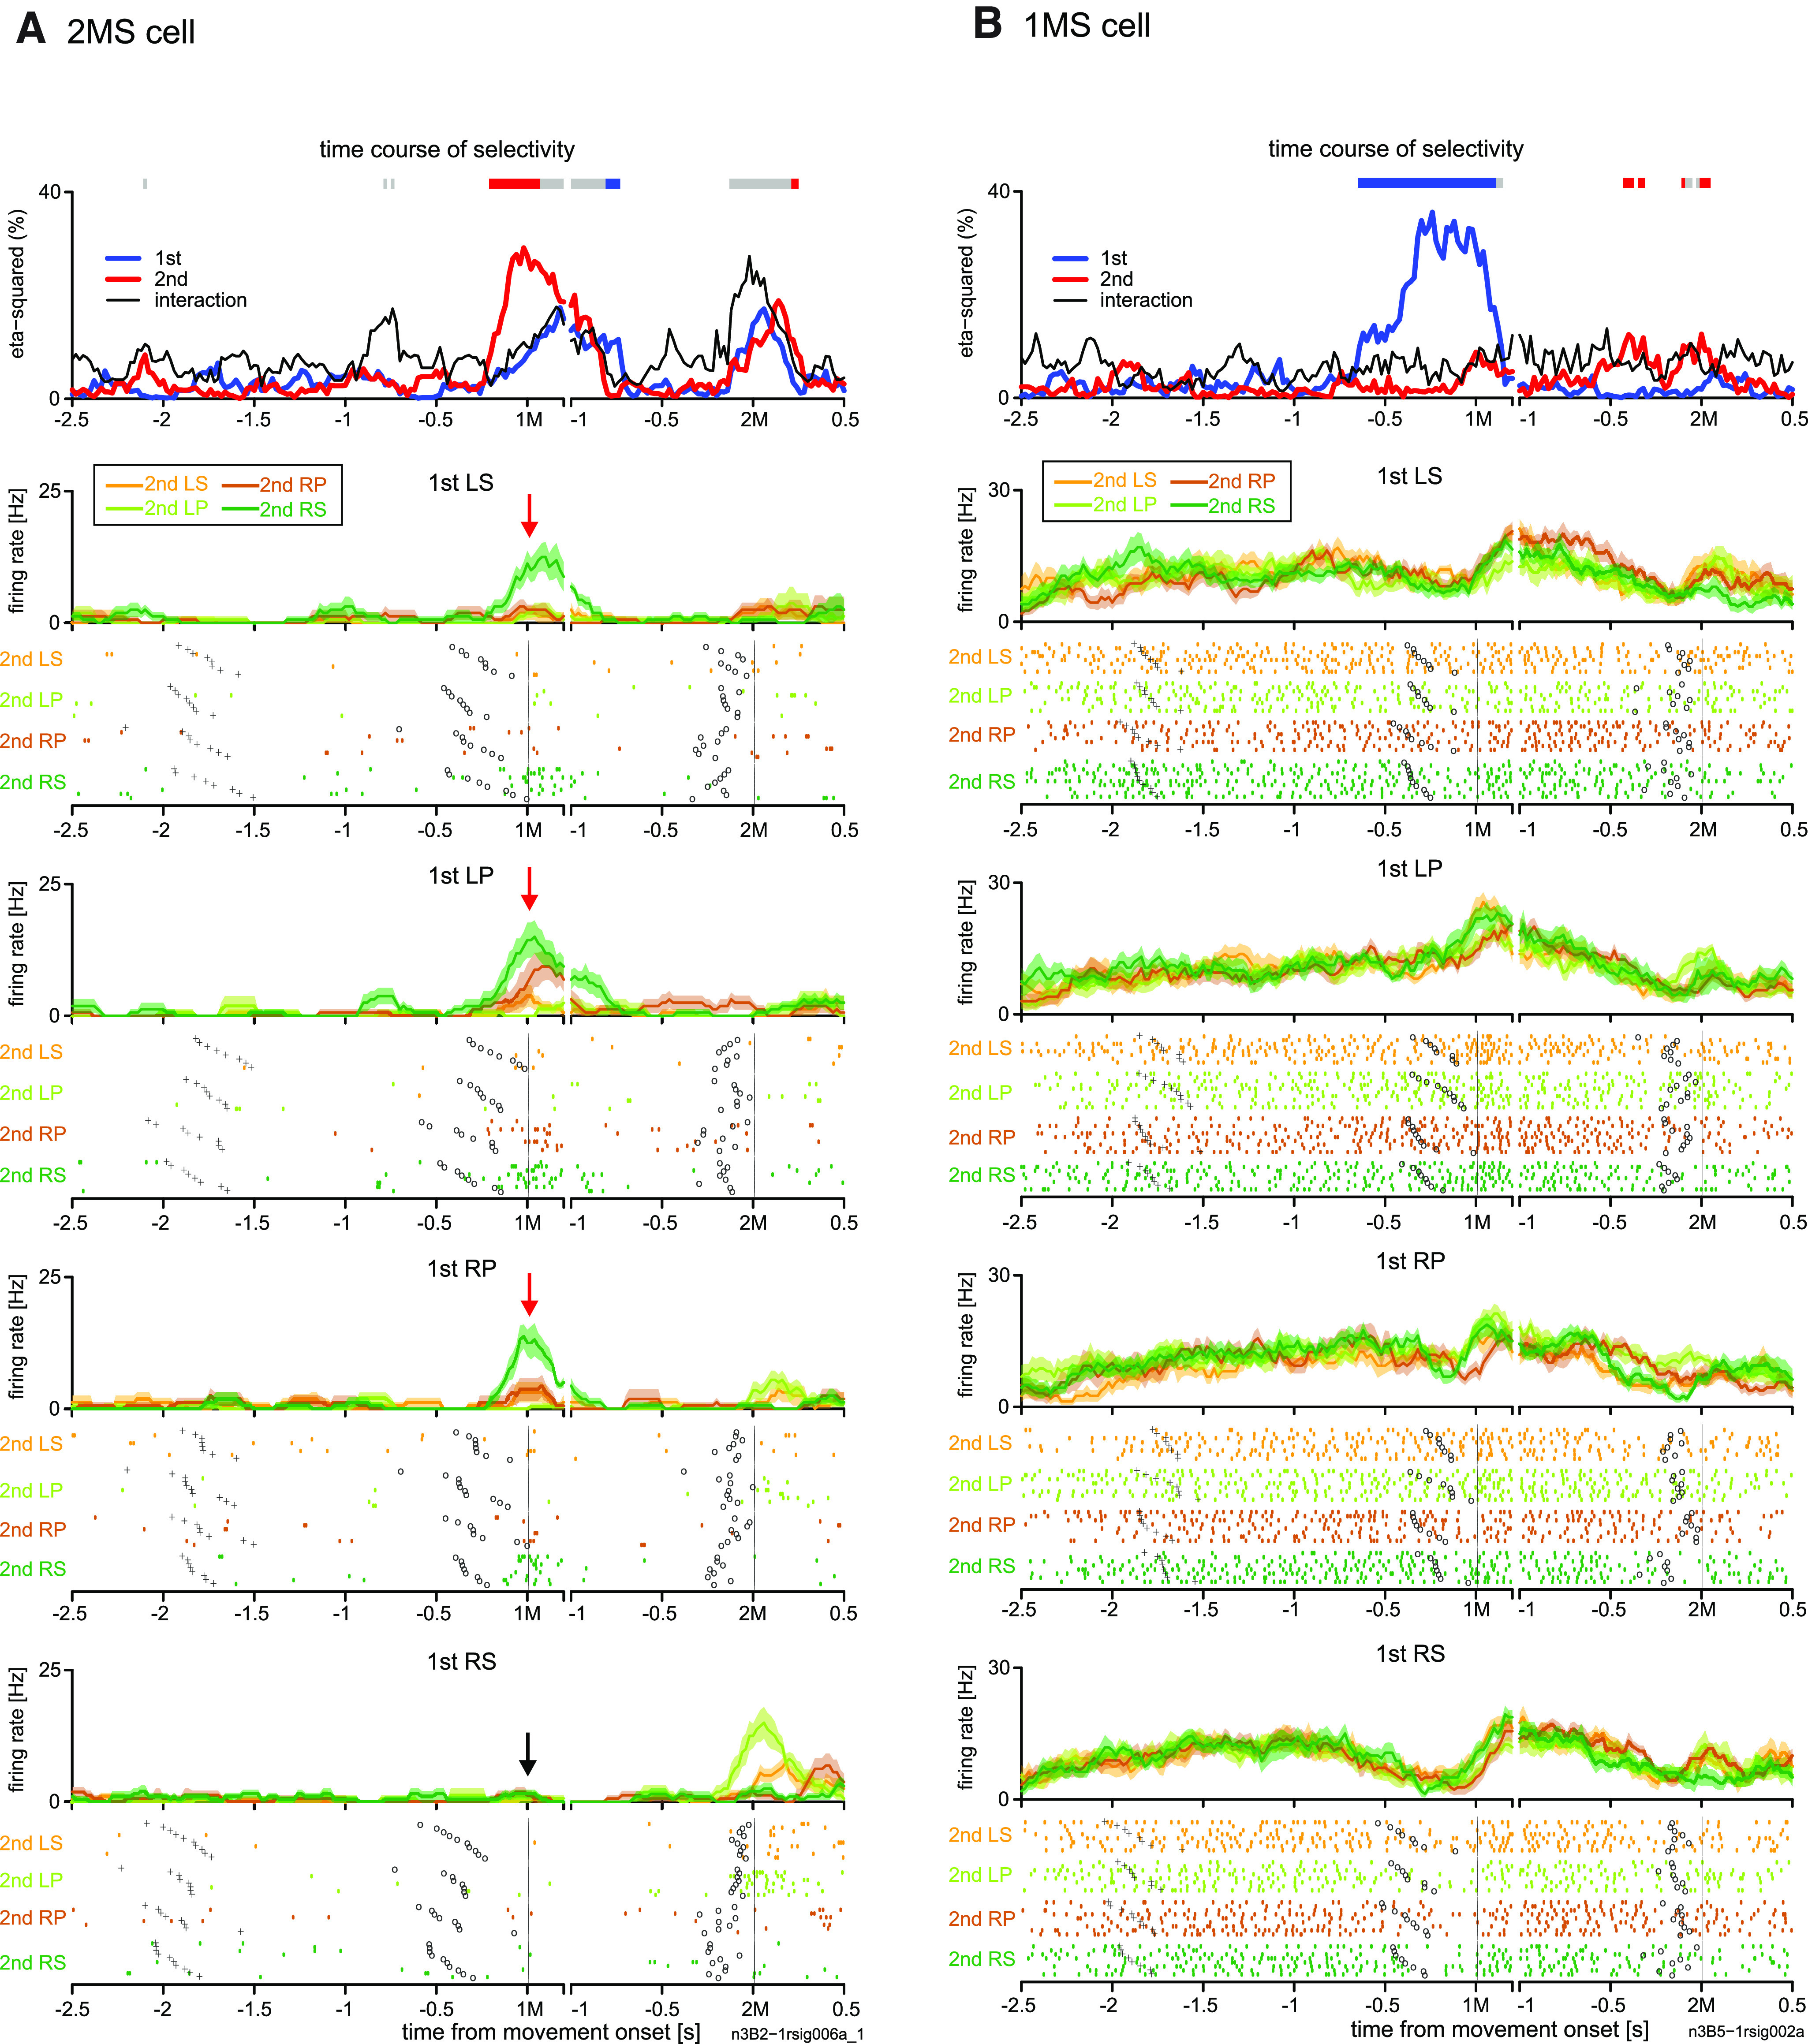
Activity of 2MS and 1MS cells in pre-SMA during memory-guided trials. Activity of (A) a 2MS cell and (B) 1MS cell in pre-SMA. The basic display format is the same as that shown in Figure 2C. In A, each red arrow indicates phasic activity while performing a movement other than right forearm supination (RS) in the 1M when the 2M was RS, whereas the solid black arrow indicates an almost complete lack of activity when RS is to be repeated.
In addition to the 2MS cells, we found a comparable proportion of 1MS cells. This contrasts with the paucity of 1MS cells in PMd. Figure 8B shows an example 1MS cell that started 1M-selective activity ∼0.7 s before the 1M and continued until ∼0.1 s after the 1M. Specifically, this cell exhibited the strongest suppression in activity while performing RS as the 1M. We noted that in several other 1MS cells, 1M selectivity was accounted for by selective suppression of activity for a particular 1M.
Encoding properties in pre-SMA: population-level analyses
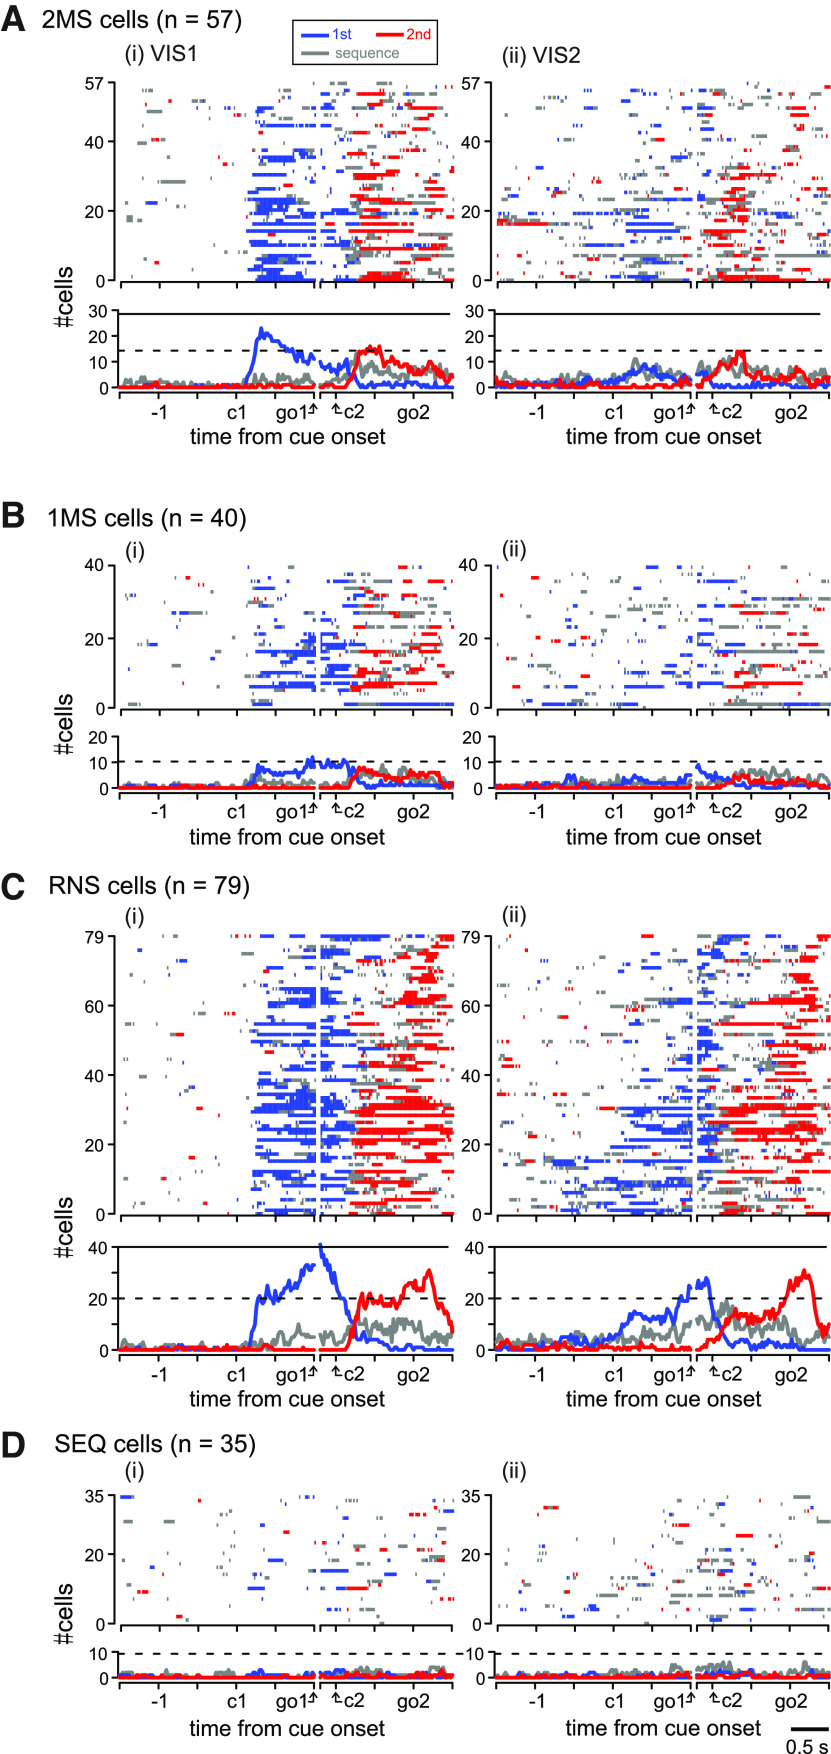
As we did for PMd above, we first describe the population activity of the 2MS cells, followed by the 1MS, RNS, and SEQ cells (Fig. 9). The 2MS cells formed the second largest group (57/211, 27%) among the task-related cells in pre-SMA (Fig. 9A); however, their temporal activity profile in the MEMs was quite different from that in PMd. Specifically, the proportion of cells exhibiting 2M-selective activity in each instance continued to be very low (<5/57, 9%) until the abrupt increase just before the 1M (Fig. 9Aiv, arrow). This contrasts with the corresponding proportion in PMd, which showed a continual increase from the beginning of the analysis period (Fig. 5Aiv). It should be noted that ∼25% of pre-SMA 2MS cells exhibited sequence-selective activity around the 1M and 2M. As we have seen in PMd, pre-SMA 2MS cells acquired the exclusive encoding of 2M through activity transition from reactive to predictive encoding. The reactiveness to visual cues in VIS1 is evident in Figure 9Aii (see also Fig. 10Ai showing data aligned with cue onset). The variation in encoding property is shown in Figure 9Ai, where more than a third (20/57, 35%) of the 2MS cells exhibited RNS-type activity in VIS1. In the subsequent VIS2, pre-SMA 2MS cells were less reactive to visual cues but more predictive of the future movement; several cells exhibited 2M-selective activity before the second cue, and several others showed sequence-selective activity before the first cue (Figs. 9Aiii, 10Aii), resembling the activity during MEMs.
Figure 9.
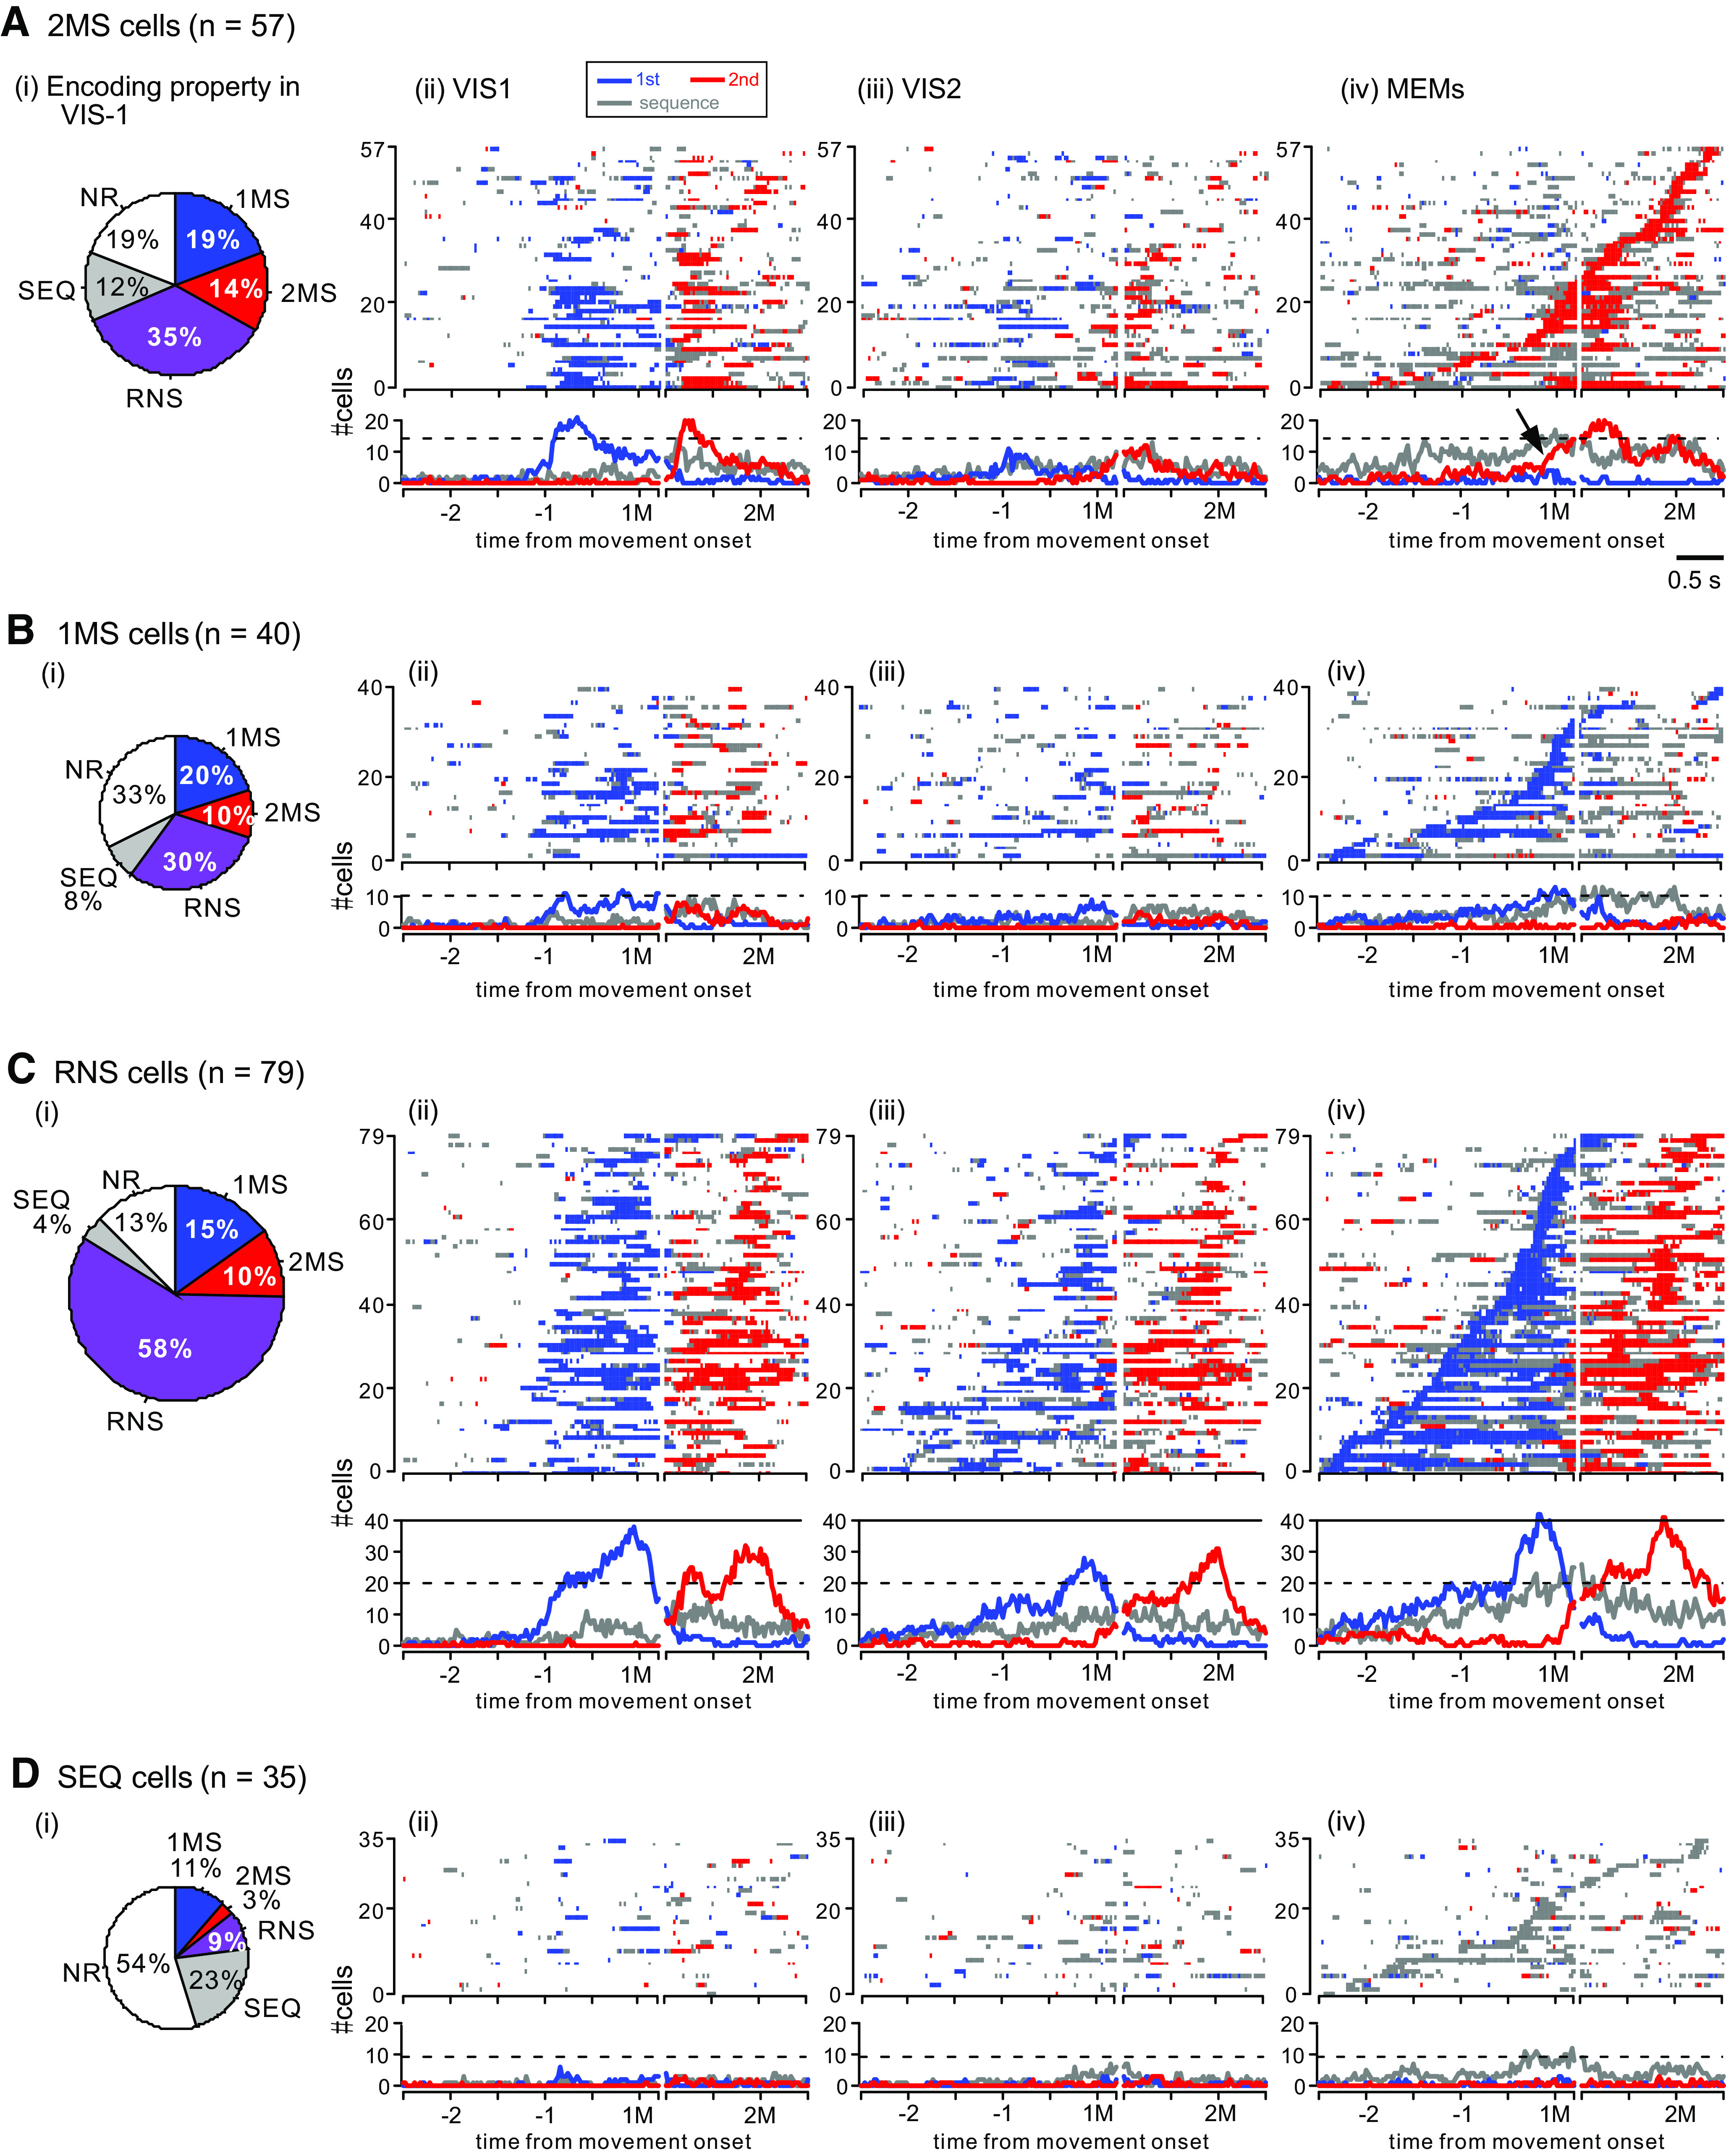
Population activity of task-related cells in pre-SMA. A–D show population activity of 2MS (A), 1MS (B), RNS (C) and SEQ cells (D) using the same format as that shown in Figure 5A–D. The arrow in A, iv indicates an abrupt increase in the cells exhibiting 2M selectivity. See Figure 10 for the population activity aligned with cue onsets in VIS1 and VIS2.
Figure 10.
Population activity of pre-SMA cells aligned with visual cue onsets. A–D show population activity of 2MS (A), 1MS (B), RNS (C) and SEQ cells (D) during the first (i) and second (ii) visually-guided trials. The basic display format is the same as that shown in Figure 6.
The population activity profiles of the 1MS cells are shown in Figure 9B. Their proportion in the task-related cells (40/211, 19%) was still smaller than that of the 2MS cells (57/211, 27%). Similar to that in the 2MS cells, there was also a transition in the encoding property from reactive to predictive encoding. A variation in the encoding property in VIS1 is shown in Figure 9Bi. Specifically, a total of 40% (16/40) of the 1MS cells exhibited selective activity for the 2M in VIS1 (Fig. 9Bii) and were classified as either 2MS or RNS type (Fig. 9Bi). In VIS2, the selectivity of both movements was less prominent, presumably reflecting the activity transition (Fig. 9Biii). Then, the activity became exclusively selective for the 1M in the MEMs (Fig. 9Biv).
As in PMd, the RNS cells formed the largest group, accounting for 79/211 (37%) task-related cells (Fig. 9C). Most of them (76/79, 96%) were considered to be involved in the preparation or execution of both the 1M and 2M in the MEMs (Fig. 9Civ, top). In VIS1, RNS cells showed the selectivity for each movement in response to the corresponding visual cue (Fig. 9Cii; see also Fig. 10Ci). Their encoding properties in VIS1 were moderately consistent with those in the MEMs (Fig. 9Ci); the majority of RNS cells (46/79, 58%) defined in the MEMs also exhibited RNS-type activity in VIS1. In VIS2 (Fig. 9Ciii; see also Fig. 10Cii), the onset of the selectivity became less time-locked to the cue presentations.
The SEQ cells accounted for 17% (35/211) of the task-related cells in pre-SMA (Fig. 9D). Activity of more than half of the SEQ cells was not task-related in VIS1 (Fig. 9Di). The emergence of sequence-selective activity around the 1M in the VIS2 indicate that the SEQ cells acquired the activity while memorizing a motor sequence.
Comparison of 2MS and RNS cells between PMd and pre-SMA
To characterize how a rank order in a sequence influenced motor representation in each area, we compared the proportions of 1MS, 2MS, and SEQ cells between the two areas (Fig. 11A). Although we encountered 2MS cells more often than 1MS cells in both areas, we found that the ratio of the 2MS cells relative to the 1MS cells in PMd (90/30, 3.0) was significantly greater than the corresponding ratio in pre-SMA (57/40, 1.4), as shown via two-tailed Z-test (z = 2.40, p = 0.016). This indicates that neuronal representation in PMd is more biased toward the 2M than that in pre-SMA, and that the encoding property in pre-SMA cells is more balanced between the 1M and 2M. The proportion of SEQ cells in pre-SMA (35/211) were significantly greater than those in PMd (24/275; z = 2.49, p = 0.013), whereas RNS cells were significantly more prevalent in PMd (131/275) than in pre-SMA (79/211; z = 2.16, p = 0.031). It supports the view that pre-SMA is more specialized in encoding an entire sequence than an individual movement per se.
To examine whether there was a difference in the distribution of the four types of task-related cells along the rostro-caudal axis, we operationally defined the portion that encompassed the caudal 2 mm of the recording area in PMd as “(c)PMd” and the remaining rostral portion as “(r)PMd” for both monkeys. We likewise subdivided the recording area in pre-SMA rostro-caudally into “(c)pre-SMA,” and “(r)pre-SMA” with respect to the line drawn at 3 mm rostral to the caudal boundary. The result is shown in Table 1. Although we found that the percentage of the entire task-related cells within all recorded cells was significantly greater in the caudal portion than in the rostral portion for both cortical areas [(c)PMd, 87.3% vs (r)PMd, 75.7%; z = 2.59, p = 0.0096; (c)pre-SMA, 82.2% vs (r)pre-SMA, 67.7%; z = 2.55, p = 0.011 by two-tailed Z-test], there was no difference in the distribution of four types of task-related cells between the rostral and caudal portions of each area (PMd, p = 0.124; pre-SMA, p = 0.846; Fisher's exact test).
Table 1.
Classification of task-related cells in caudal and rostral portions of PMd and pre-SMA
| Subdivisions | Classification of task-related cells |
Total number of task-related cells | Total number of recorded cells | |||
|---|---|---|---|---|---|---|
| 1MS | 2MS | RNS | SEQ | |||
| (c)PMd | 17 | 52 | 91 | 12 | 172 | 197 |
| (r)PMd | 13 | 38 | 40 | 12 | 103 | 136 |
| (c)pre-SMA | 26 | 40 | 56 | 26 | 148 | 180 |
| (r)pre-SMA | 14 | 17 | 23 | 9 | 63 | 93 |
As we have demonstrated in Figures 5, 6 and 9, 10, cells that exhibited predictive activity in MEMs often showed reactive activity in VIS1. For the example cells shown in Figures 2 and 7, the selectivity for 2M was highly consistent between MEMs and VIS1 despite the activity transition. To examine whether the consistency held in a population level and how it depended on strength of the tuning, we chose the 2MS and RNS cells that also exhibited 2M-selective activity in VIS1, and plotted the V-M correlation index against the maximum for 2M for these cells (Fig. 11B). We found that V-M correlation index was positive in most 2MS cells (PMd, 35/42, 83%; pre-SMA, 19/28, 64%) and RNS cells (PMd, 89/107, 83%; pre-SMA, 44/54, 81%) in both areas. Moreover, we found a significant positive linear relationship between the and V-M correlation index for all categories (PMd 2MS cells, 1.21 ± 0.19, slope of the regression line ± SE, t(40) = 6.39; RNS cells, 1.16 ± 0.12, t(105) = 9.56; pre-SMA 2MS cells, 1.61 ± 0.28, t(26) = 5.75; RNS cells, 1.14 ± 0.13, t(52) = 5.02; p < 10−5 for all categories by two-tailed t test); the stronger the tuning for 2M, the more consistent the selectivity for 2M between VIS1 and MEMs.
Next, we focused on the duration of task-related activity in 2MS and RNS cells. Figure 11C shows the transition of mean numbers of bins during which a cell exhibited 1M-selective, 2M-selective, or sequence-selective activity. Overall, cells exhibited task-related activity in increasing number of bins as the task progressed, reflecting the transition from reactive- to predictive encoding. This is mostly accounted for by the prolongation of 2M-selective and sequence-selective activity. The number of bins that detected 1M-selective activity dramatically reduced during the activity transition of 2MS cells in both areas (left panels), whereas it almost remained unchanged in PMd RNS cells (top right panel) or increased in pre-SMA RNS cells (bottom right panel).
Although we have identified 2MS cells more often than 1MS cells in both areas (Fig. 11A), one might argue that the apparent dominance of 2M-representation based on the cell counts might be dampened by the RNS cells that accounted for 48% of task-related cells in PMd, in particular. However, we found that 2M-selective activity occurred significantly more often than 1M-selective activity in PMd RNS cells (2M-selective, 39.1 ± 2.16 bins, mean ± SE; 1M-selective, 32.6 ± 2.18 bins; two-tailed paired t test, t(130) = 2.63, p = 0.0095; Fig. 11C, top right panel), strengthening the view that encoding of 2M predominates in PMd. In pre-SMA RNS cells, there was no significant difference in the number of bins containing 2M-selective activity and that containing 1M-selective activity (2M-selective, 27.0 ± 2.07 bins; 1M-selective, 29.8 ± 2.66 bins, t(78) = 0.94, p = 0.35; Fig. 11C, bottom right panel). Together, these results further support the idea that encoding in PMd is more biased toward 2M and that encoding in pre-SMA is more balanced between 1M and 2M.
To highlight the difference in the temporal activity profile of 2MS and RNS cells between PMd and pre-SMA, we compared the duration and onset of 2M-selective activity measured in the two areas during MEMs. As shown in Figure 11D, we found that 2M-selective activity occurred significantly more often in PMd than in pre-SMA for both 2MS cells (PMd, 45.3 ± 4.54 bins; pre-SMA, 22.3 ± 2.19 bins; t(208) = 3.75, p = 0.00022) and RNS cells (PMd, 39.1 ± 2.16 bins; pre-SMA, 27.0 ± 2.07 bins; two-tailed t test, t(145) = 3.82, p = 0.00019). Moreover, 2M-selective activity started earlier in PMd than in pre-SMA for both categories of cells (2MS cells, Mann–Whitney U test, two-tailed, W = 1862.5, p = 0.0053; RNS cells, W = 4040, p = 0.0078; Fig. 11E). It is notable that 50% (45/90) of the 2MS cells in PMd had exhibited 2M-selective activity by the onset of the 1M, whereas the corresponding figure in pre-SMA was 37% (21/57). These findings confirm the trend in which PMd encodes the 2M earlier and more continually than pre-SMA.
Activity enhancement in non-REPs in PMd and pre-SMA
We often observed activity attenuation in 2MS cells in the REPs compared with that in the non-REPs (Figs. 3, 7C, 8A). In other words, 2MS cell activity was often more enhanced in the non-REPs than in the REPs. Figure 12 depicts the time course of population-level activity enhancement in the non-REPs relative to that in the REP, together with the significance level of the difference between the non-REPs and the REP. Inspection of the color code continuity reveals that activity enhancement in PMd started >1.5 s before the 1M onset and ceased immediately after the 1M (Fig. 12A). In contrast, activity enhancement in pre-SMA started immediately before the 1M and discontinued ∼0.35 s before the 2M (Fig. 12B).
Figure 12.
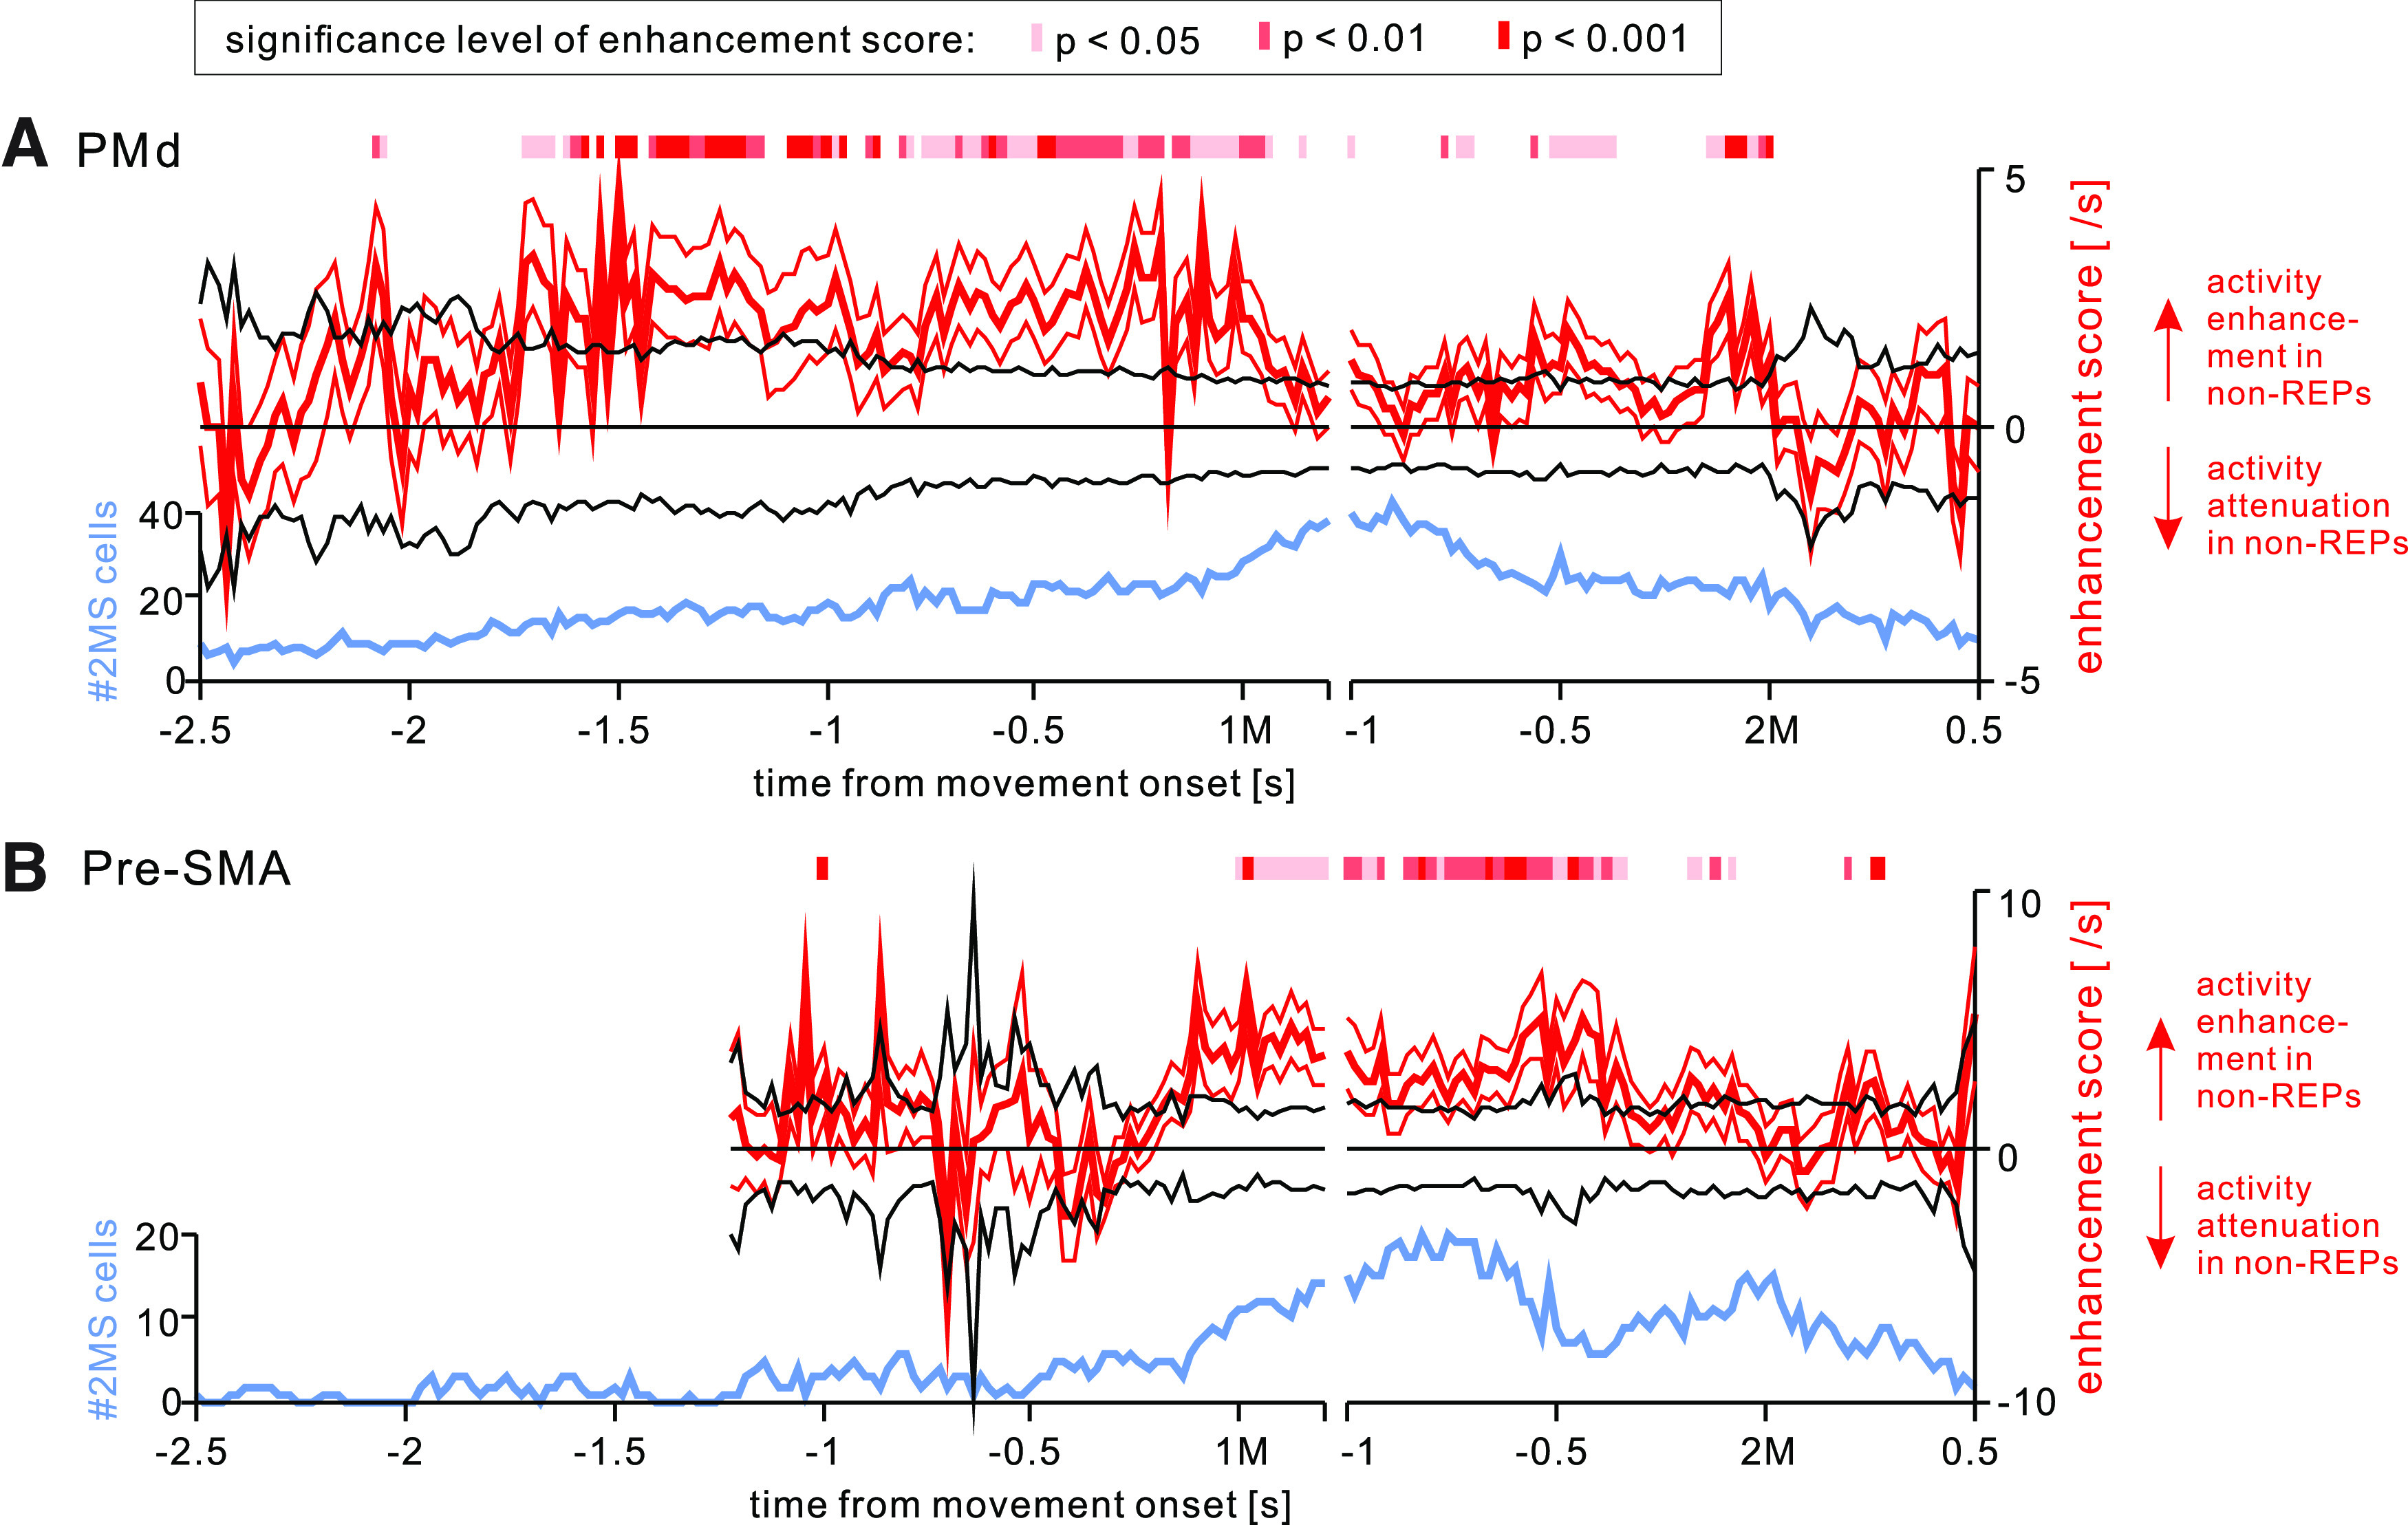
Activity enhancement in nonrepetition sequences for 2MS cells. Time courses of the activity enhancement score during non-REPs relative to REPs (left vertical axis; thick red trace with 95% confidence limits) in 2MS cells, superimposed on the number of 2MS cells exhibiting 2M-selective activity at each instance (right vertical axis; light blue trace) for (A) PMd and (B) pre-SMA. Black traces on both sides of the horizontal axis indicate the 95% confidence limits of the enhancement score calculated for the REPs. Red segments on each plot show the periods during which the enhancement score in non-REPs was significantly (p < 0.05) greater than that in REPs (i.e., zero) by a two-tailed t test. The density of each red segment indicates the significance level, as shown in the inset in A.
To visualize the temporal relationship between the enhancement and the number of recruited cells, we also plotted the number of 2MS cells that exhibited 2M-selective activity in each bin. In PMd, activity enhancement occurred before the number of recruited 2MS cells peaked. In contrast, in pre-SMA, activity enhancement coincided with the peak of the recruited number of 2MS cells.
In summary, the two areas showed differences in both the timing of activity enhancement and its temporal relationship with the number of recruited cells.
Attenuation of single-unit activity predicts a premature error
Our behavioral analyses revealed that premature (PREM) errors accounted for most errors that occurred during the 1M (Fig. 1Di). This prompted us to investigate the relationship between 2MS cell activity and the actual performance of MEMs. To this end, we performed a single-cell level analysis (Fig. 13A,B) and population-level analysis (Fig. 13C) in both areas that compared the activity between error and correct trials.
Figure 13.
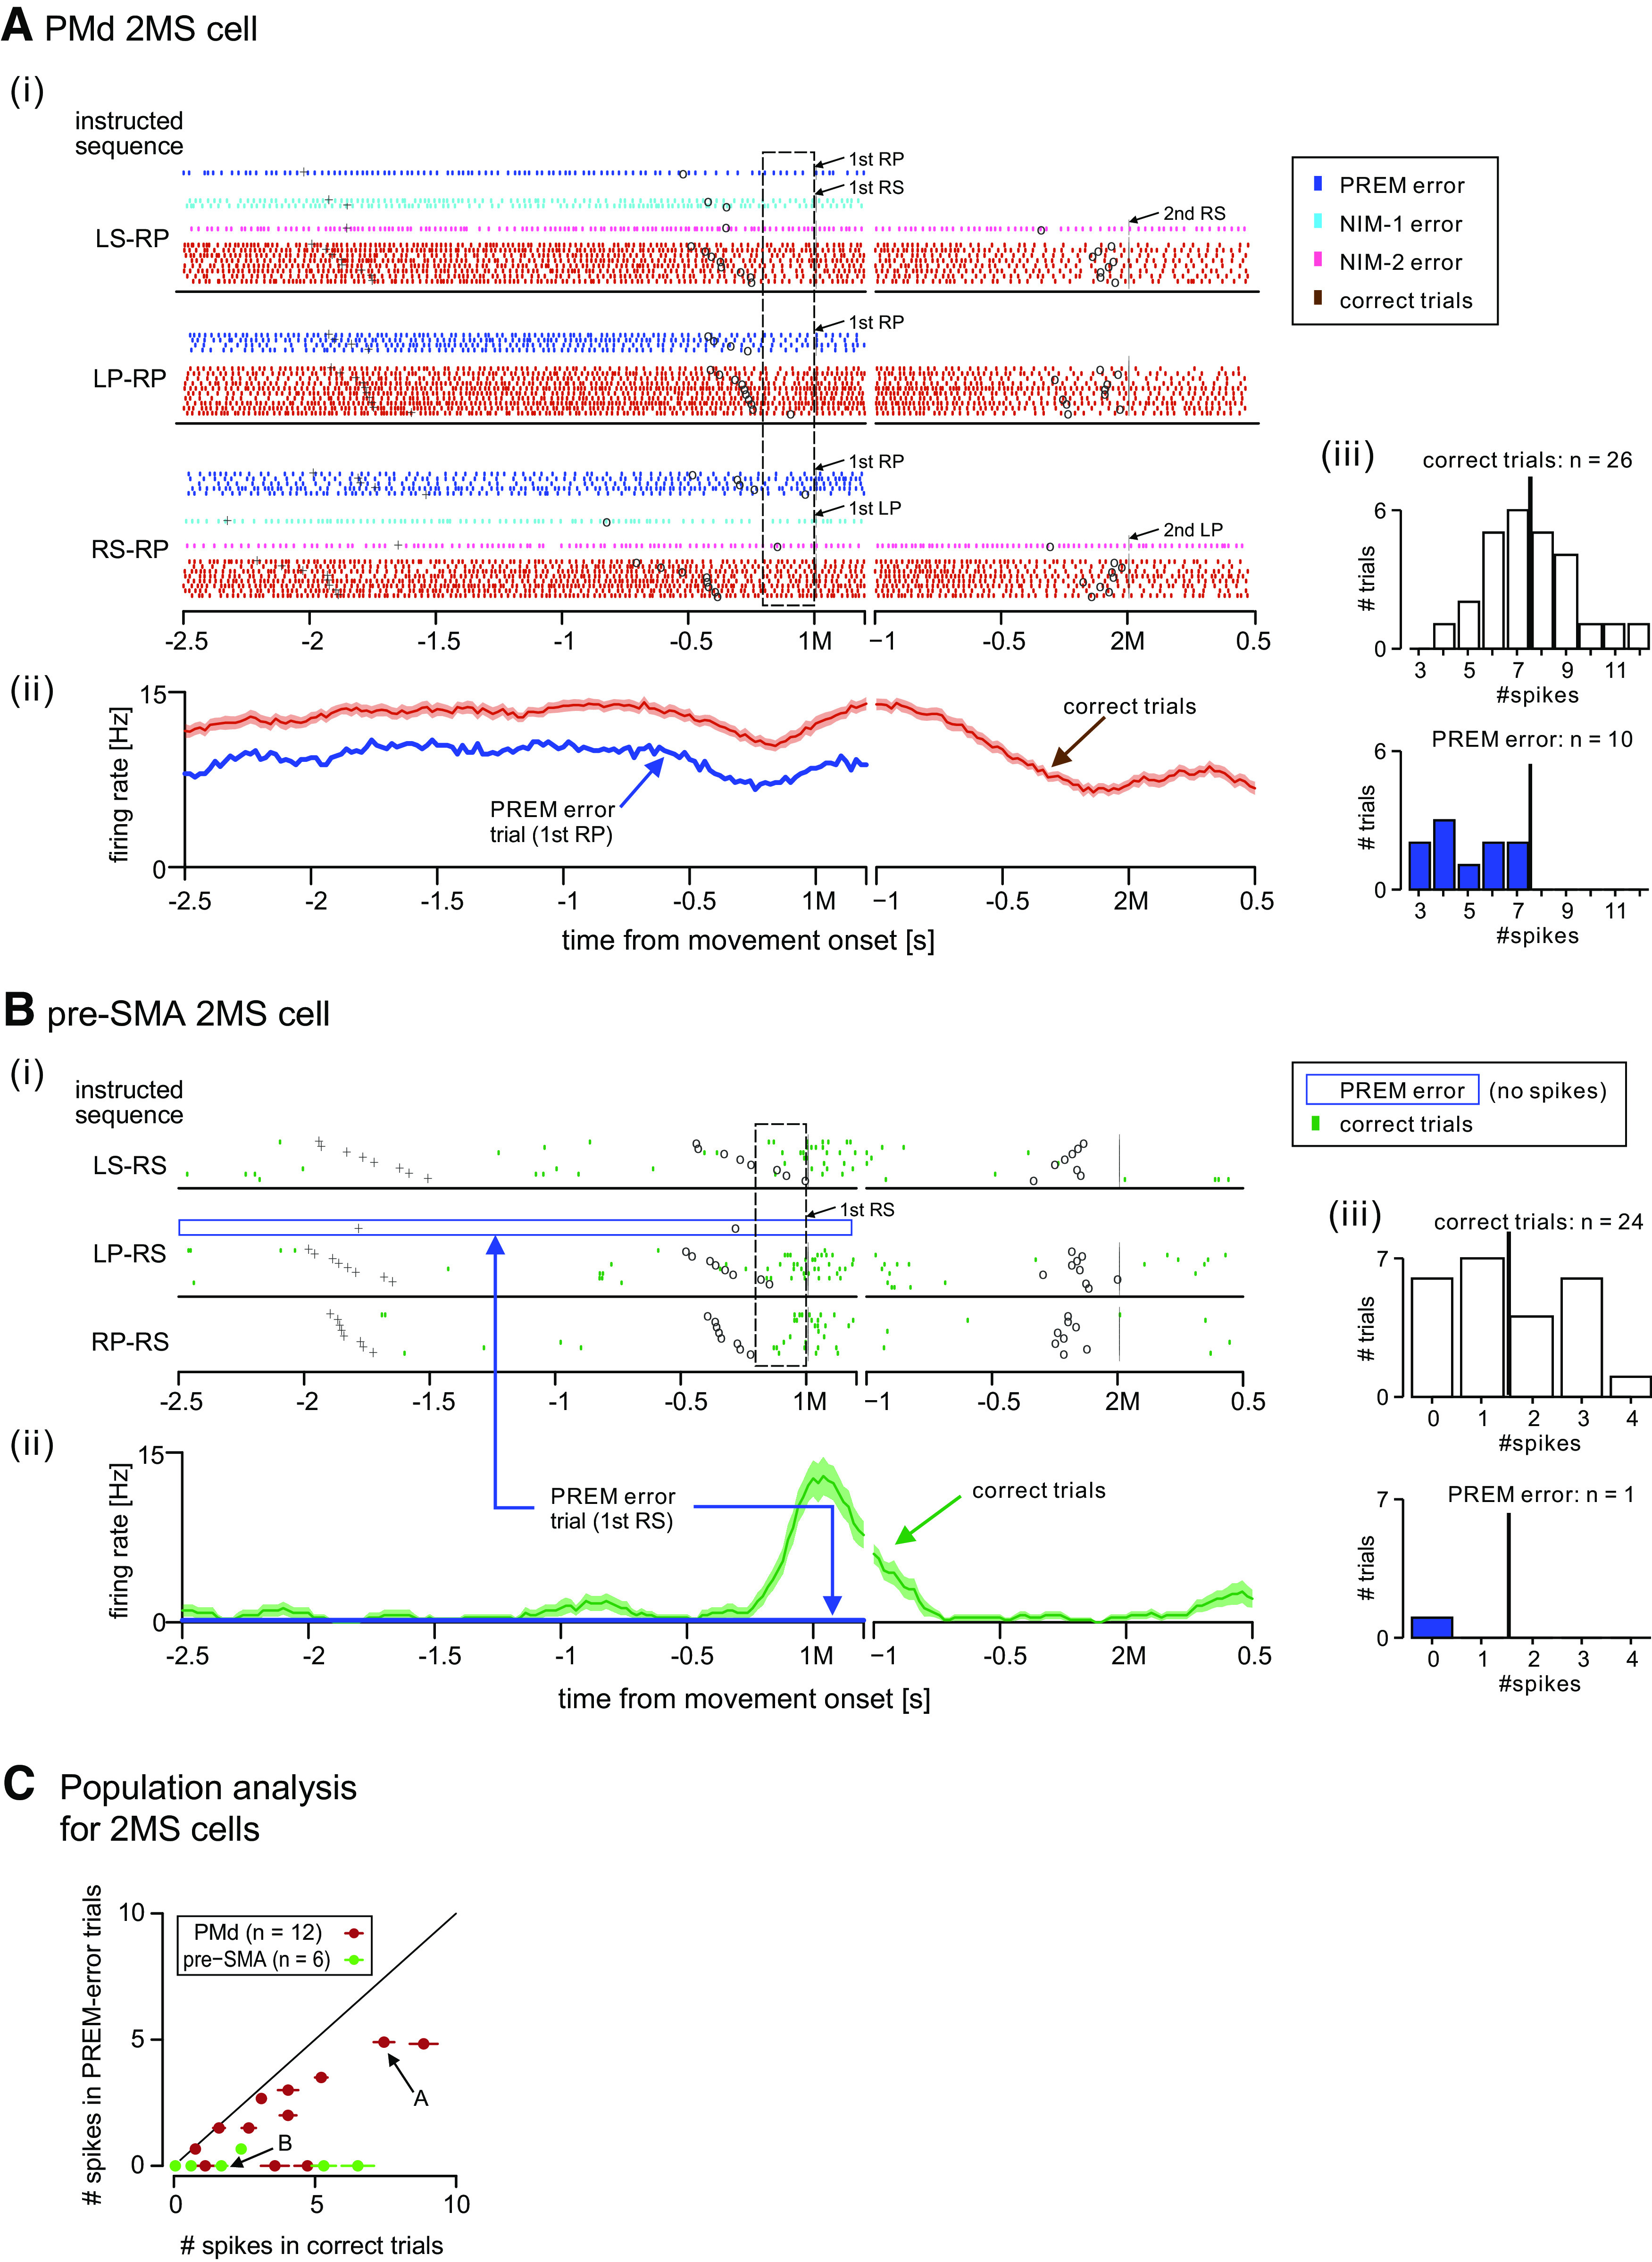
Decrease in 2MS cell activity predicts premature error. A, A comparison of the activity of PMd 2MS cell that appeared in Figure 3 between the error and correct trials. i, Spiking activity of the cell when the monkey had to perform the nonrepetition sequences, including the cell's preferred 2M (RP) from memory, sorted by the 1M. Different types of error trials, as well as correct trials, are color-coded, as shown in the inset. Labels and associated arrows indicate the actual erroneous movements and when they occurred. The dashed rectangle indicates the first premovement period. ii, Time courses of the mean firing rate in correct trials with SE (brown trace) and that in PREM error trials (blue). iii, Distribution of spike counts observed during the first premovement period in the correct (top) and PREM-error (bottom) trials. The thick vertical bar indicates the mean spike count in the correct trials. B, Activity of pre-SMA 2MS cell that was shown in Figure 8A, when the monkey had to perform nonrepetition sequences, including the cell's preferred movement (RS) from memory. As shown by the blue open rectangle in i, there was no spiking activity before the monkey prematurely performed RS. The other display formats are the same as those in A. C, Comparison of activity during first premovement period between correct trials and PREM errors. For each 2MS cell in PMd (brown) and pre-SMA (green), the mean spike count in PREM errors is plotted against that in correct trials. The horizontal segment superimposed on each symbol indicates SEM spike count in correct trials. SEs for the PREM errors are not presented because the error typically happened only once or twice while recoding a cell. Arrows indicate the cells shown in A, B.
Figure 13A illustrates the activity of PMd 2MS cell, which was identical to the 2MS cell shown in Figure 3, in error trials as well as in correct trials when the monkey had to perform the non-REPs that included the cells' preferred 2M (RP). Overall, the monkey committed 15 errors out of 41 trials, including 10 PREM errors, followed by three NIM-1 errors and two NIM-2 errors (Fig. 13Ai). Here, we focused on PREM errors and compared the associated activity with the activity in correct trials. As shown in Figure 13Aii, the average firing rate before the occurrence of PREM errors was continuously lower than that of the correct trials.
We performed a similar analysis for the pre-SMA 2MS cell that we have shown in Figure 8A (Fig. 13B). An example of cell is shown in Figure 8A. Its preferred 2M was RS. As shown in Figure 13Bi, the monkey committed only one PREM error out of the 25 trials. Remarkably, the cell was silent before the monkey committed the PREM error (Fig. 13Bi,ii).
To qualitatively investigate the relationship between the cell activity immediately before the 1M and error type, we defined the “first premovement period” as the 200-ms interval before the 1M. We plotted the number of trials against the number of spikes within this period (Fig. 13Aiii,Biii). Both figures show that the 2MS cells fired infrequently in PREM-error trials compared with the mean spike count in correct trials.
To examine the activity attenuation in a population level, we selected a total of 18 (12 in PMd, 6 in pre-SMA) 2MS cells that satisfied both of the following conditions: (1) exhibiting 2M-selective activity in the first premovement period; and (2) observing at least one PREM error among the trials including the cell's preferred 2M. For these cells, we plotted the mean spike count in PREM errors against that in correct trials (Fig. 13C). We found that the activity before PREM errors was significantly attenuated than the activity in correct trials in both PMd (W = 78, Wilcoxon signed-rank test, two-tailed, p = 0.00049) and pre-SMA (W = 21, p = 0.031).
Discussion
We recorded single-unit activity in PMd and pre-SMA while the monkeys memorized and executed multiple motor sequences. Focusing on rank-specific cells, we demonstrated distinct contributions of PMd and pre-SMA to the performance of two movement sequences. Below, we discuss how our findings can extend the existing concepts of the function of these areas concerning the performance of motor sequences.
Encoding bias toward the 2M in PMd
The present study showed the abundance of the 2MS cell activity compared with that of 1MS, even before the 1M in PMd. Shanechi and colleagues also found PMd cells encoding the second target to reach; however, they showed an abundance of first target-encoding cells compared with the second target-encoding cells (Shanechi et al., 2012; see their Fig. 6). Specifically, they trained monkeys to reach two targets in an instructed order and analyzed cell activity in PMd during a working memory (WM) period. The question arises as to why the proportions of cells representing the first and second elements in a sequence differ between the two studies. This is probably because the cells encoding the first target in their study included both 1MS-type and RNS-type cells per our definition. Another reason would be that cells could encode the 2M in an earlier phase of a trial or even during intertrial intervals in our study because we trained the monkeys to keep an instructed sequence in their minds across trials.
A question still remains as to why the 2M representation dominated in PMd in the present study, although both movements had to be performed properly to earn the reward. Pastor-Bernier and Cisek (2011) found that directionally tuned cells showed strong effects toward the value and reward magnitude associated with their preferred target compared with those of the other target. According to Berger et al. (2020), PMd encodes a reach goal beyond the immediate reach. These studies led us to speculate that the monkeys regarded the 2M in the sequence, which was temporally closer to the reward, as the behavioral goal; thus, the representation of the 2M was more enhanced than that of the first.
Contrasting our results with those of Cisek and Kalaska (2005) provides insights into how PMd encodes multiple movements under different task conditions. They found that while a monkey decides between two different potential reaching movements, the activity of the potential response (PR) cells in PMd represents both options simultaneously. The present study showed the simultaneous representation of two movements in a sequence in PMd. Although the concurrent representation of the two potential movements seems consistent between these studies, the 2MS cells are not functionally equivalent to the PR cells in the study by Cisek and Kalaska (2005) because of the following two differences in activity properties. First, the PR cells were active in both the preparatory and execution periods when approaching the cells' preferred direction. In contrast, the 2MS cells in the present study were activated mainly during the preparatory period, but the activity often ceased before executing the 2M. Second, the PR cells terminated the activity when the specified target for the immediate reach was opposite to its preferred direction. In contrast, many 2MS cells in our study fired before the 1M, although there was no possibility of performing the 2M immediately. Therefore, we suggest that the 2MS cells in PMd reside upstream of the cells that participate in motor execution. Furthermore, we propose a “cooperative representation model,” in which the two groups of cells represent two movements in a sequence cooperatively compared with the “biased competition model” proposed by Cisek (2006).
While we found that 2MS cells were three times the number of 1MS cells in PMd, the corresponding ratio for pre-SMA was 1.4. This indicates that pre-SMA represents two movements more evenly than PMd. As for the activity onset, the 2MS cells in pre-SMA started to exhibit 2M-selective activity later than those in PMd; pre-SMA activity emerged just before the 1M, as shown by Nakajima et al. (2009) and peaked after the movement. In addition, sequence-selective activity was more abundant in pre-SMA than in PMd. These results suggest that pre-SMA is more concerned with the temporal organization of multiple movements per se, as discussed by Tanji (2001), rather than encoding the contingency between an action and a reward.
Transition of information encoding in PMd and pre-SMA: from visually guided to memory-guided trials
We found that cells tuned to either 1M or 2M in memory-guided trials (e.g., 1MS and 2MS cells) often encoded the 1M followed by the 2M, exhibiting RNS representation in VIS1. In particular, more than half of the 2MS cells in both areas showed RNS-type activity in VIS1. Because we did not alter the contingency between the color cues and the movements, it is difficult to determine the extent to which cell activity in VISs reflected the color or the instructed movement. On the basis of this limitation, we discuss what the transition of cell activity during an entire trial block implies regarding the function of both areas. It seems that adaptive coding, which was initially conceptualized with regard to the prefrontal cortex (Duncan, 2001), is also implemented in both areas. This view is supported by Falcone et al. (2017), in which pre-SMA cells exhibited differential patterns of activity between agents in a human-monkey alternation task. We suggest that a transition occurred from reactive to predictive encoding in the present study. Namely, the population activity of 2MS cells seemed reactive to each visual cue in VIS1. This reactive activity was not likely to prepare or execute a particular movement because 2MS cells did not encode the 1M in the MEMs. Rather, the reactive activity could take part in action selection (Kurata and Wise, 1988) and retrieval (Hoshi and Tanji, 2006) based on the conditional cues in PMd, or updating motor sequences in pre-SMA (Shima et al., 1996). Thereafter, the activity became less reactive to the first cue but rather predictive of the 2M in VIS2, presumably reflecting the internalization of the motor sequence. The predictive activity was robust in the MEMs. To our knowledge, such qualitative changes in the cell activity from reactive to predictive mode in a motor-related area have not been reported previously, although a few reports have highlighted cell activity preferential to a particular learning phase. For example, Hikosaka et al. (1999) stressed the involvement of the premotor area and pre-SMA in the early stage of learning, which requires a transition from spatial (visual) to motor sequences. However, Ohbayashi et al. (2016) reported that PMd cells preferred internally generated spatial sequences rather than visually guided spatial sequences. A similar discussion is possible for the activity transition in 1MS cells in each area, although they are not as distinct as 2MS cells.
PMd precedes pre-SMA in encoding switching motor plans
We found activity related to switching actions in a sequence in both areas. Furthermore, we found that a decrease in switch-related activity predicted a premature error. Previous studies have reported the roles of pre-SMA (Matsuzaka and Tanji, 1996; Isoda and Hikosaka, 2007) and PMd (Pastor-Bernier et al., 2012) at a single-unit level. Pre-SMA cells have been shown to increase the firing rate in response to a cue that instructs switching direction between two alternative movements (Matsuzaka and Tanji, 1996) or a change in cue color that instructs reward contingency of two targets (Isoda and Hikosaka, 2007). Both studies addressed neuronal activity concerning switching between two action plans. However, the present study involved switching among four potential movements (i.e., 16 different permutations). According to the results pre-SMA cells distinguish multiple non-REP patterns from REPs, suggesting that pre-SMA takes part in higher-order switching to multiple actions. This view is supported by Muessgens et al. (2016) and Nakajima et al. (2013).
It has been shown that PMd cell activity correlates with switching motor plans on-line (Pastor-Bernier et al., 2012). In their study, the monkeys were often forced to reach the target different from the one they initially intended to reach. PMd switching-related activity reflected the real-time updating of motor plans. In contrast, we found robust activity enhancement in PMd 2MS cells before the monkey initiated a motor sequence that included switching movements. In this regard, the enhancement we found reflects anticipated switching rather than online switching.
Altogether, 2MS cell activity in both cortical areas enhanced in non-REPs appeared to encode a switch to a particular 2M regardless of the 1M in a cue-independent manner. The attenuation of the activity seemed to lead to the premature execution (error) of the 2M instead of 1M. However, the onset of the switch-related activity was earlier in PMd, followed by that in pre-SMA. This leads us to speculate that PMd anticipates switching in a goal-oriented manner from the beginning of a trial, while pre-SMA controls switching in a temporally coordinated manner from around the 1M. It is noteworthy that individual cells within each area had distinct time windows to signal the switching to a particular 2M, and at the population level, the activity shifted from the cells activated earlier to those activated later in a cascading manner. We note that this cascading activity pattern in PMd comprised some 2MS cells that represented the 2M only transiently, as well as those representing it persistently, as shown in Figure 5Aiv.
In conclusion, we propose that PMd preferentially controls the final action in a sequence that ultimately leads to a reward in a prospective manner, whereas pre-SMA coordinates switching among multiple actions within the context of the sequence.
Footnotes
This work was supported by The Ministry of Education, Culture, Sports, Science and Technology (MEXT)/Japan Society for the Promotion of Science (JSPS) Grants-in-Aid for Scientific Research (KAKENHI) Grant Numbers JP16H06276 (Platform of Advanced Animal Model Support) and JP19H03337 (Kiban B; to H.M.) and JP19K06934 (Kiban C) (to T.N.). We thank Mr. Mamoru Kurama, Mr. Yukio Takahashi, and Ms. Midori Takahashi for their technical support and Dr. Trevor Drew and Ayuno Nakahashi for helpful discussions.
The authors declare no competing financial interests.
References
- Amador N, Fried I (2004) Single-neuron activity in the human supplementary motor area underlying preparation for action. J Neurosurg 100:250–259. 10.3171/jns.2004.100.2.0250 [DOI] [PubMed] [Google Scholar]
- Berger M, Agha NS, Gail A (2020) Wireless recording from unrestrained monkeys reveals motor goal encoding beyond immediate reach in frontoparietal cortex. Elife 9:e51322. 10.7554/eLife.51322 [DOI] [PMC free article] [PubMed] [Google Scholar]
- Boussaoud D, Wise SP (1993) Primate frontal cortex: neuronal activity following attentional versus intentional cues. Exp Brain Res 95:15–27. [DOI] [PubMed] [Google Scholar]
- Cisek P (2006) Integrated neural processes for defining potential actions and deciding between them: a computational model. J Neurosci 26:9761–9770. 10.1523/JNEUROSCI.5605-05.2006 [DOI] [PMC free article] [PubMed] [Google Scholar]
- Cisek P, Kalaska JF (2004) Neural correlates of mental rehearsal in dorsal premotor cortex. Nature 431:993–996. 10.1038/nature03005 [DOI] [PubMed] [Google Scholar]
- Cisek P, Kalaska JF (2005) Neural correlates of reaching decisions in dorsal premotor cortex: specification of multiple direction choices and final selection of action. Neuron 45:801–814. 10.1016/j.neuron.2005.01.027 [DOI] [PubMed] [Google Scholar]
- Crammond DJ, Kalaska JF (1994) Modulation of preparatory neuronal activity in dorsal premotor cortex due to stimulus-response compatibility. J Neurophysiol 71:1281–1284. 10.1152/jn.1994.71.3.1281 [DOI] [PubMed] [Google Scholar]
- Crammond DJ, Kalaska JF (2000) Prior information in motor and premotor cortex: activity during the delay period and effect on pre-movement activity. J Neurophysiol 84:986–1005. 10.1152/jn.2000.84.2.986 [DOI] [PubMed] [Google Scholar]
- di Pellegrino G, Wise SP (1993) Visuospatial versus visuomotor activity in the premotor and prefrontal cortex of a primate. J Neurosci 13:1227–1243. 10.1523/JNEUROSCI.13-03-01227.1993 [DOI] [PMC free article] [PubMed] [Google Scholar]
- Duncan J (2001) An adaptive coding model of neural function in prefrontal cortex. Nat Rev Neurosci 2:820–829. 10.1038/35097575 [DOI] [PubMed] [Google Scholar]
- Falcone R, Cirillo R, Ferraina S, Genovesio A (2017) Neural activity in macaque medial frontal cortex represents others' choices. Sci Rep 7:12663. [DOI] [PMC free article] [PubMed] [Google Scholar]
- Gerloff C, Corwell B, Chen R, Hallett M, Cohen LG (1997) Stimulation over the human supplementary motor area interferes with the organization of future elements in complex motor sequences. Brain J Neurol 120:1587–1602. 10.1093/brain/120.9.1587 [DOI] [PubMed] [Google Scholar]
- Hikosaka O, Nakahara H, Rand MK, Sakai K, Lu X, Nakamura K, Miyachi S, Doya K (1999) Parallel neural networks for learning sequential procedures. Trends Neurosci 22:464–471. 10.1016/S0166-2236(99)01439-3 [DOI] [PubMed] [Google Scholar]
- Hoshi E, Tanji J (2002) Contrasting neuronal activity in the dorsal and ventral premotor areas during preparation to reach. J Neurophysiol 87:1123–1128. 10.1152/jn.00496.2001 [DOI] [PubMed] [Google Scholar]
- Hoshi E, Tanji J (2004) Differential roles of neuronal activity in the supplementary and presupplementary motor areas: from information retrieval to motor planning and execution. J Neurophysiol 92:3482–3499. 10.1152/jn.00547.2004 [DOI] [PubMed] [Google Scholar]
- Hoshi E, Tanji J (2006) Differential involvement of neurons in the dorsal and ventral premotor cortex during processing of visual signals for action planning. J Neurophysiol 95:3596–3616. 10.1152/jn.01126.2005 [DOI] [PubMed] [Google Scholar]
- Isoda M, Hikosaka O (2007) Switching from automatic to controlled action by monkey medial frontal cortex. Nat Neurosci 10:240–248. 10.1038/nn1830 [DOI] [PubMed] [Google Scholar]
- Kurata K, Wise SP (1988) Premotor cortex of rhesus monkeys: set-related activity during two conditional motor tasks. Exp Brain Res 69:327–343. [DOI] [PubMed] [Google Scholar]
- Laplane D, Talairach J, Meininger V, Bancaud J, Orgogozo JM (1977) Clinical consequences of corticectomies involving the supplementary motor area in man. J Neurol Sci 34:301–314. 10.1016/0022-510X(77)90148-4 [DOI] [PubMed] [Google Scholar]
- Lashley KS (1951) The problem of serial order in behavior, Vol 21, p 21. Oxford: Bobbs-Merrill. [Google Scholar]
- Luppino G, Matelli M, Camarda RM, Gallese V, Rizzolatti G (1991) Multiple representations of body movements in mesial area 6 and the adjacent cingulate cortex: an intracortical microstimulation study in the macaque monkey. J Comp Neurol 311:463–482. 10.1002/cne.903110403 [DOI] [PubMed] [Google Scholar]
- Lurii︠a︡ AR (1966) Higher cortical functions in man. London: Tavistock. [Google Scholar]
- Matsuzaka Y, Tanji J (1996) Changing directions of forthcoming arm movements: neuronal activity in the presupplementary and supplementary motor area of monkey cerebral cortex. J Neurophysiol 76:2327–2342. 10.1152/jn.1996.76.4.2327 [DOI] [PubMed] [Google Scholar]
- Matsuzaka Y, Aizawa H, Tanji J (1992) A motor area rostral to the supplementary motor area (presupplementary motor area) in the monkey: neuronal activity during a learned motor task. J Neurophysiol 68:653–662. 10.1152/jn.1992.68.3.653 [DOI] [PubMed] [Google Scholar]
- Muessgens D, Thirugnanasambandam N, Shitara H, Popa T, Hallett M (2016) Dissociable roles of preSMA in motor sequence chunking and hand switching—a TMS study. J Neurophysiol 116:2637–2646. 10.1152/jn.00565.2016 [DOI] [PMC free article] [PubMed] [Google Scholar]
- Mushiake H, Inase M, Tanji J (1991) Neuronal activity in the primate premotor, supplementary, and precentral motor cortex during visually guided and internally determined sequential movements. J Neurophysiol 66:705–718. 10.1152/jn.1991.66.3.705 [DOI] [PubMed] [Google Scholar]
- Nakajima T, Hosaka R, Mushiake H, Tanji J (2009) Covert representation of second-next movement in the pre-supplementary motor area of monkeys. J Neurophysiol 101:1883–1889. 10.1152/jn.90636.2008 [DOI] [PubMed] [Google Scholar]
- Nakajima T, Hosaka R, Tsuda I, Tanji J, Mushiake H (2013) Two-dimensional representation of action and arm-use sequences in the presupplementary and supplementary motor areas. J Neurosci 33:15533–15544. 10.1523/JNEUROSCI.0855-13.2013 [DOI] [PMC free article] [PubMed] [Google Scholar]
- Nakamura K, Sakai K, Hikosaka O (1998) Neuronal activity in medial frontal cortex during learning of sequential procedures. J Neurophysiol 80:2671–2687. 10.1152/jn.1998.80.5.2671 [DOI] [PubMed] [Google Scholar]
- Nakamura K, Sakai K, Hikosaka O (1999) Effects of local inactivation of monkey medial frontal cortex in learning of sequential procedures. J Neurophysiol 82:1063–1068. 10.1152/jn.1999.82.2.1063 [DOI] [PubMed] [Google Scholar]
- Ohbayashi M, Picard N, Strick PL (2016) Inactivation of the dorsal premotor area disrupts internally generated, but not visually guided, sequential movements. J Neurosci 36:1971–1976. 10.1523/JNEUROSCI.2356-15.2016 [DOI] [PMC free article] [PubMed] [Google Scholar]
- Pastor-Bernier A, Cisek P (2011) Neural correlates of biased competition in premotor cortex. J Neurosci 31:7083–7088. 10.1523/JNEUROSCI.5681-10.2011 [DOI] [PMC free article] [PubMed] [Google Scholar]
- Pastor-Bernier A, Tremblay E, Cisek P (2012) Dorsal premotor cortex is involved in switching motor plans. Front. Neuroengineering 5:5. [DOI] [PMC free article] [PubMed] [Google Scholar]
- Raos V, Umiltá M-A, Gallese V, Fogassi L (2004) Functional properties of grasping-related neurons in the dorsal premotor area F2 of the macaque monkey. J Neurophysiol 92:1990–2002. 10.1152/jn.00154.2004 [DOI] [PubMed] [Google Scholar]
- Roland PE, Larsen B, Lassen NA, Skinhøj E (1980) Supplementary motor area and other cortical areas in organization of voluntary movements in man. J Neurophysiol 43:118–136. 10.1152/jn.1980.43.1.118 [DOI] [PubMed] [Google Scholar]
- Shanechi MM, Hu RC, Powers M, Wornell GW, Brown EN, Williams ZM (2012) Neural population partitioning and a concurrent brain-machine interface for sequential motor function. Nat Neurosci 15:1715–1722. 10.1038/nn.3250 [DOI] [PMC free article] [PubMed] [Google Scholar]
- Shima K, Tanji J (2000) Neuronal activity in the supplementary and presupplementary motor areas for temporal organization of multiple movements. J Neurophysiol 84:2148–2160. 10.1152/jn.2000.84.4.2148 [DOI] [PubMed] [Google Scholar]
- Shima K, Mushiake H, Saito N, Tanji J (1996) Role for cells in the presupplementary motor area in updating motor plans. Proc Natl Acad Sci U S A 93:8694–8698. 10.1073/pnas.93.16.8694 [DOI] [PMC free article] [PubMed] [Google Scholar]
- Tanji J (2001) Sequential organization of multiple movements: involvement of cortical motor areas. Annu Rev Neurosci 24:631–651. [DOI] [PubMed] [Google Scholar]
- Zar JH (2010) Biostatistical analysis. Upper Saddle River: Prentice-Hall/Pearson. [Google Scholar]


