

Summary
Mammalian SWI/SNF (mSWI/SNF or BAF) ATP-dependent chromatin remodeling complexes play critical roles in governing genomic architecture and gene expression and are frequently perturbed in human cancers. Transcription factors (TFs), including fusion oncoproteins, can bind to BAF complex surfaces to direct chromatin targeting and accessibility, often activating oncogenic gene loci. Here, we demonstrate that the FUS::DDIT3 fusion oncoprotein hallmark to myxoid liposarcoma (MLPS) inhibits BAF complex-mediated remodeling of adipogenic enhancer sites via sequestration of the adipogenic TF, CEBPB, from the genome. In mesenchymal stem cells, small molecule inhibition of BAF complex ATPase activity attenuates adipogenesis via failure of BAF-mediated DNA accessibility and gene activation at CEBPB target sites. BAF chromatin occupancy and gene expression profiles of FUS::DDIT3-expressing cell lines and primary tumors exhibit similarity to SMARCB1-deficient tumor types. These data present a mechanism by which a fusion oncoprotein generates a BAF complex loss-of-function phenotype, independent of deleterious subunit mutations.
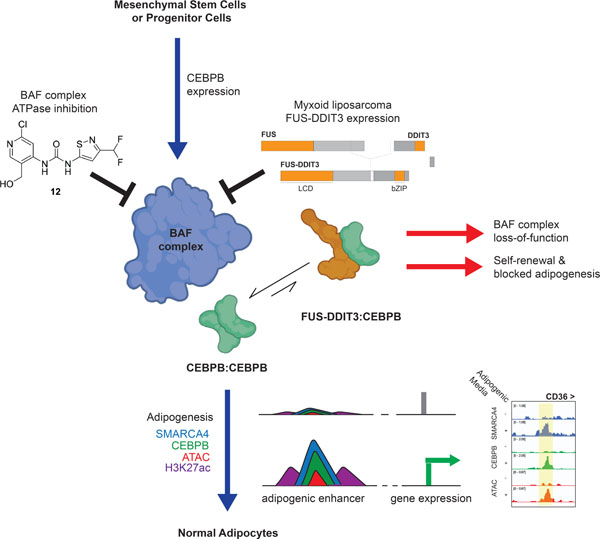
Graphical Abstract
eTOC Blurb
Zullow et al. demonstrate that the FUS-DDIT3 fusion oncoprotein inhibits the targeting and activity of the mSWI/SNF (BAF) chromatin remodeling complex in myxoid liposarcoma, driving the tumor’s unique gene expression signature, which is similar to that of other BAF loss-of-function tumors. BAF complex disruption similarly attenuates normal adipogenesis in MSCs.
Introduction
Chromosomal translocations are found in approximately 20% of all soft-tissue sarcomas (Åman, 2015; Nakano and Takahashi, 2018). Fusion oncoproteins generated by chromosomal translocations often delineate specific sarcoma types, such as FUS::DDIT3 in myxoid liposarcoma (Aman et al., 1992; Crozat et al., 1993; Rabbitts et al., 1993), EWS::FLI1 in Ewing sarcoma (Delattre et al., 1992), PAX3-FOXO1 in alveolar rhabdomyosarcoma (Barr et al., 1993; Galili et al., 1993), and SS18::SSX in synovial sarcoma (Crew et al., 1995; Smith et al., 1987). These fusion pairs most frequently involve nuclear proteins, including transcription factors, and are increasingly recognized to serve critical cancer-initiating roles via the disruption of key chromatin regulatory factors such as chromatin remodeling complexes (Bishop, 1987; Boulay et al., 2017; Brien et al., 2019; Gryder et al., 2017; Kadoch and Crabtree, 2013; McBride et al., 2018; Nacev et al., 2020; Rabbitts, 1994; Riggi et al., 2014).
Recent studies by our group and others have demonstrated that several fusion oncoproteins drive oncogenesis by collaborating with the mammalian SWI/SNF (mSWI/SNF or BAF) family of ATP-dependent chromatin-remodeling complexes, which play critical roles in the establishment and maintenance of genomic accessibility and gene expression (Clapier et al., 2017; Iurlaro et al., 2021; Kadoch and Crabtree, 2015). For example, the SS18::SSX fusion oncoprotein hallmark to synovial sarcoma dominantly replaces the wild-type SS18 subunit of BAF complexes, resulting in molecular ‘hijacking’ of BAF complexes to polycomb repressive complex (PRC) target sites genome-wide (Kadoch and Crabtree, 2013; McBride et al., 2020; McBride et al., 2018). Similarly, in Ewing sarcoma, the characteristic EWS::FLI1 fusion protein binds to and directs BAF complexes to a select set of GGAA repeat-containing enhancers, leading to oncogenic enhancer activation and gene expression (Boulay et al., 2017). In both fusion-driven cancers, one involving a stable and dedicated BAF complex subunit (SS18) and the other involving an ETS transcription factor that transiently associates with BAF complexes (FLI1), BAF complexes and their activities are mistargeted on chromatin in a gain-of-function manner to initiate and support oncogenic gene transcription.
Here, we sought to determine whether the FUS::DDIT3 fusion oncoprotein alters the activities of BAF complexes in myxoid liposarcoma (MLPS). MLPS is characterized by the t(12;16) chromosomal translocation event that fuses the N-terminal region of either FUS or EWS to the 5’ untranslated region of DDIT3 (Crozat et al., 1993; Panagopoulos et al., 1996; Rabbitts et al., 1993), with the FUS::DDIT3 fusion protein found in 95% of MLPS cases (Conyers et al., 2011; Jain et al., 2010). FUS::DDIT3 fusions harbor at least the first 3 exons of FUS and the entire coding region of DDIT3 (Figure S1A) (Antonescu et al., 2001; Knight et al., 1995; Kuroda et al., 1995; Panagopoulos et al., 1994; Powers et al., 2010; Yang et al., 1995). Similar to the EWS::FLI1 fusion protein in Ewing sarcoma, the N-terminal partner of FUS::DDIT3 (FUS) belongs to the FET protein family consisting of FUS, EWSR1, and TAF15 (Andersson et al., 2008), which harbor disordered protein regions compatible with phase separation (Nacev et al., 2020; Riggi et al., 2007; Ron, 1997; Schwartz et al., 2015). The C-terminal partner of FUS::DDIT3 (DDIT3) is a member of the CCAAT enhancer binding protein (C/EBP) family of transcription factors (TFs), which dimerize and bind their cognate motifs on DNA, serving critical roles in the development and differentiation of several tissue lineages, including adipocytes (Cao et al., 1991; Lindén et al., 2019; Nerlov, 2007; Tsukada et al., 2011). Notably, DDIT3 is a dominant negative member of this family, in that its dimerization with other C/EBP family members generates heterodimers that cannot bind C/EBP homodimer motifs on DNA (Adelmant et al., 1998; Ron and Habener, 1992; Tang and Lane, 2000; Ubeda et al., 1996).
Here, we find that FUS::DDIT3 expression inhibits CEBPB-mediated BAF complex targeting to adipogenic enhancers, resulting in downregulation of adipogenic genes and upregulation of tumorigenic pathways in MLPS cell lines and primary tumors. BAF complexes and their ATPase-driven chromatin remodeling activities are required for CEBPB-mediated reestablishment of adipogenic enhancers upon suppression of FUS::DDIT3 in MLPS cell lines as well as for adipogenesis in mesenchymal stem cells (MSCs). These data highlight the role for BAF complex-mediated chromatin remodeling in normal adipogenesis and demonstrate the mechanistic convergence between FUS::DDIT3-mediated sequestration of the critical adipogenic transcription factor CEBPB and BAF complex loss-of-function in the setting of MLPS.
Results
Expression of the FUS::DDIT3 fusion oncoprotein inhibits BAF complex targeting and activity over C/EBP target enhancers
To characterize the genomic localization of the FUS::DDIT3 fusion oncoprotein in MLPS, we performed chromatin immunoprecipitation followed by sequencing (ChIP-seq) using antibodies targeting DDIT3 (i.e., FUS::DDIT3), the pan mSWI/SNF complex subunit SMARCC1/BAF155, and H3K27ac, a marker of active chromatin in the MLPS-1765–92 myxoid sarcoma cell line (type VIII fusion) (Aman et al., 1992). Further, we performed Assay for Transposase-Accessible Chromatin sequencing (ATAC-seq) to define DNA accessibility (Buenrostro et al., 2015b; Shashikant and Ettensohn, 2019). The large majority (>70%) of DDIT3-only peaks (marking FUS::DDIT3) localized within 2kb of promoters, and FUS::DDIT3-BAF complex co-targeted sites exhibited strong H3K27ac signal and DNA accessibility (Figure S1B-D). Genome-wide, SMARCC1-marked BAF complexes localized primarily to distal enhancer regions, as expected given the demonstrated role for this family of complexes in the establishment and maintenance of enhancer accessibility (Mathur et al., 2017; Nakayama et al., 2017; Pan et al., 2019; Wang et al., 2017) (Figure S1D).
To determine the effects of FUS::DDIT3 expression on BAF complex chromatin targeting in MLPS, we suppressed FUS::DDIT3 in the MLPS-1765–92 cell line using shRNA-mediated knockdown (Figure 1A-B). Nuclear protein levels of FUS::DDIT3 were reduced by >90% in the fusion knockdown condition (shDDIT3) relative to the control, non-targeting shRNA condition (shSCR) (Figure 1B, S1E). Levels of the wild-type DDIT3 gene were extremely low and we were unaffected by DDIT3 knockdown (Figure S1E). We performed ChIP-seq using antibodies targeting the SMARCC1/BAF155 core subunit to map the localization of BAF complexes in the control and fusion knockdown conditions. Unexpectedly, suppression of FUS::DDIT3 resulted in an overall increase in BAF complex MACS-called peaks, predominantly at TSS-distal regions (Figure 1C, S1F). Clustering these sites revealed considerable increases in H3K27ac by ChIP-seq and DNA accessibility by ATAC-seq at the 1,980 sites that gain BAF complex occupancy upon fusion knockdown (Figure 1D-E, S1G-H), indicative of enhancer recommissioning upon suppression of FUS::DDIT3.
Figure 1. Expression of the FUS::DDIT3 fusion oncoprotein inhibits BAF complex targeting and activity over C/EBP target enhancers.
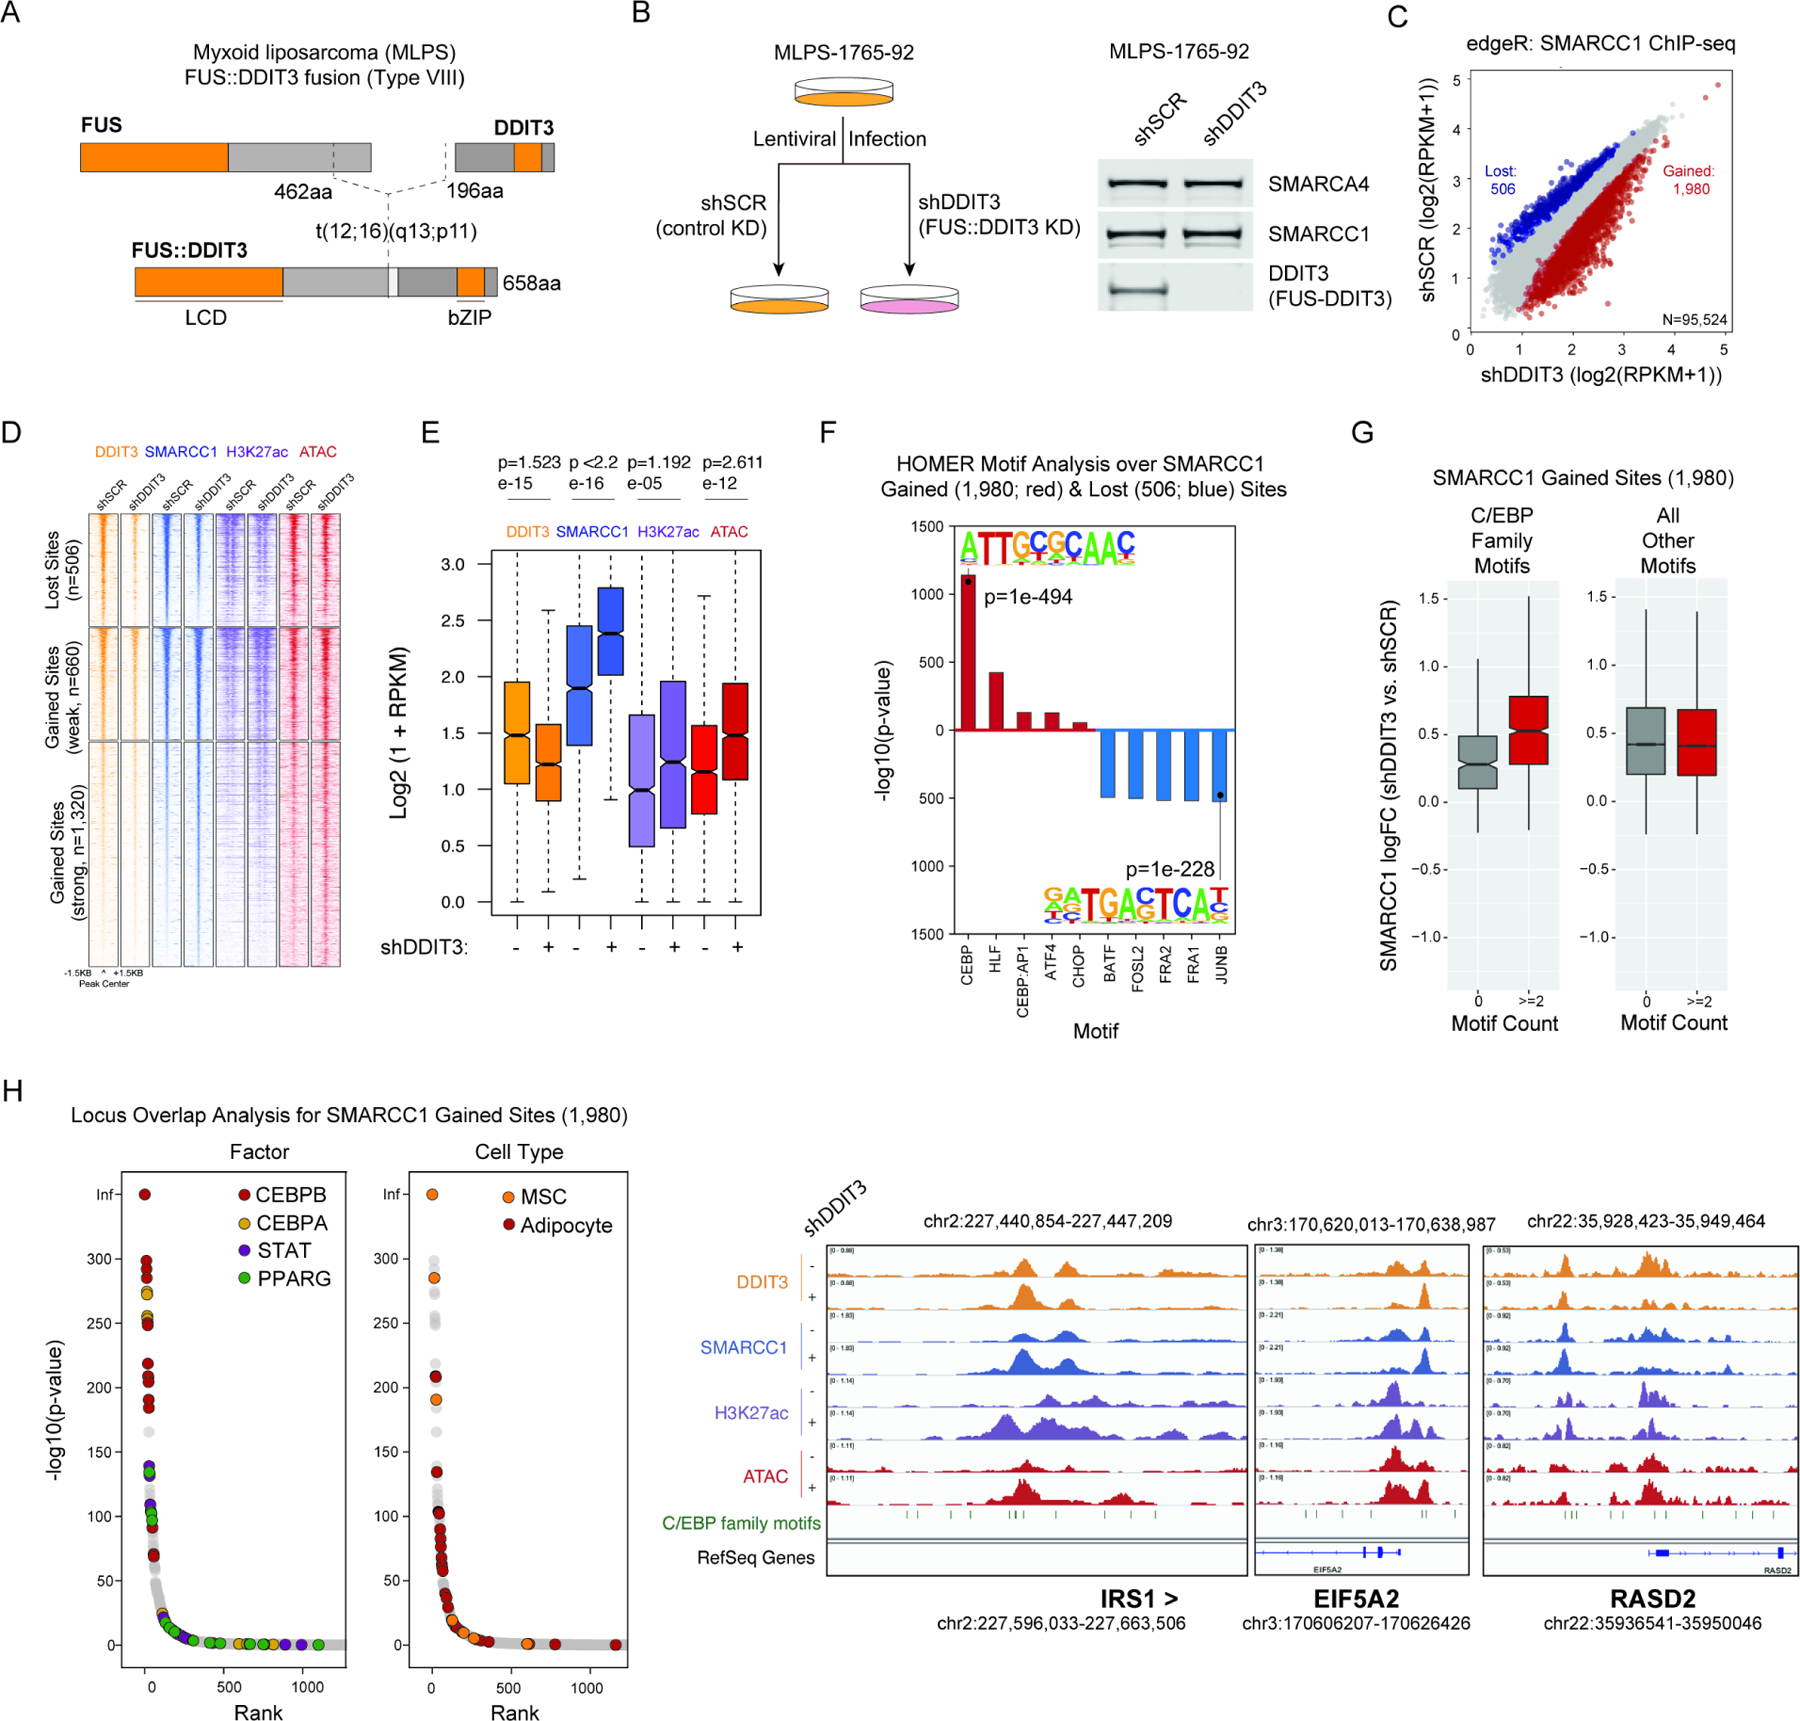
A. Schematic of the FUS::DDIT3 oncoprotein found in the MLPS-1765-92 cell line (type VIII). B. Experimental schematic of the strategy (left) and validation of FUS::DDIT3 knockdown at the protein level at day 7 post-transduction (right). shSCR, control scramble knockdown; shDDIT3, DDIT3 knockdown. C. Plot reflecting edgeR-determined differential chromatin occupancy of BAF complexes between shSCR (control) and shDDIT3 conditions. D. Heatmaps of SMARCC1, H3K27ac, and ATAC-seq peak intensities over sites that lose and gain BAF complex occupancy upon FUS::DDIT3 knockdown in MLPS-1765-92 cells. E. Box-and-whisker plots reflecting changes in DDIT3, SMARCC1, H3K27Ac, and ATAC-seq signals over n=1980 total gained sites from (D). F. HOMER motif analysis of sites that gain (red) and lose (blue) BAF complex occupancy upon fusion knockdown. G. Boxplots of BAF complex change in occupancy over genomic sites that contain C/EBP family motifs relative to those that contain all other motifs. H. Locus Overlap Analysis (LOLA) of sites that gain BAF complex occupancy upon fusion knockdown. I. Example tracks for SMARCC1, H3K27ac, and DNA accessibility in shSCR and shDDIT3 conditions, over sites enriched in C/EBP family motifs (IRS1, EIF5A2, RASD2 loci). See also Figure S1.
Intriguingly, HOMER motif analysis performed over sites exhibiting gains in BAF complex occupancy upon FUS::DDIT3 suppression revealed significant enrichment of the C/EBP family motif (p=1e-494) (Figure 1F). Further, BAF complex occupancy was increased selectively at C/EBP family sites, while it was unchanged at sites corresponding to all other TF motifs genome-wide (Figure 1G). C/EBP family members such as CEBPB, CEBPA, and CEBPD are known to play critical roles in early adipogenesis, leading to the expression of PPARG, which is required for terminal differentiation of adipocytes and maintenance of the adipocytic phenotype (Figure S1I) (Barak et al., 1999; Rosen et al., 1999; Tanaka et al., 1997; Tang and Lane, 2000; Tang et al., 2003; Wang et al., 1995). Strikingly, locus overlap analysis (LOLA) over BAF gained sites revealed strong enrichment of CEBPB and adipogenesis-related factor occupancy (i.e., CEBPA, STAT, and PPARG) across publicly-available ChIP-seq studies performed in mesenchymal stem cells (MSCs) and adipocytes (Figure 1H). Furthermore, sites with increased accessibility (via ATAC-seq) upon fusion knockdown were enriched for C/EBP family motifs (Figure S1J-K), suggesting a shift in BAF complex-mediated DNA accessibility generation at genomic regions harboring C/EBP family motifs, as exemplified at the IRS1, EIF5A2, and RASD2 loci (Figure 1I). Similar results demonstrating increases in BAF complex occupancy at CEBPB target sites following FUS::DDIT3 suppression were obtained in an independent MLPS cell line, MLPS-402-91 containing the type I FUS::DDIT3 fusion (Figure S1A, L-N). Taken together, these data highlight an unexpected increase in BAF complex occupancy, specifically at CEBPB target sites, following suppression of the FUS::DDIT3 fusion oncoprotein, implicating the FUS::DDIT3 fusion as an inhibitor of proper lineage-specific BAF complex chromatin localization in myxoid liposarcoma.
FUS::DDIT3-mediated sequestration of CEBPB inhibits BAF complex activity at CEBPB target sites and attenuates adipogenic gene activation
The DDIT3 transcription factor is known to heterodimerize with CEBPB in a dominant negative manner, preventing CEBPB binding to its cognate DNA motifs. Further, the intact DDIT3 dimerization domain, but not the DNA-binding domain, is required for the oncogenic activity of FUS::DDIT3, as dimerization mutants do not interfere with contact inhibition and adipogenesis in culture (Adelmant et al., 1998; Ron and Habener, 1992; Zinszner et al., 1994). Given this and our findings suggesting sequestration of BAF complexes away from CEBPB target sites genome-wide in the presence of FUS::DDIT3, we performed biochemical studies to characterize the interactions of FUS::DDIT3 with CEBPB and BAF complexes in the MLPS setting. We found that the FUS::DDIT3 fusion predominantly interacts with CEBPB but less strongly with the principal ATPase subunit of BAF complexes, SMARCA4/BRG1, across three MLPS cell lines (Figure S2A-B), indicative of its biochemical role of heterodimerizing with CEBPB.
Given this, we next aimed to determine whether FUS::DDIT3-mediated reduction of BAF complex occupancy and subsequent DNA accessibility over CEBPB target sites could be explained by changes in the binding of CEBPB on the genome. Notably, ChIP-seq studies revealed a striking >20-fold increase in CEBPB occupancy on chromatin following suppression of FUS::DDIT3 (Figure 2A), with the strongest gains at distal sites exhibiting increases in BAF complex targeting upon fusion knockdown (Figure 2B, S2C). Specifically, nearly 50% of sites at which BAF complexes were retargeted following fusion knockdown overlapped with sites of gained CEBPB occupancy (dually-gained sites) (Figure 2C). Furthermore, upon fusion knockdown, dually-gained sites were primarily distal, marked with increased H3K27ac and DNA accessibility, and overlapped sites known to be bound by adipogenic factors in MSCs and adipocytes (Figure 2D, S2C-D). Together, these data indicate that the FUS::DDIT3 fusion prevents CEBPB chromatin binding and CEBPB-mediated recruitment of BAF complexes, and that BAF complexes and CEBPB reciprocally reinforce one another’s binding to and activation of adipogenic enhancers upon FUS::DDIT3 suppression.
Figure 2. FUS::DDIT3-mediated sequestration of CEBPB from the genome inhibits BAF complex activity over CEBPB target sites and attenuates adipogenic gene activation.
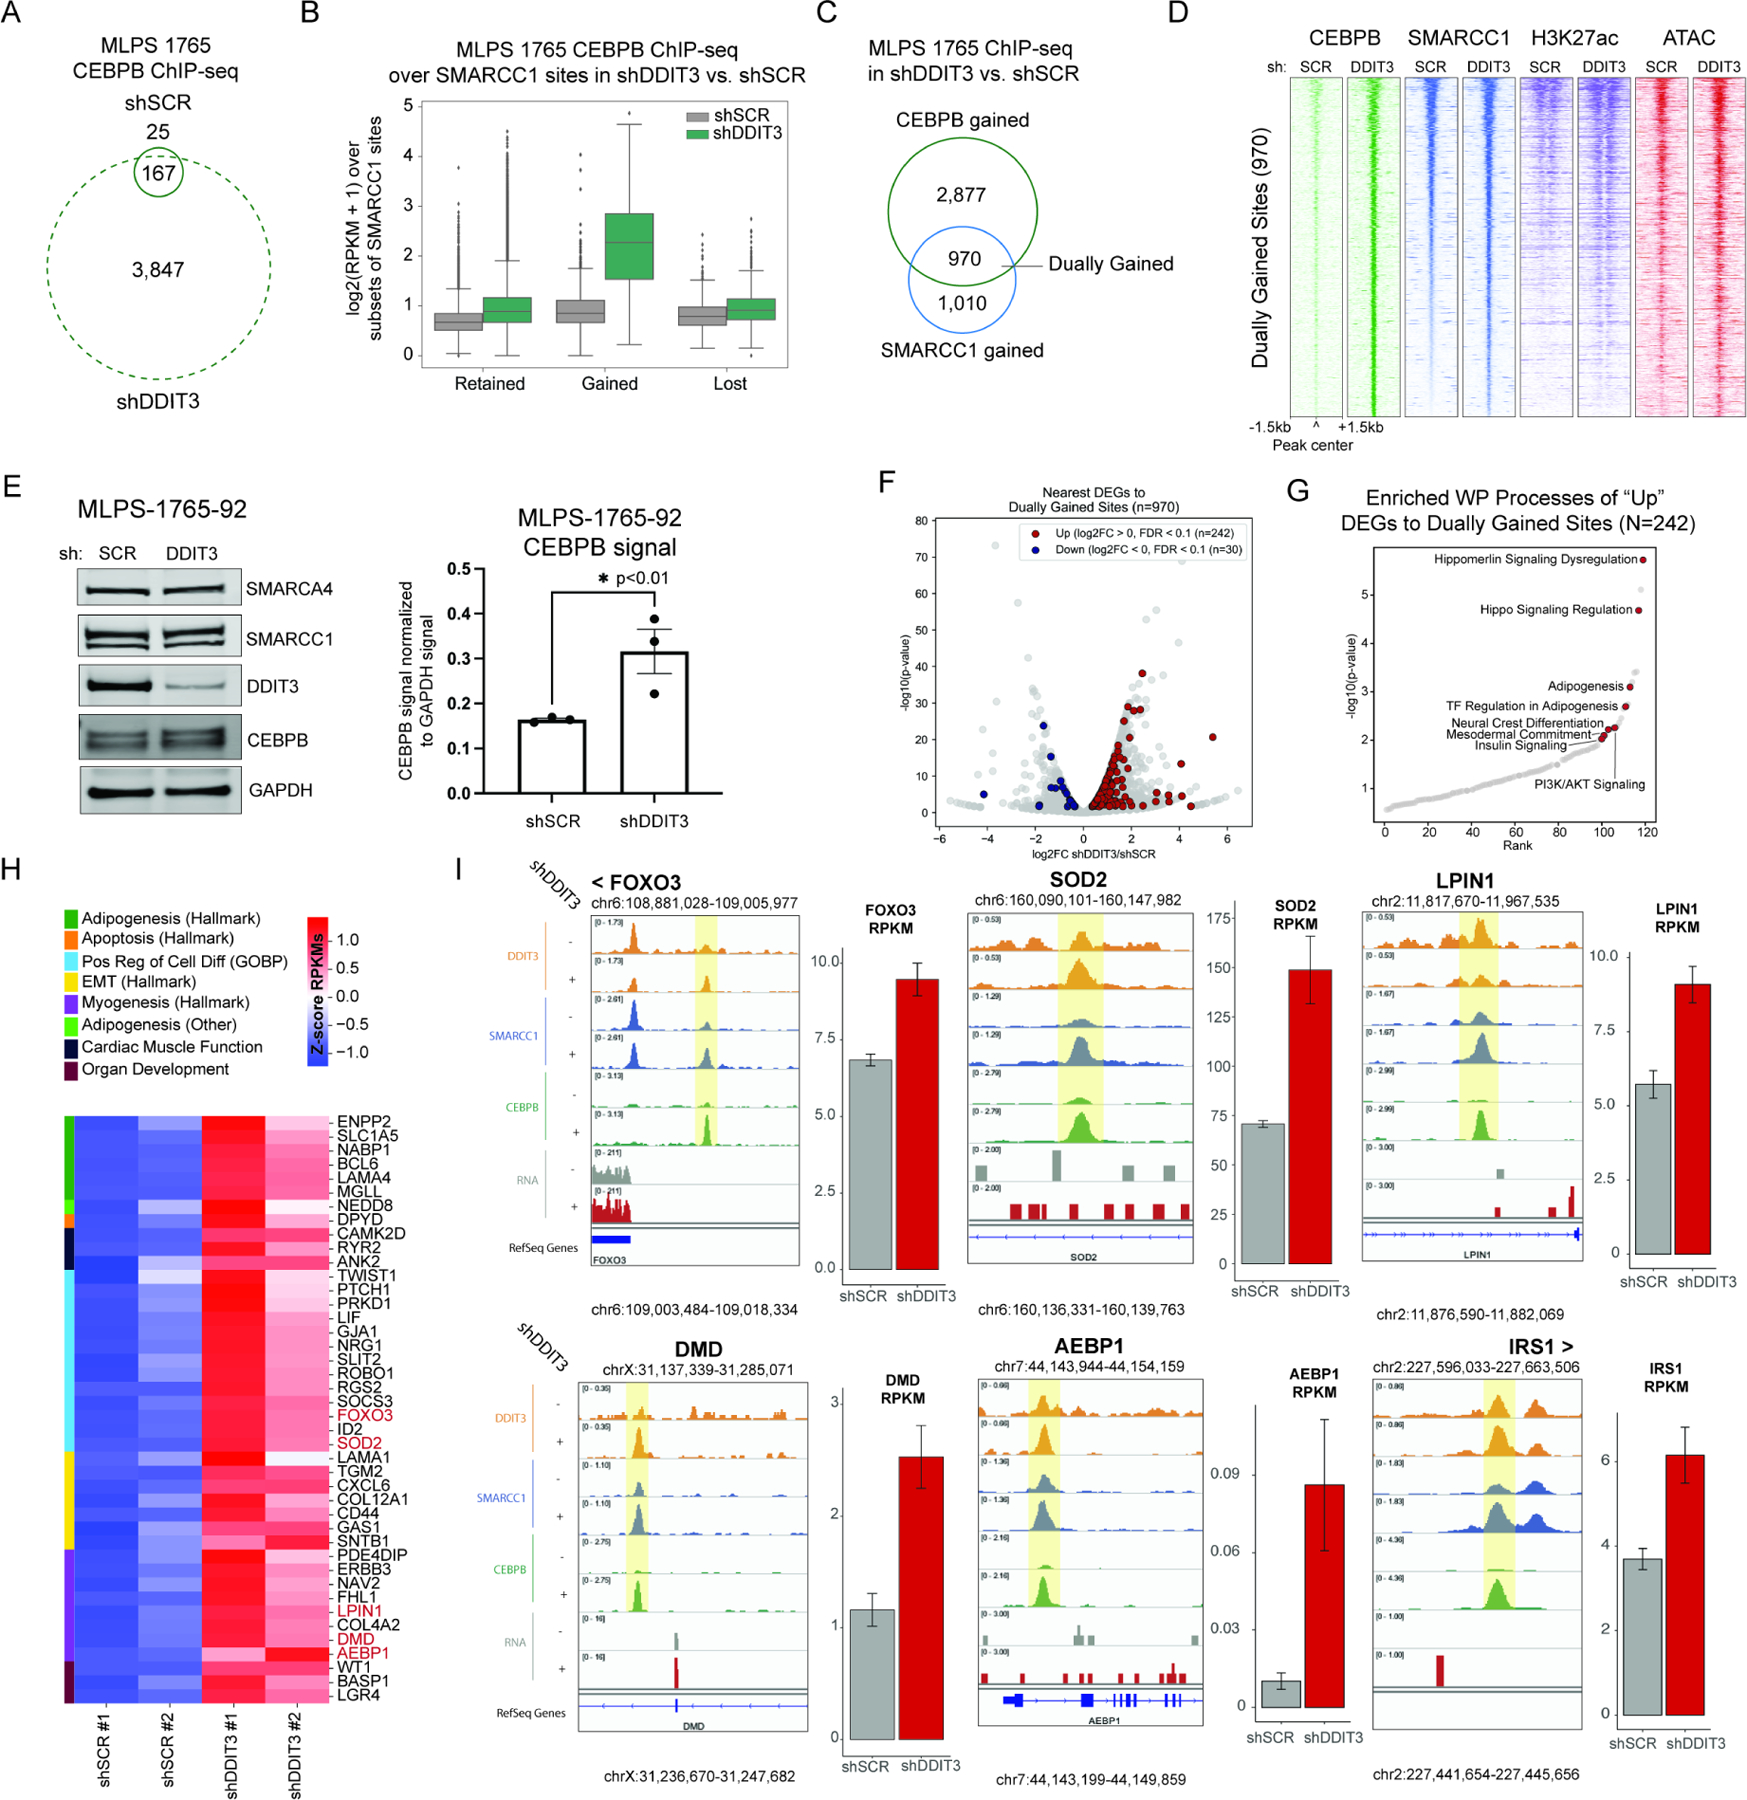
A. Venn diagram reflecting CEBPB MACS-called peaks in shSCR and shDDIT3 conditions in MLPS-1765-92. B. CEBPB occupancy at sites that retain, gain, or lose SMARCC1 occupancy in shSCR and shDDIT3 conditions C. Venn diagram reflecting overlap of gained CEBPB and SMARCC1 sites upon FUS::DDIT3 knockdown. D. Heatmap of CEBPB, SMARCC1, H3K27ac, and ATAC-seq peaks over sites that dually gain CEBPB and SMARCC1 upon FUS::DDIT3 knockdown. E. (left) Immunoblots reflecting total nuclear BAF complex subunit, DDIT3, CEBPB, and GAPDH control levels in MLS-1765-92 cells treated with either shSCR or shDDIT3. (right) Bar graph indicating GAPDH-normalized densitometry of CEBPB immunoblots (n=3 experimental replicates). F. Volcano plot of differentially expressed genes (DEGs), with those near dually-gained sites marked in red (upregulated) and blue (downregulated). G. Gene ontology analysis of upregulated genes that are near dually-gained sites across WikiPathways genesets (WP=WikiPathways). H. Z-score heatmap of genes associated with gene ontology terms related to development, differentiation, and apoptosis that are upregulated and near dually-gained sites upon knockdown. Gene names in red are represented in track examples in (I). I. Tracks and RPKM gene expression bar graphs for upregulated genes near dually-gained sites upon FUS::DDIT3 knockdown (FOXO3, SOD2, LPIN1, DMD, AEBP1, IRS1). See also Figure S2.
Accordingly, biochemical studies revealed that CEBPB biochemically interacts with BAF complexes, and further, mutagenesis experiments indicated that this interaction is mediated by the CEBPB N-terminus (Figure S2E). We also found that total nuclear protein levels of CEBPB were significantly increased in MLPS-1765-92 cells following FUS::DDIT3 suppression (Figure 2E, S2F), in support of the notion that FUS::DDIT3 drives competition between CEBPB homodimer and FUS::DDIT3-CEBPB heterodimer generation in MLPS, with FUS::DDIT3 expression attenuating the formation of CEBPB homodimers that bind to and target BAF complexes to enhancers.
We next sought to identify the impact of CEBPB re-binding, BAF complex re-targeting, and increased enhancer accessibility on the gene expression programs of MLPS cells following suppression of FUS::DDIT3. Notably, RNA-seq analyses performed in the shSCR and shDDIT3 conditions revealed substantial changes in gene expression, with the majority of genes upregulated in expression (n= 3283 genes upregulated; n=791 downregulated significantly) (Figure S2G). Further, we identified 242 significantly up-regulated genes that mapped to sites of de novo CEBPB and BAF complex co-targeting following FUS::DDIT3 suppression (Figure 2F). Importantly, gene sets corresponding to adipogenesis were strongly enriched among these upregulated targets, in agreement with the strong enrichment of CEBPB and BAF complexes over sites targeted by adipogenic factors such as CEBPB, CEBPA, PPARG, STAT, and others (Figure 2G, S2H). Notably, genes strongly upregulated upon FUS::DDIT3 fusion knockdown relative to control knockdown included a collection of genes closely associated with adipogenic processes (i.e. LAMA4, MGLL, and ENPP2), myogenesis (FHL1, COL4A2, and LPIN1) as well as those known to play roles in EMT, differentiation, and apoptosis (Chang et al., 2014; Gonzalez Porras et al., 2021; Rancoule et al., 2012; Reue, 2007) (Figure 2H). Enhancers of these upregulated genes showed increased CEBPB and BAF complex occupancy, as exemplified at the FOXO3, SOD2, LPIN1, DMD, AEBP1, and IRS1 loci (Figure 2I). Fusion suppression resulted in similar changes in CEBPB targeting the MLPS-402-91 cell line (Figure S2I-K). Finally, in line with these findings, overexpression of CEBPB in MLPS cell lines resulted in significant attenuation of cell proliferation in culture (Figure S2L-M). Collectively, these results underscore the role of the FUS::DDIT3 fusion in precluding CEBPB-DNA binding and CEBPB-mediated BAF complex targeting on the genome, such that upon fusion suppression, the CEBPB-BAF complex interaction, target locus accessibility, and target gene expression are all restored.
Aberrant BAF complex and CEBPB chromatin binding underlie the MLPS gene expression signature
We next aimed to determine whether BAF-CEBPB-mediated gene regulatory effects in MLPS cell lines were consistent with gene expression profiles observed in primary MLPS tumors. To this end, we performed RNA-sequencing (RNA-seq) on n=10 MLPS tumor samples pathologically confirmed to contain >95% tumor cells (Figure S3A, Table S1). Compared to the transcriptional profile of normal adipose tissue (n=46, GTEx), primary MLPS tumors demonstrated markedly reduced expression of genes involved in adipogenesis and adipocyte biology (i.e., glycerolipid/glycerophospholipid synthesis, insulin signaling, and fatty acid/omega oxidation) and elevated expression of genes involved in cancer-promoting pathways (i.e., G2/M checkpoint, cell cycle, and E2F targets) (Figure 3A-B). These data underscore the defects in MLPS adipocytic differentiation gene expression programs relative to normal adipose tissue, consistent with our findings in MLPS cell lines, in which BAF complex targeting, DNA accessibility, activation of adipogenic enhancers, and subsequent target gene expression are all attenuated in the presence of the FUS::DDIT3 fusion protein.
Figure 3. Aberrant chromatin binding of BAF complexes and the CEBPB transcription factor underlie the gene expression signature of primary MLPS tumors.
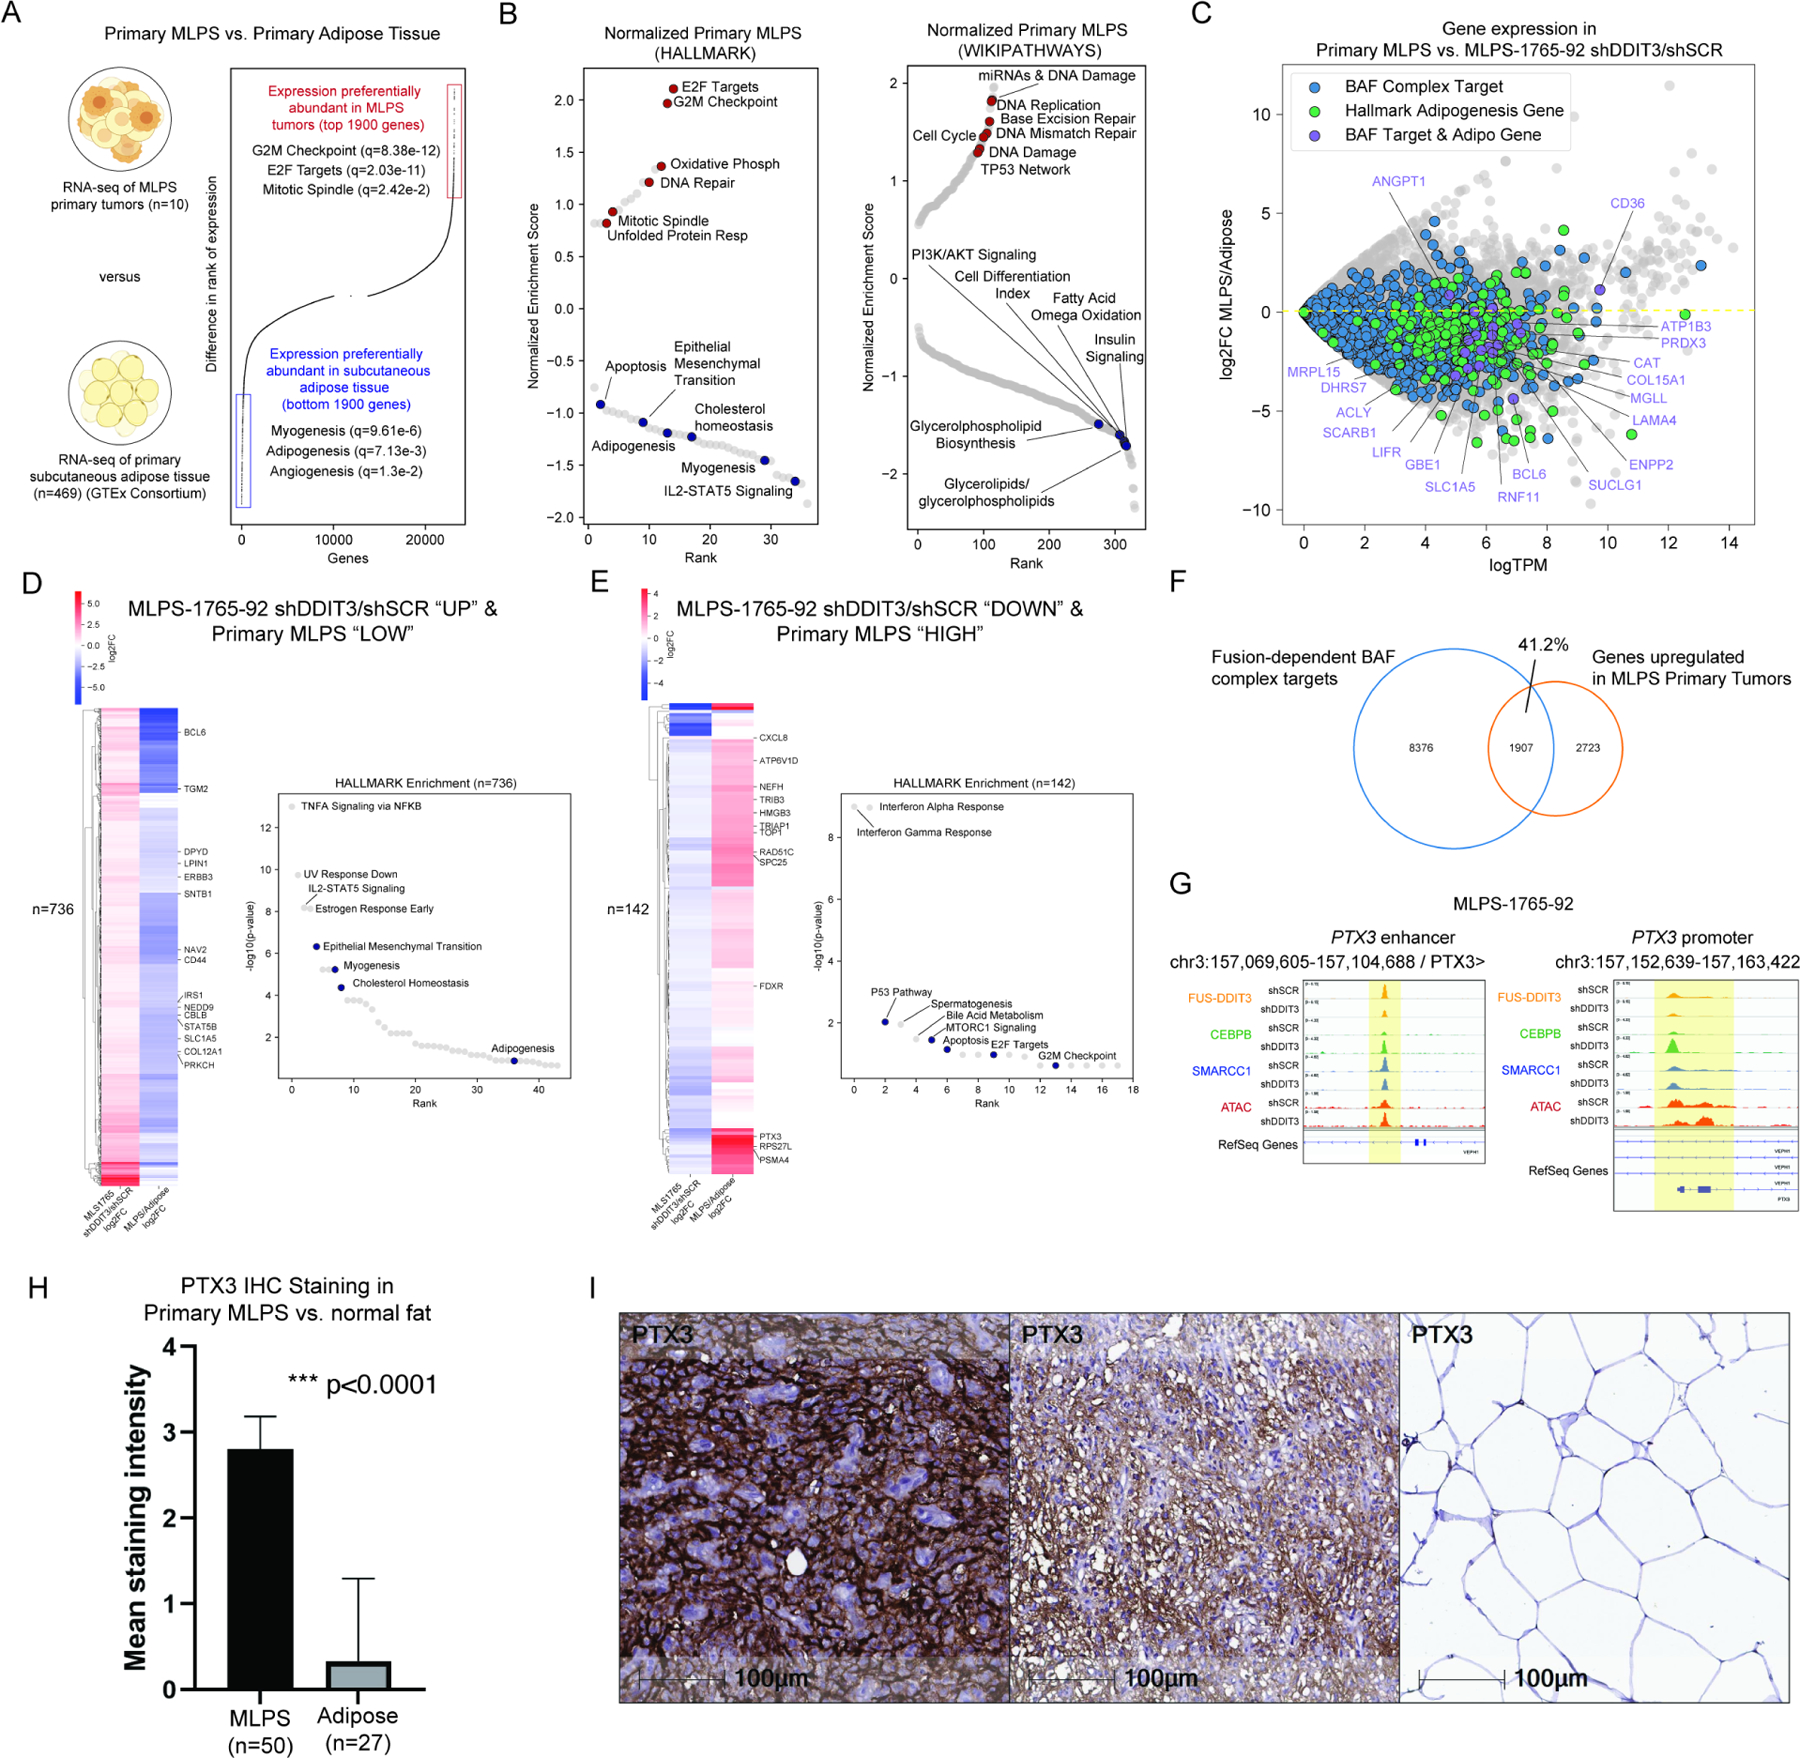
A. Ranking of gene expression and HALLMARK pathway enrichment of top genes in primary MLPS tumors (from patients) versus primary adipose tissue (from GTEx). B. Gene ontology terms associated with upregulated and downregulated genes in primary MLPS tumors normalized to primary adipose tissue. C. SMARCC1/BAF155 (BAF complex) targets upon FUS::DDIT3 knockdown in MLPS 1765 shDDIT3/shSCR, HALLMARK adipogenesis genes, and BAF complex targets & HALLMARK adipogenesis genes are downregulated in MLPS tumors compared to primary adipose tissue. D. Genes upregulated upon FUS::DDIT3 knockdown in MLPS-1765-92 (log2FC > 0, FDR< 0.1) and relatively lowly expressed in primary MLPS (bottom 4630 genes, see Fig 3A) compared to primary adipose tissue are associated with adipogenic gene sets. E. Genes downregulated upon FUS::DDIT3 knockdown in MLPS-1765-92 (log2FC < 0, FDR < 0.1) and relatively highly expressed in primary MLPS (top 4630 genes, see Fig 3A) compared to primary adipose tissue are associated with tumorigenic gene sets. F. Venn diagram depicting overlap between primary MLPS upregulated genes (relative to normal adipose, top 4630 genes from (A)) and sites of FUS::DDIT3-mediated BAF complex target sites in MLS-1765 cells. G. Example tracks at the PTX3 locus demonstrating co-localization of FUS::DDIT3, CEBPB, and SMARCC1 in the MLPS-1765-92 cell line. H. Average staining intensity of PTX3 on myxoid liposarcoma (MLPS) tumor (mean = 2.8, S.D. = 0.4; n=50) and normal adipose tissue (mean = 0.3, S.D. = 0.9; n=27) samples. I. Immunohistochemistry for PTX3 on a representative section of myxoid liposarcoma showing high (left), moderate (middle) cytoplasmic and membranous staining, and (right) normal adipose tissue negative for PTX3. Magnification: 20x; scale bar= 100 microns. Representative images of IHC staining of PTX3 in MLPS tumors (left, middle) and normal fat (right). See also Figure S3, Table S1.
Importantly, we identified a number of adipogenic genes that exhibited substantially reduced expression in primary MLPS tumors relative to normal adipose tissue and that mapped to gained BAF complex target sites in fusion-suppressed MLPS-1765-92 cells (Figure 3C). Furthermore, we identified a set of genes lowly expressed in primary MLPS tumors and upregulated upon fusion knockdown in MLPS-1765-92 cells, which were enriched in adipogenic gene sets, and conversely, we identified a set of genes highly expressed in primary MLPS tumors and downregulated upon fusion knockdown in MLPS-1765-92 cells which were enriched in cancer-promoting gene sets (Figure 3D-E, S3B). Importantly, we identified overlap between lowly-expressed genes in MLPS primary tumors and genes that were significantly upregulated upon suppression of the FUS::DDIT3 fusion in the MLPS-1765-92 and MLPS-402-91 cell lines (Figure S3C-D). As examples, genes playing central roles in lipid, cholesterol, and steroid biosynthesis such as IRS1, LPIN1, and STAT5B, were among the sets of genes that exhibited reduced expression in MLPS primary tumors and/or were upregulated upon FUS::DDIT3 knockdown in MLPS cell lines (Figure 3D, S3C). Reciprocally, genes exhibiting high expression in MLPS primary tumors and/or those that were downregulated upon fusion knockdown were enriched for cell cycle and growth pathway genes, such as CXCL8, TRIB3, and PTX3 (Figure 3E, S3D). Indeed, we found that >40% of genes upregulated in MLPS primary tumors mapped to chromatin loci marked by both FUS::DDIT3 and CEBPB, FUS::DDIT3-CEBPB heterodimers, along with BAF complexes, suggesting the contributions of heterodimer-BAF sites to the activation of specific genes hallmark to MLPS (Figure 3F). This is exemplified at the PTX3 locus, at which we observed and increased CEBPB localization as well as reduced DDIT3 and promoter accessibility upon fusion suppression (Figure 3G). Given this observation, we performed PTX3 immunohistochemical (IHC) staining across a tissue microarray (TMA) containing n=50 MLPS tumors and n=27 normal adipose samples. Indeed, we found that the expression of PTX3, a gene previously suggested as a potential marker of liposarcomas (Willeke et al., 2006), was statistically significantly higher in MLPS relative to normal fat (Figure 3H-I, S3E). These data implicate a role for a specific set of sites at which FUS::DDIT3-CEBPB heterodimers, along with BAF complexes bind to maintain or augment MLPS-specific gene expression. Further, these studies integrating chromatin binding, DNA accessibility, and gene expression results in MLPS cell lines (with and without fusion suppression) and primary tumors underscore that the central feature of MLPS is the failure to properly enter and complete adipogenesis due to loss of CEBPB-mediated BAF complex targeting to adipogenic enhancers.
BAF complex ATPase activity at CEBPB target loci is required for normal adipogenesis
Given that a central feature in MLPS is the failure to properly enter and complete adipogenesis, we next sought to determine the role of BAF complex targeting and chromatin remodeling activities in normal adipogenesis. While chromatin regulation has been implicated in adipocytic differentiation in specific contexts (Caramel et al., 2008b; Pedersen et al., 2001a; Salma et al., 2004), the contributions of BAF complexes to these processes have not been examined comprehensively to date.
To this end, we subjected an MSC model cell line (ASC52telo hTERT-immortalized adipose derived mesenchymal stem cells (hTERT-MSCs)) to adipogenic differentiation using adipogenic stimulation media (or base media as control) (Figure 4A, S4A). We then profiled the genome-wide chromatin occupancy of BAF complexes in the presence or absence of treatment with adipogenic stimulation medium for 24 hours. Excitingly, we observed a striking overall increase in genome-wide BAF complex occupancy upon adipogenic stimulation, consistent with active, lineage-specific differentiation (Figure 4B). These gained sites were largely TSS-distal (Figure S4B) and strongly enriched DNA sequences corresponding to the C/EBP family of transcription factors (CEBPB, CEBPBA, CEBPBD, and CEBPE) (Figure 4C, S4C-D). Occupancy of CEBPB and the H3K27ac mark, as determined by CUT&RUN-sequencing, as well as DNA accessibility, were substantially gained over adipogenesis-induced de novo BAF complex target sites (Figure 4D, S4B). Corresponding RNA-seq demonstrated upregulation of gene sets involved in cellular response to lipid, fat cell differentiation, and regulation of lipid metabolic process upon adipogenic stimulation (Figure S4E).
Figure 4. BAF complex activity at CEBPB target loci is required for normal adipogenesis.
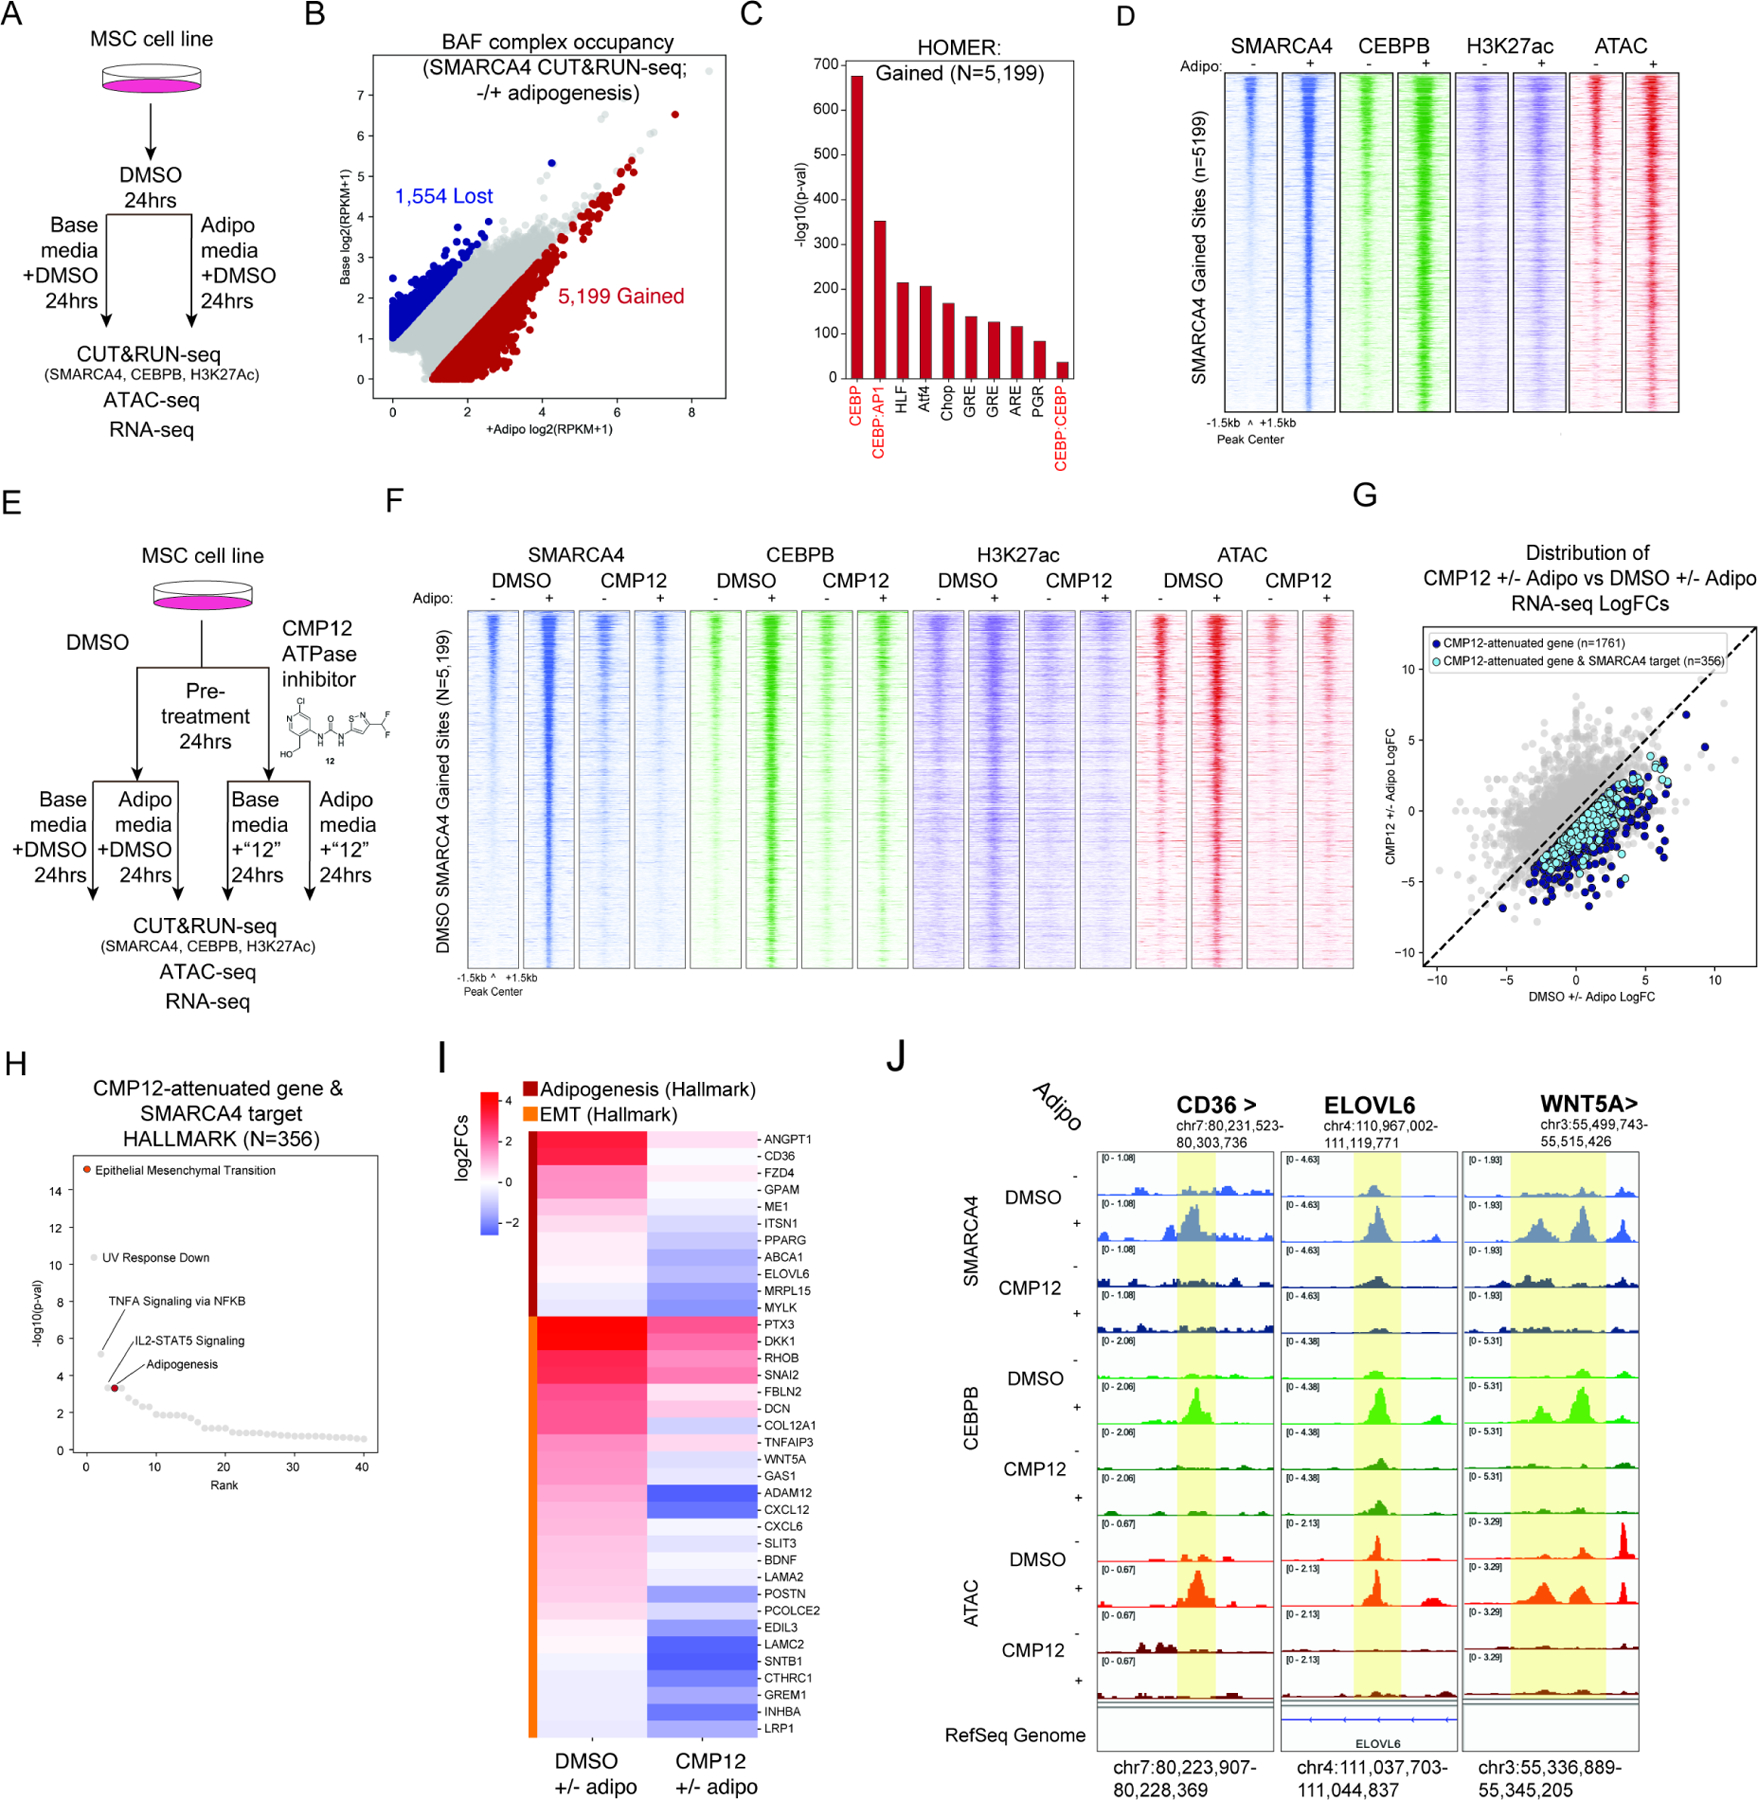
A. Experimental schematic to profile BAF complex localization and other chromatin changes in hTERT-MSCs upon 24 hours adipogenesis. B. edgeR analysis of differential occupancy of BAF complexes (SMARCA4) on the genome upon 24 hours adipogenesis. C. HOMER motif analysis of sites that gain BAF complex (SMARCA4) occupancy upon 24 hours adipogenesis. D. Heatmap of SMARCA4, CEBPB, H3K27ac, and ATAC-seq peaks over sites that gain BAF complex (SMARCA4) occupancy upon 24 hours adipogenesis (“SMARCA4 targets”). E. Experimental schematic to define the specific role for BAF complexes in adipogenesis using small molecule-mediated inhibition of BAF complex ATPase activity with compound 12 (CMP12). F. Heatmap of SMARCA4, CEBPB, H3K27ac, and ATAC-seq peaks upon DMSO or CMP12 treatment in base or adipogenic media for 24 hours over SMARCA4 gained sites in the DMSO adipogenesis condition. G. Comparison of changes in RNA in the CMP12 and DMSO treatment conditions upon adipogenesis. Dark blue circles are genes that are not as up-regulated or are more down-regulated upon adipogenesis with CMP12 treatment compared to DMSO (CMP12-attenuated gene). Light blue circles are a subset of CMP12-attenuated genes that are also nearest to sites that gain BAF complexes (SMARCA4) upon adipogenesis in the DMSO condition (CMP12-attenuated gene and SMARCA4 target). H. Gene ontology analysis of CMP12-attenuated gene and SMARCA4 targets. I. Heatmap of logFC in expression of genes in DMSO and CMP12 conditions upon adipogenesis. J. Track examples at the CD36, ELOVL6 and WNT5A loci. See also Figure S4.
To determine whether BAF complex ATPase activity is required for the adipogenic process, we next pretreated MSCs with either DMSO or compound 12 (CMP12), a SMARCA4/SMARCA2-specific inhibitor of mSWI/SNF complex-specific ATPase activity (Papillon et al., 2018) for 24 hours, followed by either base or adipogenic media for an additional 24 hours (Figure 4E). Notably, treatment with CMP12 markedly decreased the ability of BAF complexes and CEBPB to target to new sites upon adipogenesis (Figure 4F, S4F-H). Further, CMP12-mediated ATPase inhibition nearly completely attenuated the placement of H3K27ac over enhancers as well as the generation of de novo DNA accessibility during adipogenesis (Figure 4F, S4I).
Importantly, small molecule-mediated BAF complex inhibition resulted in significant attenuation of gene activation for genes near sites exhibiting decreased BAF complex targeting and accessibility upon CMP12 treatment (Figure 4G, S4J). CMP12-attenuated BAF complex target genes corresponded to relevant gene ontology pathways (such as EMT and adipogenesis) as well as several targets of both BAF complexes and CEBPB such as CD36, ELOVL6, and WNT5A, absent changes in the mRNA expression of CEBPB, indicative of its BAF-dependent protein-level chromatin binding defect as most critical for reduced adipogenic differentiation (Figure 4H-J, S4K). These data demonstrate the critical role for BAF complexes in generating accessibility over target sites of the critical early adipogenic factor, CEBPB, which is required for downstream adipogenic differentiation. Further, these studies uncover the BAF targeting and gene regulatory similarities between MLPS (cell lines and primary tumors) and MSCs treated with BAF complex ATPase inhibition, further underscoring the loss-of-function impact of FUS::DDIT3 on BAF complexes in MLPS (Figures 1–3). Indeed, these experiments defining the role of BAF complex inhibition indicate that the failure to appropriately differentiate, via FUS::DDIT3-mediated sequestration of CEBPB from the genome and consequent loss of BAF complex targeting to adipogenic enhancers, is the principal feature governing the gene expression signatures in these tumors.
FUS::DDIT3-mediated attenuation of BAF complex targeting and activity over adipogenic target sites phenocopies a BAF complex loss-of-function oncogenic mechanism
Our findings strongly suggest that FUS::DDIT3-mediated sequestration of BAF complexes away from CEBPB target sites render MLPS a ‘BAF complex loss-of-function’-like cancer. Indeed, loss of BAF complex targeting to lineage-specific distal enhancers is a common feature observed in SMARCB1-deficient, SMARCA4/2-deficient and other ‘BAF loss-of-function’ cancer types known to be driven by BAF subunit deletions (Mathur et al., 2017; Nakayama et al., 2017; Pan et al., 2019; Wang et al., 2017). Further, such tumors often do not display reliance on residual canonical BAF complex components for proliferative maintenance (Michel et al., 2018). In line with this, proliferation of MLPS 1765 cells treated with shRNA-mediated knockdown of the SMARCA4/BRG1 ATPase was unchanged relative to cells treated with a control shRNA (p=0.664), while shDDIT3 resulted in significant attenuation of proliferation (p=3.39e-5) (Figure S5A-B). These data suggest that BAF complexes are not required for the proliferative maintenance of MLPS, in stark contrast to tumor types in which a fusion oncoprotein mistargets BAF complexes to pro-oncogenic sites in a gain-of-function manner (such as EWS::FLI1 in Ewing sarcoma (Boulay et al., 2017)), further supporting the idea that loss of BAF complex targeting due to CEBPB sequestration is the dominant mechanism in MLPS.
To determine the impact of BAF complex perturbation or loss in FUS::DDIT3-driven MLPS, we generated MLPS-1765-92 SMARCB1-KO cells using CRISPR-Cas9-mediated editing (Figure S5C) and performed genomic studies with and without FUS::DDIT3 knockdown (Figure 5A-B, S5D). In the setting of SMARCB1-KO without fusion knockdown (shSCR control), FUS::DDIT3 genome-wide occupancy was decreased, particularly at distal enhancer sites, and this was paired with increased total numbers of CEBPB peaks, largely restricted to promoter sites (relative to bulk WT cells treated with shSCR control knockdown) (Figure 5C-F). Furthermore, upon FUS::DDIT3 knockdown in SMARCB1-KO cells, BAF complex targeting and CEBPB binding to CEBPB target sites, as well as activation of these distal enhancers, were nearly completely attenuated. These data underscore that the critical function of BAF complexes over CEBPB target sites during normal adipogenesis is defective in MLPS (Figure 5F-G, S5D-F), as can be seen at the LPIN1 and FHL1 loci, at which gain of CEBPB binding upon fusion knockdown is attenuated in the setting of SMARCB1-KO (Figure 5E).
Figure 5. FUS::DDIT3-mediated attenuation of BAF complex targeting and activity over adipogenic target sites phenocopies a BAF complex loss-of-function oncogenic mechanism.
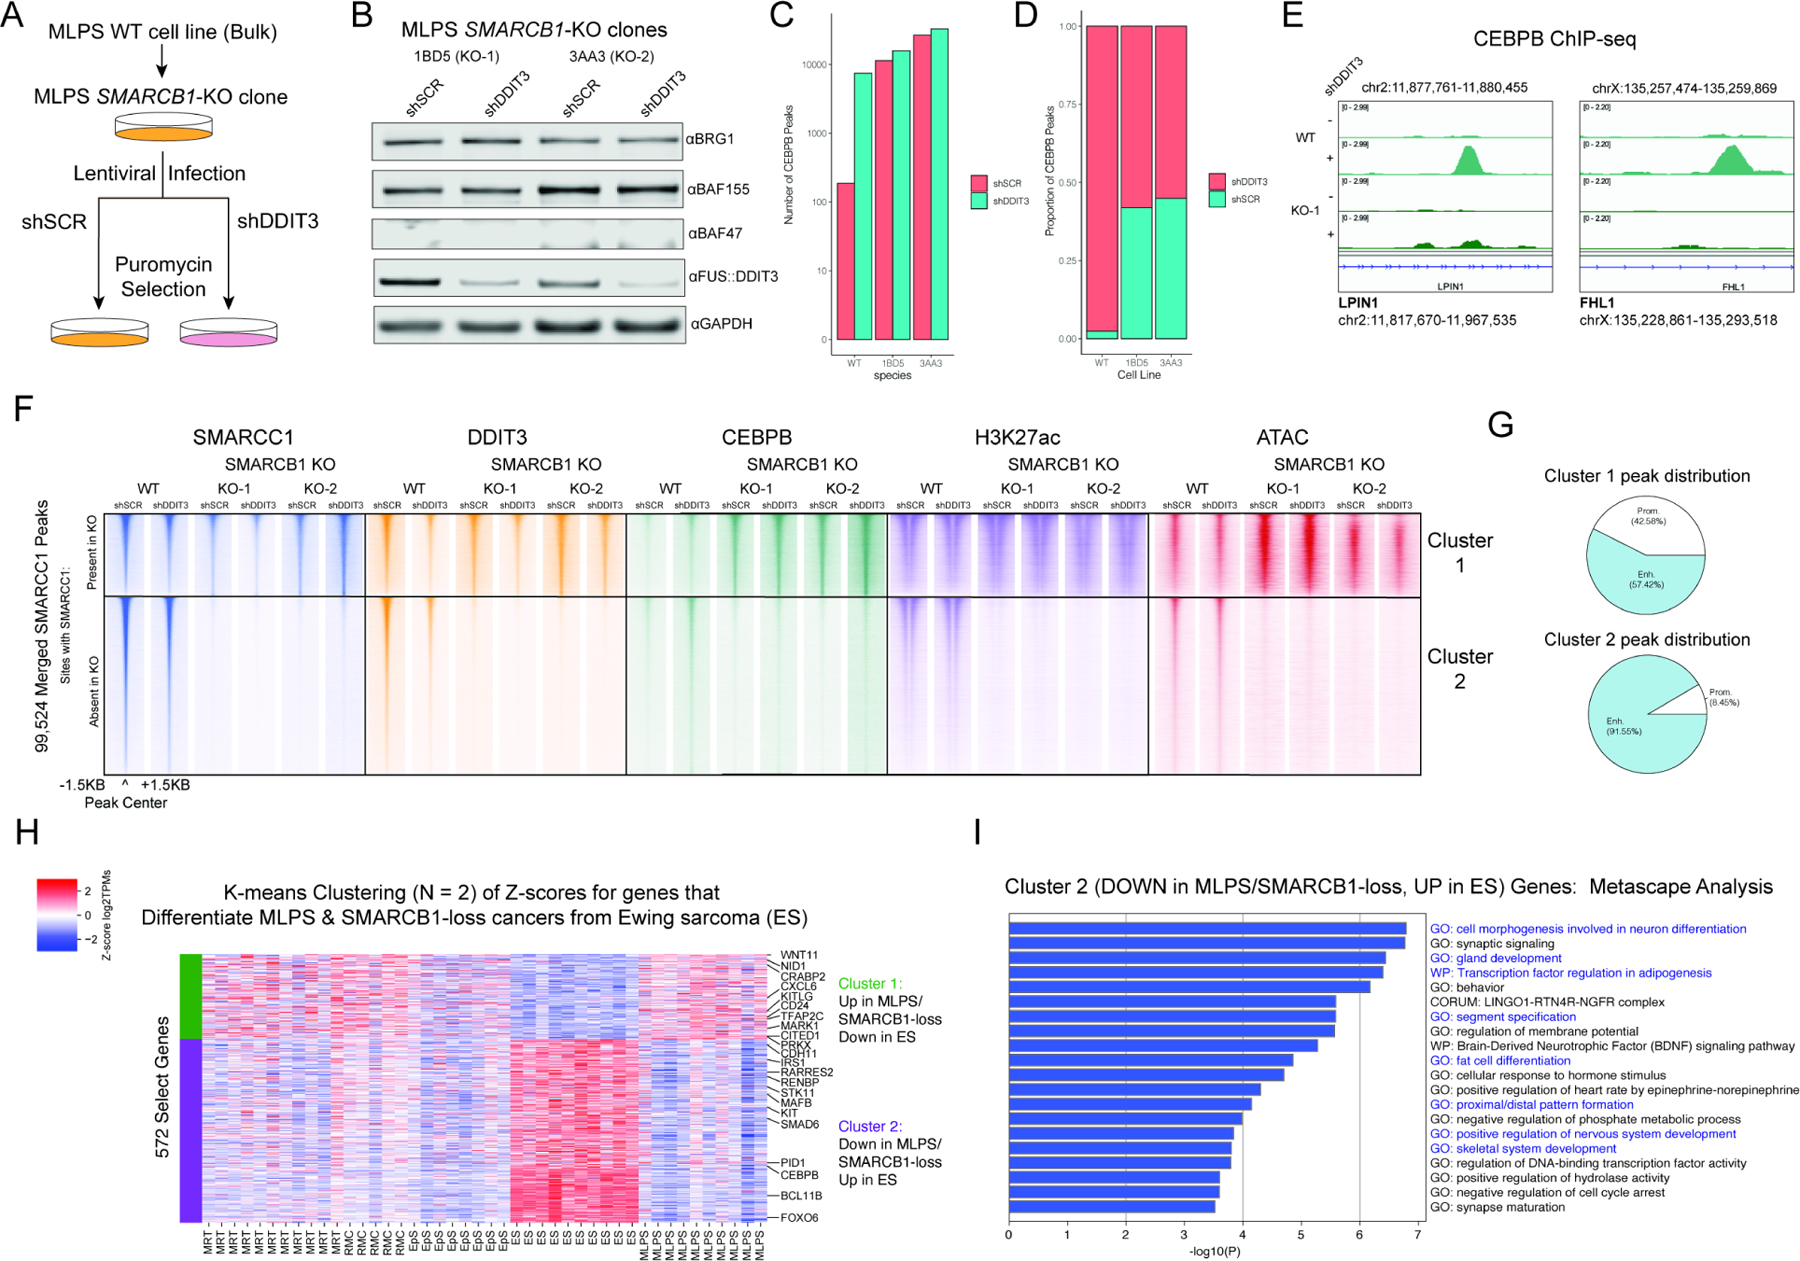
A. Experimental strategy to determine the effects of SMARCB1-KO on the MLPS line in oncogenesis (shSCR condition) and rescue from oncogenesis (shDDIT3 condition). B. FUS::DDIT3 experiments performed in in 2 SMARCB1-KO clones (1BD5 or KO-1 and 3AA3 or KO-2) with immunoblot. C. CEBPB MACS-called peaks in WT and SMARCB1 KO clones. D. Distribution of total CEBPB peaks across shSCR and shDDIT3 conditions. E. Track examples demonstrating attenuated gain of CEBPB upon fusion knockdown in SMARCB1 KO-1 cell clone.F. Heatmaps demonstrating SMARCC1, FUS::DDIT3, CEBPB, H3K27ac, and accessibility in the bulk WT MLPS-1765-92 line compared to SMARCB1-KO clones of the MLPS-1765-92 cell line. G. Distribution of cluster 1 and cluster 2 sites from (F). H. K-means clustering heatmap of primary MLPS, MRT, RMC, and EpS tumors (”loss of function”) against primary ES tumors (”gain of function”), with selected genes labeled. I. Metascape analysis of cluster 2 genes, with developmental and differentiation pathways highlighted in blue. See also Figure S5, Table S1.
Intriguingly, while FUS::DDIT3 is the predominant fusion in MLPS, other sarcomas can be driven by either FET fusion proteins or SMARCB1 loss in a mutually exclusive manner (Agaimy, 2019), strongly suggesting convergent gene regulatory mechanisms. To evaluate this, we performed comparative analyses of RNA-seq profiles from SMARCB1-deficient (‘BAF loss-of- function’) tumor types, including malignant rhabdoid tumor (MRT), renal medullary carcinoma (RMC), and epithelial sarcoma (EpS), as well as those of Ewing sarcoma (ES; driven by EWS::FLI1 fusion) and MLPS (driven by FUS::DDIT3). Using K-means clustering, we identified a cluster of genes for which expression was uniformly reduced in BAF loss-of-function settings MLPS, MRT, RMC, and EpS, but not in the BAF gain-of- function ES setting (Figure 5H). Notably, these included genes corresponding to both general BAF complex functions over enhancers, such as regulation of DNA binding transcription factor activity and pro-proliferative pathways (negative regulation of cell cycle arrest), as well as lineage-specifying functions of BAF complexes over enhancers, such as differentiation and developmental processes (Figure 5I, S5G), further underscoring the BAF complex loss-of-function profile hallmark to FUS::DDIT3-driven sarcomas.
Discussion
Here, our studies reveal an unexpected BAF complex loss-of-function phenotype conferred by a fusion oncoprotein. These data demonstrate that unlike fusion proteins that direct the targeting of BAF complexes to loci that support oncogenic gene expression and proliferation (i.e. EWS::FLI1 in Ewing sarcoma, which contain highly similar FET N-terminal members), fusion proteins containing CEBPB family members (i.e. DDIT3) generate a loss-of-function BAF complex mechanism with chromatin and gene regulatory signatures similar to those tumors driven by BAF complex subunit deletions (i.e. SMARCB1 loss). We find that expression of FUS::DDIT3 prevents BAF complex binding specifically to C/EBP family target motif-containing enhancer elements via near-complete inhibition of CEBPB genomic binding in MLPS, resulting in decreased chromatin activation (i.e., reduced decoration with H3K27ac and accessibility) and decreased adipogenic gene expression in this cancer. These data suggest that the C-terminal partners of FET fusions can direct either gain- or loss-of-function mechanisms, with ETS factors (such as FLI1, ERG) potentiating gained targeting of BAF complexes over which gene activation results, while C/EBP dimeric factors such as DDIT3 heterodimerizing in a dominant negative manner, depleting abundance of TFs (such as CEBPB) on the genome that are critical for proper lineage differentiation.
We also show that while BAF complexes are at least partly required for FUS::DDIT3 localization on the genome, they are not required for proliferative maintenance of MLPS. We did, however, identify selected loci at which both DDIT3 and CEBPB together (presumably, heterodimers) and BAF complexes localize to accessible sites corresponding to specific genes of the MLPS gene expression signature, such as PTX3 (Figure 3). Using SMARCB1-KO clones that we generated from an MLPS cell line, we found that BAF complexes are critical for robust genomic re-binding of CEBPB and activation of CEBPB-targeted sites upon FUS::DDIT3 suppression.
Finally, two entirely separate, corollary lines of evidence support our findings that expression of the FUS::DDIT3 fusion protein generates a BAF complex loss-of-function phenotype. First, other sarcoma types such as myoepithelial carcinoma, extraskeletal myxoid chondrosarcoma, and primary pulmonary myxoid sarcoma are driven either by recurrent FET-non-ETS fusion proteins (e.g. EWSR1-PBX1, EWSR1-NR4A3, and EWSR1-CREB1, among others) or by SMARCB1 (BAF47) loss in a mutually exclusive manner (Agaimy, 2019; Schaefer and Hornick, 2021). Second, CEPBE mutations and mutations in the SMARCD2 BAF complex subunit result in neutrophil-specific granule deficiency (SGD) phenotypes, also in a mutually exclusive manner (Priam et al., 2017). These examples demonstrate that BAF complexes and transcription factors in the C/EBP family work together to establish appropriate gene expression programming and that perturbing either side of this collaboration can lead to deleterious phenotypes, such as cancer or immunodeficiency syndromes with hallmark differentiation inhibition signatures. Our work in the context of MLPS has uncovered an unexpected category of BAF complex perturbation in cancer, in which the expression of a cancer-specific fusion oncoprotein results in the inhibition of BAF complex chromatin remodeling activities, mirroring BAF complex loss-of-function mutations found in over 20% of cancers and expanding the increasingly broad collection of human tumors in which this major chromatin remodeler is implicated.
Limitations of the Study
While we demonstrate that expression of the FUS::DDIT3 fusion protein results in a BAF complex loss-of-function phenotype in MLPS, blocking normal adipogenesis, future studies will be required to define the precise biochemical and 3D structural mechanism by which this occurs. Specifically, at present, we have a limited understanding regarding the biophysical interaction, dynamics and order of events, and the subunit-level requirements for CEBPB binding to BAF complexes. Further, the differences between DDIT3 and CEBPB binding interactions with BAF complexes will similarly require detailed biochemical and structural approaches. In addition, as we observed attenuation in proliferation of MLPS cell lines in culture following overexpression of CEBPB, detailed genomic profiling of the impact of CEBPB overexpression at a range of doses (expression levels) and time points will further illuminate the mechanisms of CEBPB-BAF complex interplay with respect to chromatin accessibility and gene expression.
Star Methods
RESOURCE AVAILABILITY
Lead Contact
Further information and requests for resources and reagents should be directed to and will be fulfilled by the lead contact, Cigall Kadoch (Cigall_kadoch@dfci.harvard.edu).
Materials Availability
This study did not generate unique new reagents.
Data and Code Availability
Genomics data (ChIP-seq, Cut&Run, ATAC-seq, and RNA-seq) have been deposited at GEO under accession number GSE179720 and are publicly available as of the date of publication. Accession numbers are listed in the key resources table. Original western blot images have been deposited at Mendeley and are publicly available as of the date of publication. The DOIs are listed in the key resources table.
No original code was generated for this study.
Any additional information required to reanalyze the data reported in this paper is available from the lead contact upon request.
KEY RESOURCES TABLE
| REAGENT or RESOURCE | SOURCE | IDENTIFIER |
|---|---|---|
| Antibodies | ||
| Mouse Anti-SMARCA4 (BRG1) (G-7) (IB, IHC) | Santa Cruz | Cat# sc-17796 |
| Rabbit Anti-SMARCA4 (BRG1) (D1Q7F) (IP, IHC) | Cell Signaling Technology | Cat# 49360 |
| Rabbit Anti-SMARCA4 (BRG1) (EPNCIR111A) (C&R) | Abcam | Cat# ab110641 |
| Rabbit Anti-SMARCC1 (BAF155) (D7F8S) (IB, ChIP) | Cell Signaling Technology | Cat# 11956 |
| Mouse Anti-INI1 (BAF47) (A-5) (IB) | Santa Cruz | Cat# sc-166165 |
| Rabbit Anti-H3K27ac (ChIP) | Abcam | Cat# ab4729 |
| Rabbit Anti-IgG (IP) | Cell Signaling Technology | Cat# 2729 |
| Mouse Anti-CEBPB (H-7) (IB, IHC) | Santa Cruz | Cat# sc-7962 |
| Rabbit Anti-CEBPB (IP, ChIP, C&R, IHC) | Thermo Scientific | Cat# PA5-27244 |
| Rabbit Anti-DDIT3 (CHOP) (IP, ChIP, IB, IHC) | Proteintech | Cat# 15204-1-AP |
| Rabbit anti-HA-Tag (C29F4) (IP) | Cell Signaling Technology | Cat# 3724 |
| Mouse anti-HA-Tag (F-7) (IB) | Santa Cruz | Cat# sc-7392 |
| Rabbit anti-V5 (D3H8Q) (IP) | Cell Signaling Technology | Cat# 13202 |
| Mouse anti-V5 (IB) | Thermo Scientific | Cat# R96025 |
| Biological samples | ||
| Primary Tumor Samples | MD Anderson | N/A |
| Human myxoid liposarcoma FFPE slides | MD Anderson | N/A |
| Human myxoid liposarcoma tissue microarray | MD Anderson | N/A |
| Chemicals, peptides, and recombinant proteins | ||
| Puromycin | Sigma Aldrich | Cat# P8833-25MG |
| Dimethyl sulfoxide | Sigma Aldrich | Cat# D2650 |
| CMP12 | Courtesy of Jun Qi | N/A |
| DMEM, high glucose, no glutamine | Life Technologies | Cat# 11960-069 |
| RPMI, no glutamine | Life Technologies | Cat# 21870-092 |
| PBS, 7.4 | Life Technologies | Cat# 10010-049 |
| Penicillin-Streptomycin (10,000 U/mL) | Life Technologies | Cat# 15140-163 |
| GlutaMAX Supplement | Life Technologies | Cat# 35050-079 |
| Sodium Pyruvate (100mM) | Life Technologies | Cat# 11360-070 |
| HEPES (1M) | Life Technologies | Cat# 15630130 |
| MEM non-essential amino acids | Life Technologies | Cat# 11140050 |
| Trypsin-EDTA (0.25%), phenol red | Life Technologies | Cat# 25200-114 |
| TrypLE Exrpress Enzyme (1X), no phenol red | Thermo Fisher Scientific | Cat# 12-604-021 |
| Mesenchymal Stem Cell Basal Medium for Adipose, Umbilical and Bone Marrow-derived MSCs | ATCC | Cat# PCS-500-030 |
| Mesenchymal Stem Cell Growth Kit for Adipose and Umbilical-derived MSCs - Low Serum | ATCC | Cat# PCS-500-040 |
| StemPro Adipogenesis Differentiation Kit | Thermo Fisher Scientific | Cat# A1007001 |
| Polyethylenimine (PEI) (MW 40,000) | Polysciences | Cat#24765 |
| Polybrene | Santa Cruz Biotechnology | Cat#sc-134220 |
| Goat Anti-Mouse IgG Antibody, IRDye 680RD Conjugated | LI-COR Biosciences | Cat#926-68070 |
| Goat Anti-Rabbit IgG Antibody, IRDye 800CW Conjugated | LI-COR Biosciences | Cat#926-32211 |
| Dynabeads Protein G | Thermo Fisher Scientific | Cat#10004D |
| NuPage LDS Sample Buffer (4X) | Life Technologies | Cat#NP0007 |
| Formaldehyde | Sigma-Aldrich | Cat#F8775 |
| Glycine | Sigma-Aldrich | Cat#G7126 |
| RNase | Thermo Fisher Scientific | Cat# EN0531 |
| Proteinase K | Thermo Fisher Scientific | Cat# AM2546 |
| Agencourt AMPure XP | Beckman Coulter | Cat#A63882 |
| Critical commercial assays | ||
| NEBNext Ultra II DNA Library Prep with Sample Purification Beads | New England Biolabs | Cat# E7103 |
| RNeasy Mini Kit | Qiagen | Cat# 74106 |
| NEBNext Poly(A) mRNA Magnetic Isolation Module | New England Biolabs | Cat# E7490 |
| NEBNext Ultra II Directional RNA Library Prep Kit for Illumina | New England Biolabs | Cat# E7660 |
| Illumina Tagment DNA Enzyme and Buffer | Illumina | Cat# 20034198 |
| Deposited data | ||
| ChIP-seq, RNA-seq, and ATAC-seq from cell lines | This study | GEO: GSE179720 |
| RNA-seq of deidentified tumor samples | This study | GEO: GSE179720 |
| RNA-seq of BAF complex-perturbed cancers | Le Loarer et al., 2015 | GEO: SRP052896 |
| Experimental models: Cell lines | ||
| HEK293T LentiX | Clontech | Cat#632180 |
| MLPS-1765-92 | Aman et al., 1992 | RRID:CVCL_S817 |
| MLPS-402-91 | Aman et al., 1992 | RRID:CVCL_S813 |
| MLPS-DL221 | Graaf et al., 2016 | RRID:CVCL_DQ91 |
| ASC52telo, hTERT immortalized adipose derived Mesenchymal stem cells | ATCC | Cat# SCRC-4000 |
| Adipose-Derived Mesenchymal Stem Cells; Normal, Human | ATCC | Cat# PCS-500-011 |
| Oligonucleotides | ||
| shSCR (non-silencing shRNA construct) 5’-CTTACTCTCGCCCAAGCGAGA-3’ | Dharmacon | RHS4346 |
| shDDIT3 5’-CGATTTCCTGCTTGAGCCG-3’ | Dharmacon | RHS4430-200227707 (V3LHS_643408) |
| shBRG1 5’-TCTCTAGGTCGTTGAGGCT-3’ | Dharmacon | RHS4430-200242720 (V3LHS_317182) |
| Recombinant DNA | ||
| Ini1 (BAF47) CRISPR/Cas9 KO Plasmid | Santa Cruz | Cat# sc-401485 |
| EF-1a-MCS-PGK-Blast-EMPTY | Kadoch & Crabtree, 2013 | N/A |
| EF-1a-MCS-PGK-Blast-FUS::DDIT3-HA | Kadoch & Crabtree, 2013 | N/A |
| EF-1a-MCS-PGK-Blast-CEBPB-V5 | Kadoch & Crabtree, 2013 | N/A |
| EF-1a-MCS-PGK-Blast-CEBPB-Ndel20-V5 | Kadoch & Crabtree, 2013 | N/A |
| EF-1a-MCS-PGK-Blast-CEBPB-Ndel40-V5 | Kadoch & Crabtree, 2013 | N/A |
| EF-1a-MCS-PGK-Blast-CEBPB-RLWDmut-V5 | Kadoch & Crabtree, 2013 | N/A |
| EF-1a-MCS-PGK-Blast-DDIT3-HA | Kadoch & Crabtree, 2013 | N/A |
| EF-1a-MCS-PGK-Blast-DDIT3-Ndel10-HA | Kadoch & Crabtree, 2013 | N/A |
| EF-1a-MCS-PGK-Blast-DDIT3-Ndel20-HA | Kadoch & Crabtree, 2013 | N/A |
| EF-1a-MCS-PGK-Blast-DDIT3-WEmut-HA | Kadoch & Crabtree, 2013 | N/A |
| EF-1a-MCS-PGK-Blast-DDIT3-TLWEmut-HA | Kadoch & Crabtree, 2013 | N/A |
| EF-1a-MCS-PGK-Puro-EMPTY | Kadoch & Crabtree, 2013 | N/A |
| EF-1a-MCS-PGK-Puro-FUS::DDIT3-HA | Kadoch & Crabtree, 2013 | N/A |
| Software and algorithms | ||
| Bowtie2 | Langmead and Salzberg, 2012 | http://bowtie-bio.sourceforge.net/bowtie2/index.shtml |
| STAR | Dobin et al., 2013 | https://github.com/alexdobin/STAR |
| MACS2 | Zhang et al., 2008 | https://github.com/taoliu/MACS |
| ngsplot | Shen et al., 2014 | https://github.com/shenlab-sinai/ngsplot |
| EdgeR | Robinson et al., 2010 | https://bioconductor.org/packages/release/bioc/html/edgeR.html |
| GSEA | Subramanian et al., 2005 | http://software.broadistitute.org/gsea/index.jsp |
| Bedtools | Quinlan and Hall, 2010 | http://bedtools.readthedocs.io/en/latest/ |
| Samtools | Li et al., 2009 | http://samtools.sourceforge.net/ |
| Picard | Broad Institute | http://broadinstitute.github.io/picard |
| Trimmomatic | Bolger et al., 2014 | http://www.usadellab.org/cms/?page=trimmomatic |
| Gene Ontology | Gene Ontology Consortium, 2015 | http://geneontology.org/ |
| BWA-MEM | Li, 2013 | bio-bwa.sourceforge.net/ |
| Matplotlib | Hunter, 2007 | https://matplotlib.org/stable/ |
| Seaborn | Michael Waskom | https://seaborn.pydata.org/ |
| Other | ||
EXPERIMENTAL MODEL AND SUBJECT DETAILS
Human Subjects
The age, sex, and gender identity of all subjects whose tumors (deidentified) were subjected to RNA-seq are provided in Table S1. Deidentified myxoid liposarcoma (n=10 for RNA-seq), Ewing sarcoma (n=10 for RNA-seq), and extraskeletal myxoid chondrosarcoma (n=7 for RNA-seq) cases were identified, with pathology and diagnosis confirmed by two independent pathologists at MD Anderson Cancer Center (MDACC). The samples and anonymous clinical data used were obtained and analyzed under protocols approved by the local Institutional Review Board (IRB) or exempted by the HHS Office of Human Subjects Research Protections determination per NIH policy. The IRB committee at MD Anderson approved the studies and confirm that informed consent was obtained from all subjects. Additional primary tumor sequencing data were obtained from publicly available resources and publications.
Cell lines
Three MLPS cell lines, two MSC lines, and a HEK293T LentiX cell line were used in this study. The MLPS-1765-92 and MLPS-402-91 cell lines were generous gifts from Pierre Åman (University of Gothenburg, Sweden) and the MLPS-DL221 cell line was a generous gift from Alexander Lazar (MD Anderson). The hTERT-MSC line (ASC52telo, hTERT immortalized adipose derived Mesenchymal stem cells, ATCC® SCRC-4000) was purchased from ATCC.
MLPS-1765-92 and MLPS-402-91 cells were cultured in RPMI medium (Gibco) supplemented with 10% fetal bovine serum, 1% Glutamax (Gibco), 1% Sodium Pyruvate (Gibco), and 1% Penicillin-Streptomycin (Gibco). MLPS-DL221 cells were cultured in DMEM medium (Gibco) supplemented with 10% fetal bovine serum, 1% Glutamax (Gibco), 1% Sodium Pyruvate (Gibco), and 1% Penicillin-Streptomycin (Gibco). hTERT-MSC and AD-MSC lines were cultured in Mesenchymal Stem Cell Basal Medium (ATCC No. PCS-500-030) supplemented with the Mesenchymal Stem Cell Growth Kit for Adipose and Umbilical-derived MSCs - Low Serum (ATCC No. PCS-500-040) and 0.1% Penicillin-Streptomycin (Gibco). HEK293T LentiX cells were cultured in DMEM medium (Gibco) supplemented with 10% fetal bovine serum, 1% Glutamax (Gibco), 1% Sodium Pyruvate (Gibco), 1% HEPES (Gibco), 1% MEM NEAA (Gibco), and 1% Penicillin-Streptomycin (Gibco). All cells were maintained in a humidified incubator at 37°C with 5% CO2.
METHOD DETAILS
Gene Knockdown and Stable Gene Expression Constructs
Constitutive expression of short-hairpin RNA (shRNA) constructs targeting either the C-terminal end of the FUS::DDIT3 fusion (shDDIT3: 5’-CGGCTCAAGCAGGAAATCG-3’), SMARCA4/BRG1 (shBRG1: 5’-AGCCTCAACGACCTAGAGA-3’), or a scrambled, non-silencing sequence (shSCR: 5’-TCTCGCTTGGGCGAGAGTAAG-3’) was achieved using lentiviral infection of the GIPZ vector selected with puromycin (2 μg/ml). Constitutive expression of FUS::DDIT3 with an HA C-terminal tag in the MSC lines was achieved using lentiviral infection of an EF1alpha-driven expression vector (modified from Clontech, dual Promoter EF-1a-MCS-PGK-Puro).
Lentiviral Generation
Lentivirus was produced by PEI (Polysciences) transfection of HEK293T LentiX cells (Clontech) with gene delivery vector co-transfected with packaging vectors pspax2 and pMD2.G as previously described (Kadoch and Crabtree, 2015). Viral supernatants were harvested 72 hr post-transfection and concentrated by ultracentrifugation at 20,000 rpm for 2.5 hr at 4°C. Virus containing pellets were resuspended in PBS and added dropwise to cells in the presence of 10 μg/mL polybrene. Selection of lentivirally-infected cells was achieved with puromycin used at 2 μg/ml. Knockdown efficiency and overexpression was measured by western blot analysis.
Cell Lysate Collection
Whole-cell extractions were obtained by washing harvested cell pellets with PBS pH 7.4, resuspending them in whole-cell lysis buffer (PBS pH 7.4 and 1% SDS) and sonicating until fully liquid. Nuclear extracts were obtained by suspending harvested cells in Buffer 0 (50 mM Tris pH 7.5, 0.1% NP40, 1 mM EDTA, 1 mM MgCl2 with protease inhibitor cocktail, 1 mM DTT and 1 mM phenylmethylsulfonyl fluoride (PMSF)), centrifuging at 5,000 rpm for 5 min at 4 °C and discarding the supernatant. The nuclei-containing pellets were then resuspended in Buffer 300 (50 mM Tris pH 7.5, 0.1% NP40, 1 mM EDTA, 1 mM MgCl2, 300 mM NaCl with protease inhibitor cocktail, 1 mM DTT, and 1 mM PMSF), vortexed, incubated on ice, and centrifuged at 15,000 rpm for 10 min at 4 °C. Supernatant containing nuclear proteins soluble at 300mM NaCl was then collected.
Immunoprecipitations
Nuclear extracts were quantified by bicinchoninic acid (BCA) assay and 500μg-1mg of protein was incubated with antibody in Buffer 300 (50 mM Tris pH 7.5, 0.1% NP40, 1 mM EDTA, 1 mM MgCl2, 150 mM NaCl with protease inhibitor cocktail, 1 mM DTT and 1 mM PMSF) overnight at 4 °C. Each sample was then incubated with Protein G Dynabeads (Thermo Scientific) for 2hr. Beads were washed five times with Buffer followed by elution with 20 μl of elution buffer (NuPage LDS buffer (2×) (Life Technologies) containing 100 mM DTT and water).
Western Blot Analysis
Standard protocols were used for the detection of proteins by immunoblot (IB) analysis and the primary antibodies used are listed. Membranes were developed using IRDye (LI-COR Biosciences) secondary antibodies for visualization by the LI-COR Odyssey Imaging System (LI-COR Biosciences).
Cell Proliferation Assay
To measure cell proliferation following lentiviral infection, 5K cells per well were seeded in 12-well plates following 72-hr exposure to lentivirus and 4-day selection with puromycin (2 μg/ml). The viable cell count in three wells was then measured using a Vi-CELL Cell Counter (Beckman) at each timepoint.
CRISPR-Cas9 Mediated Gene Knockout of SMARCB1
The SMARCB1 locus was targeted by the Ini1 (h) CRISPR/Cas9 KO Plasmid (Santa Cruz Biotechnology sc-423027) in MLPS-1765-92 cells following the manufacturer’s protocol with the Lipofectamine 3000 transfection reagent (Invitrogen). Cells were expanded for 72–96 hours and GFP+ cells expressing the KO plasmids were single-cell sorted using FACS (fluorescence-activated cell sorting). Single-cell clones were expanded and screened using immunoblot detection for identification of successful knockouts.
Chromatin Immunoprecipitation (ChIP)
Cells were harvested following 72-hr exposure to specified lentivirus and 4-day selection with 2 μg/ml of puromycin. ChIP experiments were performed per standard protocols (Millipore, Billerica, MA) with minor modifications. Briefly, cells were cross-linked for 10 min with 1% formaldehyde at 37 °C. This reaction was subsequently quenched with 125 mM glycine for 5 min and 10 million fixed cells were used per ChIP experiment. Chromatin from fixed cells was fragmented by sonication with a Covaris E220 and the solubilized chromatin was incubated with the indicated antibody listed overnight at 4°C. Antibody-chromatin complexes were pulled down by incubation with Protein G-Dynabeads (Thermo Scientific) for 2 hours at 4°C, washed, and eluted. The samples then underwent crosslink reversal, RNase A (Roche) treatment, and proteinase K (Thermo Scientific) treatment before the captured DNA was extracted with AMPure XP beads (Beckman Coulter). ChIP-seq libraries were prepared with Illumina’s NEBNext Ultra II DNA library Prep Kit using standard protocols. ChIP-seq was sequenced on Illumina Next-seq 500 using 75 bp single-end sequencing parameters.
Cleavage Under Targets and Release Using Nuclease (CUT&RUN)
Cells were harvested following 24-hr exposure to DMSO or 10uM of CMP12 (generous gift of Jun Qi) followed by 24-hr exposure to DMSO plus base media or StemPro Adipogenesis media (ThermoFisher) or 10uM CMP12 plus base media or StemPro Adipogenesis media. CUT&RUN experiments were performed according to established protocols (Skene et al., 2018) with minor modifications. Briefly, 500K cells per sample were incubated with Concanavalin A-coated beads (Polysciences) for 10 min and then permeabilized with Triton X-100. Cell-bead complexes were then incubated with the indicated antibody for 2 hr at 4°C. Cell-bead complexes were washed and then incubated with pA-MNase for 1 hr at 4°C. Cell-bead complexes were washed and then cooled to ~0°C. pA-MNase was activated by the addition of calcium chloride and incubated for 30 min at ~0°C. The cleavage reaction was quenched with a solution containing spike-in DNA and RNAase A. Cleaved DNA fragments released into solution were then collected and treated with sodium dodecyl sulfate (SDS) and proteinase K (Thermo Scientific). DNA was then isolated using phenol-chloroform. CUT&RUN libraries were prepared with Illumina’s NEBNext Ultra II DNA library Prep Kit with modifications that aim to preserve short fragments.
RNA Isolation from Cell Lines
Cells were harvested following 72-hr exposure to the specified lentivirus and either 4-day (day 7 post-transduction) or 11 day (day 14 post-transduction) selection with 2 μg/ml of puromycin for RNA-seq experiments. All RNA was collected using the RNeasy Mini Kit (Qiagen). RNA-seq libraries were prepared using the Nebnext Poly(A) mRNA Magnetic Isolation Module and the Nebnext Ultra II Directional RNA Library Prep Kit for Illumina using standard protocols. RNA was sequenced on Illumina Next-seq 500 (Illumina) using 75 bp single-end sequencing parameters.
RNA Isolation from Tumor Samples
Snap-frozen tumor tissue samples were obtained from the MD Anderson Institutional Tissue Bank (ITB) using an IRB-approved protocol. Frozen samples were embedded in O.C.T. (Tissue-Tek), sectioned in a Cryostat (Leica CM1680 UV) and underwent hematoxylin and eosin staining for pathologist review to confirm the presence of viable tumor tissue. Tissues were then excised from O.C.T. using scalpel and forceps and 30 mg samples were placed in RNAlater-ICE (Invitrogen) pre-chilled to −80°C. Samples were thawed overnight at −20°C, then disrupted using a TissueLyser LT (Qiagen) for 5 minutes at 50 Hz. RNA was isolated using the RNeasy Mini Kit (Qiagen), following the manufacturer protocol with on-column DNase I (Qiagen) digestion.
Immunohistochemistry
Immunohistochemistry (IHC) staining was performed on formalin fixed, paraffin embedded (FFPE) tissue microarrays (TMA) containing samples from 50 myxoid liposarcoma (MLPS) patients and 8 normal adipose tissue samples. An additional 19 whole slide sections of normal adipose tissue were also stained. Sections were stained with rabbit anti-human polyclonal antibody against PTX3 (Sigma-Aldrich, HPA069320). IHC was done using a Leica Bond RXm automated Stainer, using Bond Refine Detection (Leica) kit reagents except where otherwise noted. After dewaxing, samples underwent antigen retrieval with Tris-EDTA Buffer at 100°C for 20 minutes, followed by peroxidase blocking for 5 minutes. Samples were incubated with primary PTX3 antibody diluted 1:500 in Dako Antibody Diluent (Dako, S0809) at room temperature for 15 minutes, followed by an 8-minute incubation with polymer secondary antibody. Slides were then treated with 3’−3-diaminobenzidine (DAB) for 10 minutes, DAB Enhancer for 5 minutes, and Hematoxylin counterstain for 8 minutes. After air-drying, slides were mounted with Cytoseal 60.
Slides were scanned and digitized using Scanscope XT (Aperio/Leica Technologies). A pathologist performed quantitative analysis of the IHC staining using microscope direct observation. The results were expressed as percentage (0 to 100%) and intensity (negative: 0, mild: 1, moderate: 2, and high: 3) of cytoplasmic and membranous positivity in tumor cells for each tumor and normal adipose tissue. When patients were represented by multiple tumor samples, the scores of all samples for a given patient were averaged. Representative images were obtained from scanned IHC slides using Halo software v3.1.1.
Assay for Transposase-Accessible Chromatin Sequencing (ATAC-seq)
Cells were harvested following 72-hr exposure to lentivirus and 4 days of selection with 2 μg/ml of puromycin. ATAC-seq experiments were performed as previously described (Buenrostro et al., 2015a). Samples for ATAC-seq prepared using the Nextera DNA sample Prep Kit (Illumina). Briefly, 50K cells were incubated in hypotonic buffer and lysis buffer, then were resuspended in transposase reaction mixture for 30 min at 37°C with gentle shaking followed by DNA purification and 12 cycles of amplification. ATAC-seq samples were sequenced on Next-seq 500 (Illumina) using 37 bp pair-end sequencing parameters.
QUANTIFICATION AND STATISTICAL ANALYSIS
Data Processing for ChIP, Cut&Run, RNA, and ATAC samples
ChIP-seq reads were mapped to the hg19 human genome assembly using Bowtie2 v2.1.0 (-k 1) (Langmead and Salzberg, 2012). RNA-seq reads were mapped to the hg19 human genome assembly using STAR v2.3.1 (Dobin et al., 2013) with default parameters. Alignment files in BAM format were generated using samtools v0.1.19 (Li et al., 2009). ATAC-seq paired-end reads were processed as follows: reads were trimmed to 30bp using Trimmomatic v0.35 (Bolger et al., 2014), mapped to the hg19 human genome assembly using Bowtie2 v2.1.0 (-X2000), and filtered for duplicates using Picard MarkDuplicates (BroadInstitute, 2019).
Cut&Run reads were processed using the Cut&RunTools pipeline with default parameters (Zhu et al., 2019). Exogenous spike-in reads were mapped similarly with fly reads mapped to the dm3 fly genome assembly and e-coli reads mapped to the NC_000913.3 genome assembly. Unless otherwise noted, ChIP-seq and RNA-seq data were adjusted for exogenous spike-in in downstream analyses, and Cut&Run data was not adjusted for exogenous spike-in.
Raw counts for ChIP, Cut&Run, and ATAC samples across a subset of sites were generated using bedtools intersect with default parameters on coverage bed files. Single-end reads for ChIP-seq were converted to the appropriate single-end bed file using samtools bamtobed with default parameters. Paired-end reads for Cut&Run and ATAC samples were converted to the appropriate paired-end bed file using samtools view (-h) and a custom perl script to filter the SAM entries. RNA-seq gene counts for cell-line data were generated with using STAR (-quantMode GeneCounts, last column of GeneReadsOut.tab) against the hg19 refFlat annotation. Raw counts were converted to RPKMs based on the standard formula using gene lengths from the hg19 refFlat annotation and total mapped reads from samtools idxstats.
ChIP-seq Data Analysis
Peaks were called over corresponding input using MACS2 v2.1.0 (-q 0.001) (Zhang et al., 2008) with the narrow peak caller for all marks in this study. Duplicate reads were excluded using samtools rmdup and used for downstream analyses. ChIP-seq tracks on the scale of per million mapped reads were created using MACS2 v2.1.0 (-B -SPMR).
SMARCC1, CEBPB, and DDIT3 peaks were merged across conditions for each antibody using the default bedtools merge call. Venn diagrams of peak overlaps were generated using the ChIPpeakAnno package in R with the findOverlapsOfPeaks and makeVennDiagram functions with default parameters. SMARCC1 lost and gained sites upon shDDIT3 in MLS1765 were determined using SMARCC1-MLS1765 replicates (002, 003, 004, 005, 012, 018) in edgeR (glmQLFit, log2FC=0, q=0.01). Exogenous spike-in was not factored in this analysis. SMARCC1 lost and gained sites upon shDDIT3 in MLS402 were determined using a fold-change calculation based on RPKMs (log2FC=0.59). Unless otherwise noted, spike-in normalized MLS1765 replicates for DDIT3 (007, 008), CEBPB (013, 019), SMARCC1 (002, 003), and H3K27ac (014, 020) and all spike-in normalized MLS402 samples were used for data visualization, especially for density heatmaps and metaplots across a set of genomic sites.
Transcription factor enrichment across these sets of sites was determined using the LOLA R package (Sheffield and Bock, 2016) with default parameters, against a background of merged SMARCC1-MLS1765 peaks for MLS1765 and merged SMARCC1-MLS402 peaks for MLS402 sites. Scatterplots of log(p-val) vs rank were made using matplotlib and colored by tissue type or antibody.
FASTA sequences across these sets of sites were generated using site centers with flanking windows of 200bp (total window size of 400bp). Enriched motifs across these sets of sites were determined using HOMER findMotifsGenome.pl (Heinz et al., 2010) against genome-background (-size 400) and SMARCC1-background (-size 400 -bg). HOMER motif known results were visualized as barplots using matplotlib. Motif enrichment across these sets of sites against a shuffled set of control sequences with similar k-mer frequencies was also determined using AME (McLeay and Bailey, 2010) with modified parameters (--scoring totalhits --control). AME motif results were visualized as scatterplots of log(q-val) vs rank and colored by transcription factor or transcription factory family. Unless otherwise noted, barplots and Venn diagrams were visualized using matplotlib, and heatmaps were created using seaborn clustermap.
CUT&RUN-seq Data Analysis
The Brg1 and CEBPB sites were merged (for each antibody separately) across conditions (−/+ adipogenic media) in DMSO and CMP12. Raw counts for Cut&Run were generated across these sets of sites using bedtools intersect with default parameters and converted to RPKMs using site widths and total million mapped reads from samtools idxstats as the scaling factor.
Brg1 lost and gained sites upon adipogenesis in DMSO and CMP12 in hTERT- and AD-MSCs were determined using a fold-change calculation based on RPKMs (log2FC=0.59). MA plots of gained and lost sites for Brg1 and CEBPB were visualized as scatter plots in log(RPKMs) in base and adipogenic media under DMSO and CMP12 conditions using matplotlib.
Cell Line RNA-seq Data Analysis
Gene counts were extracted from the STAR counter (ReadsGeneOut.tab) using the last column. Counts were prefiltered to exclude genes with less than one read per sample on average across all the samples in the design matrix. The design matrix consisted of all samples pertinent to the contrasts of interest. Unless otherwise noted, upregulated and downregulated genes were determined using the edgeR (Robinson et al., 2010) package in R (glmQLFit, LFC > 0, q < 0.01). The prefiltered raw count matrices were converted to RPKMS using a hg19 refFlat annotation with median isoform length for gene length and total million gene counts per sample for the scaling factor. Unless otherwise noted, gene heatmaps were visualized as z-scored RPKMs across the samples using a blue-white-red heatmap in the clustermap function of seaborn.
Enrichment of biological processes was determined through a plethora of methods: Metascape (Zhou et al., 2019) analyses with default parameters, GSEA (Subramanian et al., 2005) analyses with default parameters, and custom gene set overlap analysis against the MSigDB database (Liberzon et al., 2011). Subsets of upregulated genes, downregulated genes, upregulated and gained BAF targets, and downregulated and lost BAF targets across a variety of conditions were used as input into Metascape with default parameters. The genes of enriched pathways or processes related to differentiation, development, adipogenesis, fat processes and cancer were further analyzed and visualized as heatmaps using matplotlib or seaborn. EdgeR was used to estimate the logFCs of the genes if replicates were available; otherwise, RPKM-based logFCs were calculated using RPKMs with a pseudocount of 1. These logFCs were used to rank genes for input into GSEA in pre-ranked mode (-norm meandiv -nperm 20000 -scoring_scheme weighted -set_max 500 -set_min 15) against a variety of MSigDB databases, including Hallmark (Liberzon et al., 2015) and Wikipathways (Slenter et al., 2018) databases. GSEA results were visualized as scatterplots of the normalized enrichment score (NES) vs rank and colored by pathways related to differentiation, development, adipogenesis, fat processes and cancer. Subsets of genes were also mined against the MSigDB database of genesets using an overlap test, with the degree of overlap significance assessed using a hypergeometric test. Enriched pathways or biological processes were visualized as scatter plots of log(p-value) vs rank of different genesets colored by pathways related to differentiation, development, adipogenesis, fat processes and cancer.
Tumor RNA-seq Data Analysis
Primary tumor data of Ewing’s sarcoma and SMARCB1-null cancers (MRT, EpS, RMC) were obtained from a previous study and processed as previously described (McBride et al., 2018). FeatureCounts with custom parameters (exclude multi-mapping reads and ignore duplicates for single-end reads, exclude multi-mapping reads, ignore duplicates and require both ends mapped for paired-end reads) against the hg19 refFlat gene annotation were used to create raw count matrices for this data. EMC and MLPS tumors sequenced in this study were processed as previously described in Sequencing Data Preparation and raw counts were obtained from the STAR counter (ReadsGeneOut.tab) using the last column. These data were merged and prefiltered for low counts, excluding genes with less than one read per sample on average. The raw count matrices were converted to RPKMs using the column sums to estimate the per-million scaling factor and the hg19 refFlat gene annotation median isoform gene lengths as estimates of the effective lengths. The RPKMs matrices were converted to TPMs by scaling the RPKM values by the total million RPKM scaling factor (RPKMi*106/ΣRPKMk). The TPM matrix was filtered to exclude genes that had less than 1 TPM on average across the samples. Additionally, small RNA genes, MIR and SNO genes, were excluded. The TPM matrix was quantile normalized using the normalizeQuantiles function in the limma R statistical package (Ritchie et al., 2015) and subsequently used as input into the PCA, using all genes and the top 10% most variable genes. Similarly, the TPM matrix was prefiltered for the combined MLPS/ES/EpS/RMC/MRT matrix to exclude genes with less than 1 TPM per sample on average across all the corresponding samples and small RNA genes: MIR and SNO genes. Outliers replicates from this study and prior studies were excluded via visual analysis of a clustered heatmap (k-means across genes and hierarchical clustering across samples) of the top 10% most variable genes using z-scored TPMs across all samples. A two-sample t-test based on the mean difference in TPMs for the ES group vs MLPS/MRT/EpS/RMC group was used to assess the significance of the difference for each gene, and logFCs values were calculated using these mean TPM values. Finally, significant genes with large effect sizes (logFC=1, p-value=0.05) were chosen as input in the PCA. The first two leading components of the PCA were visualized as a scatter plot colored by tumor type (ES/MLPS/RMC/EpS/MRT). Principal component loading scores were visualized as a barplot using matplotlib. Metascape analysis was conducted with default parameters on the up and down genesets from the two-sample t-tests as well as the genes with negative loading scores from the first principle component.
ATAC-seq Data Analysis
ATAC peaks were merged across conditions using bedtools intersect with default parameters. Gained and lost sites of accessibility were determined using the edgeR package in R (glmQLFit, log2FC=0, q=0.01). The ChromVar R package (Schep et al., 2017) was used to identify the underlying motifs that drive variances in accessibility, using the merged ATAC peaks as background. The variability scores and z-score difference scores from ChromVar were visualized as a scatter plot colored by the CEB/P and AP1 TF-families in matplotlib.
Genomics Integration and Visualization
Sites of interest were annotated to their nearest protein-coding gene against the hg19 refFlat gene annotation and distance to TSS calculations with the a custom perl script. Gene intersections with gene subsets were visualized using an MA plot of logFC vs logCPM (with replicates) or logFC vs logRPKM (without replicates). Gene intersections were input into downstream gene enrichment analysis such as Metascape with default parameters and custom mining of the MSigDB database as previously described. Gene enrichment results from Metascape were visualized as barplots or scatterplot of log(q-val) vs rank colored by relevant processes and pathways using matplotlib. Similarly, enrichment results from the custom mining of the MSigDB database were visualized using scatterplots of log(p-val) vs rank colored by relevant processes and pathways using matplotlib.
Mean RPKM signal from ChIP, ATAC, and Cut&Run over different subsets of sites were visualized as boxplots using matplotlib or R base functions. Shading was consistent with the hues in the heatmaps and metaplots. Heatmaps and metaplots were generated for each antibody over subsets of sites using ngs.plot.r with either 3000kb windows or 5000kb windows centered on each site (-G hg19 -FL 150 -L 2500 -R bed). Spike-in factors were incorporated by manipulating the estimated library sizes from ngs.plot. Heatmaps and metaplots were visualized on the RPM-scale using matplotlib.
Quantification and Statistical Analysis
Two-sample t-tests were used to evaluate the significance of the difference in expression of genes between tumor types or tumor groups in the primary tumor RNA-seq analysis. Hypergeometric tests were used to evaluate the significance of the degree of overlap between gene lists and MSigDB Hallmark and Wikipathways genesets.
Supplementary Material
Table S1. Patient and tumor information for MLPS and other sarcoma samples used in RNA-seq analyses, Related to Figures 3, 5. Patient and tumor information for all MLPS, DSCRT, Ewing Sarcoma, extraskeletal myxoid chondrosarcoma, and low-grade fibromyxoid sarcoma primary tumors profiled using RNA-seq.
Highlights.
The FUS-DDIT3 oncoprotein inhibits BAF complex targeting to CEBPB target enhancers
Aberrant chromatin binding of CEBPB and BAF complexes underlie MLPS gene expression
Small molecule-based BAF complex inhibition attenuates adipogenesis in MSCs
MLPS gene expression signatures mirror those of BAF loss-of-function tumor types
Acknowledgements
We are grateful to all members of the Kadoch Laboratory for helpful suggestions and advice throughout the project. We thank Pierre Åman for the MLPS-1765-92 and MLPS-402-91 cell lines that were used in this study. We also thank members of the PhD thesis dissertation committee for H.J.Z., including Drs. Benjamin Ebert, Kimberley Stegmaier, and David Langenau. This work was supported in part by grants 1DP2CA195762-01 (C.K.), the Pew-Stewart Scholars in Cancer Research Award (C.K.), and the American Cancer Society Research Scholar Award RSG-14-051-01-DMC (C.K.). H.J.Z. is supported by the Harvard Medical School Medical Scientist Training Program (MSTP).
Footnotes
Publisher's Disclaimer: This is a PDF file of an unedited manuscript that has been accepted for publication. As a service to our customers we are providing this early version of the manuscript. The manuscript will undergo copyediting, typesetting, and review of the resulting proof before it is published in its final form. Please note that during the production process errors may be discovered which could affect the content, and all legal disclaimers that apply to the journal pertain.
Declarations of Interest
C.K. is the scientific founder, fiduciary Board of Directors member, Scientific Advisory Board Member, shareholder and consultant for Foghorn Therapeutics, Inc. (Cambridge, MA). CK also serves on the scientific advisory boards for Nereid Therapeutics and Nested Therapeutics and is a consultant for Cell Signaling Technologies. The other authors declare no competing interests.
References
- Adelmant G, Gilbert JD, and Freytag SO (1998). Human translocation liposarcoma-CCAAT/enhancer binding protein (C/EBP) homologous protein (TLS-CHOP) oncoprotein prevents adipocyte differentiation by directly interfering with C/EBPbeta function. J Biol Chem 273, 15574–15581. [DOI] [PubMed] [Google Scholar]
- Agaimy A (2019). SWI/SNF Complex-Deficient Soft Tissue Neoplasms: A Pattern-Based Approach to Diagnosis and Differential Diagnosis. Surg Pathol Clin 12, 149–163. [DOI] [PubMed] [Google Scholar]
- Åman P (2015). Fusion Oncogenes of Sarcomas. In Chromosomal Translocations and Genome Rearrangements in Cancer, Rowley JD, Le Beau MM, and Rabbitts TH, eds. (Cham: Springer International Publishing; ), pp. 321–331. [Google Scholar]
- Aman P, Ron D, Mandahl N, Fioretos T, Heim S, Arheden K, Willén H, Rydholm A, and Mitelman F (1992). Rearrangement of the transcription factor gene CHOP in myxoid liposarcomas with t(12;16)(q13;p11). Genes Chromosomes Cancer 5, 278–285. [DOI] [PubMed] [Google Scholar]
- Andersson MK, Ståhlberg A, Arvidsson Y, Olofsson A, Semb H, Stenman G, Nilsson O, and Aman P (2008). The multifunctional FUS, EWS and TAF15 proto-oncoproteins show cell type-specific expression patterns and involvement in cell spreading and stress response. BMC Cell Biol 9, 37. [DOI] [PMC free article] [PubMed] [Google Scholar]
- Antonescu CR, Tschernyavsky SJ, Decuseara R, Leung DH, Woodruff JM, Brennan MF, Bridge JA, Neff JR, Goldblum JR, and Ladanyi M (2001). Prognostic impact of P53 status, TLS-CHOP fusion transcript structure, and histological grade in myxoid liposarcoma: a molecular and clinicopathologic study of 82 cases. Clin Cancer Res 7, 3977–3987. [PubMed] [Google Scholar]
- Barak Y, Nelson MC, Ong ES, Jones YZ, Ruiz-Lozano P, Chien KR, Koder A, and Evans RM (1999). PPAR gamma is required for placental, cardiac, and adipose tissue development. Mol Cell 4, 585–595. [DOI] [PubMed] [Google Scholar]
- Barr FG, Galili N, Holick J, Biegel JA, Rovera G, and Emanuel BS (1993). Rearrangement of the PAX3 paired box gene in the paediatric solid tumour alveolar rhabdomyosarcoma. Nature Genetics 3, 113–117. [DOI] [PubMed] [Google Scholar]
- Bishop JM (1987). The molecular genetics of cancer. Science 235, 305. [DOI] [PubMed] [Google Scholar]
- Bolger AM, Lohse M, and Usadel B (2014). Trimmomatic: a flexible trimmer for Illumina sequence data. Bioinformatics 30, 2114–2120. [DOI] [PMC free article] [PubMed] [Google Scholar]
- Boulay G, Sandoval GJ, Riggi N, Iyer S, Buisson R, Naigles B, Awad ME, Rengarajan S, Volorio A, McBride MJ, et al. (2017). Cancer-Specific Retargeting of BAF Complexes by a Prion-like Domain. Cell 171, 163–178.e119. [DOI] [PMC free article] [PubMed] [Google Scholar]
- Brien GL, Stegmaier K, and Armstrong SA (2019). Targeting chromatin complexes in fusion protein-driven malignancies. Nature Reviews Cancer 19, 255–269. [DOI] [PubMed] [Google Scholar]
- BroadInstitute (2019). Picard Toolkit.
- Buenrostro JD, Wu B, Chang HY, and Greenleaf WJ (2015a). ATAC-seq: A Method for Assaying Chromatin Accessibility Genome-Wide. Curr Protoc Mol Biol 109, 21.29.21–21.29.29. [DOI] [PMC free article] [PubMed] [Google Scholar]
- Cao Z, Umek RM, and McKnight SL (1991). Regulated expression of three C/EBP isoforms during adipose conversion of 3T3-L1 cells. Genes Dev 5, 1538–1552. [DOI] [PubMed] [Google Scholar]
- Caramel J, Medjkane S, Quignon F, and Delattre O (2008a). The requirement for SNF5/INI1 in adipocyte differentiation highlights new features of malignant rhabdoid tumors. Oncogene 27, 2035–2044. [DOI] [PubMed] [Google Scholar]
- Caramel J, Medjkane S, Quignon F, and Delattre O (2008b). The requirement for SNF5/INI1 in adipocyte differentiation highlights new features of malignant rhabdoid tumors. Oncogene 27, 2035–2044. [DOI] [PubMed] [Google Scholar]
- Chang J, Oikawa S, Iwahashi H, Kitagawa E, Takeuchi I, Yuda M, Aoki C, Yamada Y, Ichihara G, Kato M, et al. (2014). Expression of proteins associated with adipocyte lipolysis was significantly changed in the adipose tissues of the obese spontaneously hypertensive/NDmcr-cp rat. Diabetol Metab Syndr 6, 8. [DOI] [PMC free article] [PubMed] [Google Scholar]
- Clapier CR, Iwasa J, Cairns BR, and Peterson CL (2017). Mechanisms of action and regulation of ATP-dependent chromatin-remodelling complexes. Nature Reviews Molecular Cell Biology 18, 407–422. [DOI] [PMC free article] [PubMed] [Google Scholar]
- Conyers R, Young S, and Thomas DM (2011). Liposarcoma: molecular genetics and therapeutics. Sarcoma 2011, 483154. [DOI] [PMC free article] [PubMed] [Google Scholar]
- Crew AJ, Clark J, Fisher C, Gill S, Grimer R, Chand A, Shipley J, Gusterson BA, and Cooper CS (1995). Fusion of SYT to two genes, SSX1 and SSX2, encoding proteins with homology to the Kruppel-associated box in human synovial sarcoma. Embo j 14, 2333–2340. [DOI] [PMC free article] [PubMed] [Google Scholar]
- Crozat A, Åman P, Mandahl N, and Ron D (1993). Fusion of CHOP to a novel RNA-binding protein in human myxoid liposarcoma. Nature 363, 640–644. [DOI] [PubMed] [Google Scholar]
- Delattre O, Zucman J, Plougastel B, Desmaze C, Melot T, Peter M, Kovar H, Joubert I, de Jong P, Rouleau G, et al. (1992). Gene fusion with an ETS DNA-binding domain caused by chromosome translocation in human tumours. Nature 359, 162–165. [DOI] [PubMed] [Google Scholar]
- Dobin A, Davis CA, Schlesinger F, Drenkow J, Zaleski C, Jha S, Batut P, Chaisson M, and Gingeras TR (2013). STAR: ultrafast universal RNA-seq aligner. Bioinformatics 29, 15–21. [DOI] [PMC free article] [PubMed] [Google Scholar]
- Galili N, Davis RJ, Fredericks WJ, Mukhopadhyay S, Rauscher FJ 3rd, Emanuel BS, Rovera G, and Barr FG (1993). Fusion of a fork head domain gene to PAX3 in the solid tumour alveolar rhabdomyosarcoma. Nat Genet 5, 230–235. [DOI] [PubMed] [Google Scholar]
- Gonzalez Porras MA, Stojkova K, Vaicik MK, Pelowe A, Goddi A, Carmona A, Long B, Qutub AA, Gonzalez A, Cohen RN, et al. (2021). Integrins and extracellular matrix proteins modulate adipocyte thermogenic capacity. Sci Rep 11, 5442. [DOI] [PMC free article] [PubMed] [Google Scholar]
- Gryder BE, Yohe ME, Chou H-C, Zhang X, Marques J, Wachtel M, Schaefer B, Sen N, Song Y, Gualtieri A, et al. (2017). PAX3–FOXO1 Establishes Myogenic Super Enhancers and Confers BET Bromodomain Vulnerability. Cancer Discovery 7, 884. [DOI] [PMC free article] [PubMed] [Google Scholar]
- Heinz S, Benner C, Spann N, Bertolino E, Lin YC, Laslo P, Cheng JX, Murre C, Singh H, and Glass CK (2010). Simple combinations of lineage-determining transcription factors prime cis-regulatory elements required for macrophage and B cell identities. Mol Cell 38, 576–589. [DOI] [PMC free article] [PubMed] [Google Scholar]
- Iurlaro M, Stadler MB, Masoni F, Jagani Z, Galli GG, and Schübeler D (2021). Mammalian SWI/SNF continuously restores local accessibility to chromatin. Nat Genet 53, 279–287. [DOI] [PubMed] [Google Scholar]
- Jain S, Xu R, Prieto VG, and Lee P (2010). Molecular classification of soft tissue sarcomas and its clinical applications. Int J Clin Exp Pathol 3, 416–428. [PMC free article] [PubMed] [Google Scholar]
- Kadoch C, and Crabtree Gerald R. (2013). Reversible Disruption of mSWI/SNF (BAF) Complexes by the SS18::SSX Oncogenic Fusion in Synovial Sarcoma. Cell 153, 71–85. [DOI] [PMC free article] [PubMed] [Google Scholar]
- Kadoch C, and Crabtree GR (2015). Mammalian SWI/SNF chromatin remodeling complexes and cancer: Mechanistic insights gained from human genomics. Science Advances 1, e1500447. [DOI] [PMC free article] [PubMed] [Google Scholar]
- Knight JC, Renwick PJ, Dal Cin P, Van den Berghe H, and Fletcher CD (1995). Translocation t(12;16)(q13;p11) in myxoid liposarcoma and round cell liposarcoma: molecular and cytogenetic analysis. Cancer Res 55, 24–27. [PubMed] [Google Scholar]
- Kuroda M, Ishida T, Horiuchi H, Kida N, Uozaki H, Takeuchi H, Tsuji K, Imamura T, Mori S, Machinami R, et al. (1995). Chimeric TLS/FUS-CHOP gene expression and the heterogeneity of its junction in human myxoid and round cell liposarcoma. Am J Pathol 147, 1221–1227. [PMC free article] [PubMed] [Google Scholar]
- Langmead B, and Salzberg SL (2012). Fast gapped-read alignment with Bowtie 2. Nat Methods 9, 357–359. [DOI] [PMC free article] [PubMed] [Google Scholar]
- Li H, Handsaker B, Wysoker A, Fennell T, Ruan J, Homer N, Marth G, Abecasis G, and Durbin R (2009). The Sequence Alignment/Map format and SAMtools. Bioinformatics 25, 2078–2079. [DOI] [PMC free article] [PubMed] [Google Scholar]
- Liberzon A, Birger C, Thorvaldsdóttir H, Ghandi M, Mesirov JP, and Tamayo P (2015). The Molecular Signatures Database (MSigDB) hallmark gene set collection. Cell Syst 1, 417–425. [DOI] [PMC free article] [PubMed] [Google Scholar]
- Liberzon A, Subramanian A, Pinchback R, Thorvaldsdóttir H, Tamayo P, and Mesirov JP (2011). Molecular signatures database (MSigDB) 3.0. Bioinformatics 27, 1739–1740. [DOI] [PMC free article] [PubMed] [Google Scholar]
- Lindén M, Thomsen C, Grundevik P, Jonasson E, Andersson D, Runnberg R, Dolatabadi S, Vannas C, Luna Santamarίa M, Fagman H, et al. (2019). FET family fusion oncoproteins target the SWI/SNF chromatin remodeling complex. EMBO Rep 20. [DOI] [PMC free article] [PubMed] [Google Scholar]
- Mathur R, Alver BH, San Roman AK, Wilson BG, Wang X, Agoston AT, Park PJ, Shivdasani RA, and Roberts CW (2017). ARID1A loss impairs enhancer-mediated gene regulation and drives colon cancer in mice. Nat Genet 49, 296–302. [DOI] [PMC free article] [PubMed] [Google Scholar]
- McBride MJ, Mashtalir N, Winter EB, Dao HT, Filipovski M, D'Avino AR, Seo HS, Umbreit NT, St Pierre R, Valencia AM, et al. (2020). The nucleosome acidic patch and H2A ubiquitination underlie mSWI/SNF recruitment in synovial sarcoma. Nat Struct Mol Biol 27, 836–845. [DOI] [PMC free article] [PubMed] [Google Scholar]
- McBride MJ, Pulice JL, Beird HC, Ingram DR, D’Avino AR, Shern JF, Charville GW, Hornick JL, Nakayama RT, Garcia-Rivera EM, et al. (2018). The SS18::SSX Fusion Oncoprotein Hijacks BAF Complex Targeting and Function to Drive Synovial Sarcoma. Cancer Cell 33, 1128–1141.e1127. [DOI] [PMC free article] [PubMed] [Google Scholar]
- McLeay RC, and Bailey TL (2010). Motif Enrichment Analysis: a unified framework and an evaluation on ChIP data. BMC Bioinformatics 11, 165. [DOI] [PMC free article] [PubMed] [Google Scholar]
- Michel BC, D'Avino AR, Cassel SH, Mashtalir N, McKenzie ZM, McBride MJ, Valencia AM, Zhou Q, Bocker M, Soares LMM, et al. (2018). A non-canonical SWI/SNF complex is a synthetic lethal target in cancers driven by BAF complex perturbation. Nat Cell Biol 20, 1410–1420. [DOI] [PMC free article] [PubMed] [Google Scholar]
- Nacev BA, Jones KB, Intlekofer AM, Yu JSE, Allis CD, Tap WD, Ladanyi M, and Nielsen TO (2020). The epigenomics of sarcoma. Nature Reviews Cancer 20, 608–623. [DOI] [PMC free article] [PubMed] [Google Scholar]
- Nakano K, and Takahashi S (2018). Translocation-Related Sarcomas. Int J Mol Sci 19, 3784. [DOI] [PMC free article] [PubMed] [Google Scholar]
- Nakayama RT, Pulice JL, Valencia AM, McBride MJ, McKenzie ZM, Gillespie MA, Ku WL, Teng M, Cui K, Williams RT, et al. (2017). SMARCB1 is required for widespread BAF complex-mediated activation of enhancers and bivalent promoters. Nat Genet 49, 1613–1623. [DOI] [PMC free article] [PubMed] [Google Scholar]
- Nerlov C (2007). The C/EBP family of transcription factors: a paradigm for interaction between gene expression and proliferation control. Trends in Cell Biology 17, 318–324. [DOI] [PubMed] [Google Scholar]
- Pan J, McKenzie ZM, D'Avino AR, Mashtalir N, Lareau CA, St Pierre R, Wang L, Shilatifard A, and Kadoch C (2019). The ATPase module of mammalian SWI/SNF family complexes mediates subcomplex identity and catalytic activity-independent genomic targeting. Nat Genet 51, 618–626. [DOI] [PMC free article] [PubMed] [Google Scholar]
- Panagopoulos I, Höglund M, Mertens F, Mandahl N, Mitelman F, and Aman P (1996). Fusion of the EWS and CHOP genes in myxoid liposarcoma. Oncogene 12, 489–494. [PubMed] [Google Scholar]
- Panagopoulos I, Mandahl N, Ron D, Höglund M, Nilbert M, Mertens F, Mitelman F, and Aman P (1994). Characterization of the CHOP breakpoints and fusion transcripts in myxoid liposarcomas with the 12;16 translocation. Cancer Res 54, 6500–6503. [PubMed] [Google Scholar]
- Papillon JPN, Nakajima K, Adair CD, Hempel J, Jouk AO, Karki RG, Mathieu S, Möbitz H, Ntaganda R, Smith T, et al. (2018). Discovery of Orally Active Inhibitors of Brahma Homolog (BRM)/SMARCA2 ATPase Activity for the Treatment of Brahma Related Gene 1 (BRG1)/SMARCA4-Mutant Cancers. J Med Chem 61, 10155–10172. [DOI] [PubMed] [Google Scholar]
- Pedersen TA, Kowenz-Leutz E, Leutz A, and Nerlov C (2001a). Cooperation between C/EBPalpha TBP/TFIIB and SWI/SNF recruiting domains is required for adipocyte differentiation. Genes Dev 15, 3208–3216. [DOI] [PMC free article] [PubMed] [Google Scholar]
- Pedersen TÅ, Kowenz-Leutz E, Leutz A, and Nerlov C (2001b). Cooperation between C/EBPα TBP/TFIIB and SWI/SNF recruiting domains is required for adipocyte differentiation. Genes & Development 15, 3208–3216. [DOI] [PMC free article] [PubMed] [Google Scholar]
- Powers MP, Wang WL, Hernandez VS, Patel KS, Lev DC, Lazar AJ, and López-Terrada DH (2010). Detection of myxoid liposarcoma-associated FUS::DDIT3 rearrangement variants including a newly identified breakpoint using an optimized RT-PCR assay. Mod Pathol 23, 1307–1315. [DOI] [PubMed] [Google Scholar]
- Priam P, Krasteva V, Rousseau P, D'Angelo G, Gaboury L, Sauvageau G, and Lessard JA (2017). SMARCD2 subunit of SWI/SNF chromatin-remodeling complexes mediates granulopoiesis through a CEBPɛ dependent mechanism. Nat Genet 49, 753–764. [DOI] [PubMed] [Google Scholar]
- Rabbitts TH (1994). Chromosomal translocations in human cancer. Nature 372, 143–149. [DOI] [PubMed] [Google Scholar]
- Rabbitts TH, Forster A, Larson R, and Nathan P (1993). Fusion of the dominant negative transcription regulator CHOP with a novel gene FUS by translocation t(12;16) in malignant liposarcoma. Nat Genet 4, 175–180. [DOI] [PubMed] [Google Scholar]
- Rancoule C, Dusaulcy R, Tréguer K, Grès S, Guigné C, Quilliot D, Valet P, and Saulnier-Blache JS (2012). Depot-specific regulation of autotaxin with obesity in human adipose tissue. J Physiol Biochem 68, 635–644. [DOI] [PubMed] [Google Scholar]
- Reue K (2007). The role of lipin 1 in adipogenesis and lipid metabolism. Novartis Found Symp 286, 58–68; discussion 68–71, 162–163, 196–203. [DOI] [PubMed] [Google Scholar]
- Riggi N, Cironi L, Suvà ML, and Stamenkovic I (2007). Sarcomas: genetics, signalling, and cellular origins. Part 1: The fellowship of TET. J Pathol 213, 4–20. [DOI] [PubMed] [Google Scholar]
- Riggi N, Knoechel B, Gillespie Shawn M., Rheinbay E, Boulay G, Suvà Mario L., Rossetti Nikki E., Boonseng Wannaporn E., Oksuz O, Cook Edward B., et al. (2014). EWS::FLI1 Utilizes Divergent Chromatin Remodeling Mechanisms to Directly Activate or Repress Enhancer Elements in Ewing Sarcoma. Cancer Cell 26, 668–681. [DOI] [PMC free article] [PubMed] [Google Scholar]
- Ritchie ME, Phipson B, Wu D, Hu Y, Law CW, Shi W, and Smyth GK (2015). limma powers differential expression analyses for RNA-sequencing and microarray studies. Nucleic Acids Res 43, e47. [DOI] [PMC free article] [PubMed] [Google Scholar]
- Robinson MD, McCarthy DJ, and Smyth GK (2010). edgeR: a Bioconductor package for differential expression analysis of digital gene expression data. Bioinformatics 26, 139–140. [DOI] [PMC free article] [PubMed] [Google Scholar]
- Ron D (1997). TLS-CHOP and the role of RNA-binding proteins in oncogenic transformation. Curr Top Microbiol Immunol 220, 131–142. [DOI] [PubMed] [Google Scholar]
- Ron D, and Habener JF (1992). CHOP, a novel developmentally regulated nuclear protein that dimerizes with transcription factors C/EBP and LAP and functions as a dominant-negative inhibitor of gene transcription. Genes Dev 6, 439–453. [DOI] [PubMed] [Google Scholar]
- Rosen ED, Sarraf P, Troy AE, Bradwin G, Moore K, Milstone DS, Spiegelman BM, and Mortensen RM (1999). PPAR gamma is required for the differentiation of adipose tissue in vivo and in vitro. Mol Cell 4, 611–617. [DOI] [PubMed] [Google Scholar]
- Salma N, Xiao H, Mueller E, and Imbalzano AN (2004). Temporal recruitment of transcription factors and SWI/SNF chromatin-remodeling enzymes during adipogenic induction of the peroxisome proliferator-activated receptor gamma nuclear hormone receptor. Mol Cell Biol 24, 4651–4663. [DOI] [PMC free article] [PubMed] [Google Scholar]
- Schaefer IM, and Hornick JL (2021). SWI/SNF complex-deficient soft tissue neoplasms: An update. Semin Diagn Pathol 38, 222–231. [DOI] [PMC free article] [PubMed] [Google Scholar]
- Schep AN, Wu B, Buenrostro JD, and Greenleaf WJ (2017). chromVAR: inferring transcription-factor-associated accessibility from single-cell epigenomic data. Nat Methods 14, 975–978. [DOI] [PMC free article] [PubMed] [Google Scholar]
- Schwartz JC, Cech TR, and Parker RR (2015). Biochemical Properties and Biological Functions of FET Proteins. Annu Rev Biochem 84, 355–379. [DOI] [PMC free article] [PubMed] [Google Scholar]
- Shashikant T, and Ettensohn CA (2019). Genome-wide analysis of chromatin accessibility using ATAC-seq. Methods Cell Biol 151, 219–235. [DOI] [PMC free article] [PubMed] [Google Scholar]
- Sheffield NC, and Bock C (2016). LOLA: enrichment analysis for genomic region sets and regulatory elements in R and Bioconductor. Bioinformatics 32, 587–589. [DOI] [PMC free article] [PubMed] [Google Scholar]
- Skene PJ, Henikoff JG, and Henikoff S (2018). Targeted in situ genome-wide profiling with high efficiency for low cell numbers. Nature Protocols 13, 1006–1019. [DOI] [PubMed] [Google Scholar]
- Slenter DN, Kutmon M, Hanspers K, Riutta A, Windsor J, Nunes N, Mélius J, Cirillo E, Coort SL, Digles D, et al. (2018). WikiPathways: a multifaceted pathway database bridging metabolomics to other omics research. Nucleic Acids Res 46, D661–d667. [DOI] [PMC free article] [PubMed] [Google Scholar]
- Smith S, Reeves BR, Wong L, and Fisher C (1987). A consistent chromosome translocation in synovial sarcoma. Cancer Genet Cytogenet 26, 179–180. [DOI] [PubMed] [Google Scholar]
- Subramanian A, Tamayo P, Mootha VK, Mukherjee S, Ebert BL, Gillette MA, Paulovich A, Pomeroy SL, Golub TR, Lander ES, et al. (2005). Gene set enrichment analysis: a knowledge-based approach for interpreting genome-wide expression profiles. Proc Natl Acad Sci U S A 102, 15545–15550. [DOI] [PMC free article] [PubMed] [Google Scholar]
- Tanaka T, Yoshida N, Kishimoto T, and Akira S (1997). Defective adipocyte differentiation in mice lacking the C/EBPbeta and/or C/EBPdelta gene. Embo j 16, 7432–7443. [DOI] [PMC free article] [PubMed] [Google Scholar]
- Tang QQ, and Lane MD (2000). Role of C/EBP homologous protein (CHOP-10) in the programmed activation of CCAAT/enhancer-binding protein-beta during adipogenesis. Proc Natl Acad Sci U S A 97, 12446–12450. [DOI] [PMC free article] [PubMed] [Google Scholar]
- Tang QQ, Otto TC, and Lane MD (2003). CCAAT/enhancer-binding protein beta is required for mitotic clonal expansion during adipogenesis. Proc Natl Acad Sci U S A 100, 850–855. [DOI] [PMC free article] [PubMed] [Google Scholar]
- Tsukada J, Yoshida Y, Kominato Y, and Auron PE (2011). The CCAAT/enhancer (C/EBP) family of basic-leucine zipper (bZIP) transcription factors is a multifaceted highly-regulated system for gene regulation. Cytokine 54, 6–19. [DOI] [PubMed] [Google Scholar]
- Ubeda M, Wang XZ, Zinszner H, Wu I, Habener JF, and Ron D (1996). Stress-induced binding of the transcriptional factor CHOP to a novel DNA control element. Mol Cell Biol 16, 1479–1489. [DOI] [PMC free article] [PubMed] [Google Scholar]
- Wang ND, Finegold MJ, Bradley A, Ou CN, Abdelsayed SV, Wilde MD, Taylor LR, Wilson DR, and Darlington GJ (1995). Impaired energy homeostasis in C/EBP alpha knockout mice. Science 269, 1108–1112. [DOI] [PubMed] [Google Scholar]
- Wang X, Lee RS, Alver BH, Haswell JR, Wang S, Mieczkowski J, Drier Y, Gillespie SM, Archer TC, Wu JN, et al. (2017). SMARCB1-mediated SWI/SNF complex function is essential for enhancer regulation. Nat Genet 49, 289–295. [DOI] [PMC free article] [PubMed] [Google Scholar]
- Willeke F, Assad A, Findeisen P, Schromm E, Grobholz R, von Gerstenbergk B, Mantovani A, Peri S, Friess HH, Post S, et al. (2006). Overexpression of a member of the pentraxin family (PTX3) in human soft tissue liposarcoma. Eur J Cancer 42, 2639–2646. [DOI] [PubMed] [Google Scholar]
- Yang X, Nagasaki K, Egawa S, Maruyama K, Futami H, Tsukada T, Yokoyama R, Beppu Y, Fukuma H, Shimoda T, et al. (1995). FUS/TLS-CHOP chimeric transcripts in liposarcoma tissues. Jpn J Clin Oncol 25, 234–239. [PubMed] [Google Scholar]
- Zhang Y, Liu T, Meyer CA, Eeckhoute J, Johnson DS, Bernstein BE, Nusbaum C, Myers RM, Brown M, Li W, et al. (2008). Model-based analysis of ChIP-Seq (MACS). Genome Biol 9, R137. [DOI] [PMC free article] [PubMed] [Google Scholar]
- Zhou Y, Zhou B, Pache L, Chang M, Khodabakhshi AH, Tanaseichuk O, Benner C, and Chanda SK (2019). Metascape provides a biologist-oriented resource for the analysis of systems-level datasets. Nat Commun 10, 1523. [DOI] [PMC free article] [PubMed] [Google Scholar]
- Zhu Q, Liu N, Orkin SH, and Yuan GC (2019). CUT&RUNTools: a flexible pipeline for CUT&RUN processing and footprint analysis. Genome Biol 20, 192. [DOI] [PMC free article] [PubMed] [Google Scholar]
- Zinszner H, Albalat R, and Ron D (1994). A novel effector domain from the RNA-binding protein TLS or EWS is required for oncogenic transformation by CHOP. Genes Dev 8, 2513–2526. [DOI] [PubMed] [Google Scholar]
Associated Data
This section collects any data citations, data availability statements, or supplementary materials included in this article.
Supplementary Materials
Table S1. Patient and tumor information for MLPS and other sarcoma samples used in RNA-seq analyses, Related to Figures 3, 5. Patient and tumor information for all MLPS, DSCRT, Ewing Sarcoma, extraskeletal myxoid chondrosarcoma, and low-grade fibromyxoid sarcoma primary tumors profiled using RNA-seq.
Data Availability Statement
Genomics data (ChIP-seq, Cut&Run, ATAC-seq, and RNA-seq) have been deposited at GEO under accession number GSE179720 and are publicly available as of the date of publication. Accession numbers are listed in the key resources table. Original western blot images have been deposited at Mendeley and are publicly available as of the date of publication. The DOIs are listed in the key resources table.
No original code was generated for this study.
Any additional information required to reanalyze the data reported in this paper is available from the lead contact upon request.
KEY RESOURCES TABLE
| REAGENT or RESOURCE | SOURCE | IDENTIFIER |
|---|---|---|
| Antibodies | ||
| Mouse Anti-SMARCA4 (BRG1) (G-7) (IB, IHC) | Santa Cruz | Cat# sc-17796 |
| Rabbit Anti-SMARCA4 (BRG1) (D1Q7F) (IP, IHC) | Cell Signaling Technology | Cat# 49360 |
| Rabbit Anti-SMARCA4 (BRG1) (EPNCIR111A) (C&R) | Abcam | Cat# ab110641 |
| Rabbit Anti-SMARCC1 (BAF155) (D7F8S) (IB, ChIP) | Cell Signaling Technology | Cat# 11956 |
| Mouse Anti-INI1 (BAF47) (A-5) (IB) | Santa Cruz | Cat# sc-166165 |
| Rabbit Anti-H3K27ac (ChIP) | Abcam | Cat# ab4729 |
| Rabbit Anti-IgG (IP) | Cell Signaling Technology | Cat# 2729 |
| Mouse Anti-CEBPB (H-7) (IB, IHC) | Santa Cruz | Cat# sc-7962 |
| Rabbit Anti-CEBPB (IP, ChIP, C&R, IHC) | Thermo Scientific | Cat# PA5-27244 |
| Rabbit Anti-DDIT3 (CHOP) (IP, ChIP, IB, IHC) | Proteintech | Cat# 15204-1-AP |
| Rabbit anti-HA-Tag (C29F4) (IP) | Cell Signaling Technology | Cat# 3724 |
| Mouse anti-HA-Tag (F-7) (IB) | Santa Cruz | Cat# sc-7392 |
| Rabbit anti-V5 (D3H8Q) (IP) | Cell Signaling Technology | Cat# 13202 |
| Mouse anti-V5 (IB) | Thermo Scientific | Cat# R96025 |
| Biological samples | ||
| Primary Tumor Samples | MD Anderson | N/A |
| Human myxoid liposarcoma FFPE slides | MD Anderson | N/A |
| Human myxoid liposarcoma tissue microarray | MD Anderson | N/A |
| Chemicals, peptides, and recombinant proteins | ||
| Puromycin | Sigma Aldrich | Cat# P8833-25MG |
| Dimethyl sulfoxide | Sigma Aldrich | Cat# D2650 |
| CMP12 | Courtesy of Jun Qi | N/A |
| DMEM, high glucose, no glutamine | Life Technologies | Cat# 11960-069 |
| RPMI, no glutamine | Life Technologies | Cat# 21870-092 |
| PBS, 7.4 | Life Technologies | Cat# 10010-049 |
| Penicillin-Streptomycin (10,000 U/mL) | Life Technologies | Cat# 15140-163 |
| GlutaMAX Supplement | Life Technologies | Cat# 35050-079 |
| Sodium Pyruvate (100mM) | Life Technologies | Cat# 11360-070 |
| HEPES (1M) | Life Technologies | Cat# 15630130 |
| MEM non-essential amino acids | Life Technologies | Cat# 11140050 |
| Trypsin-EDTA (0.25%), phenol red | Life Technologies | Cat# 25200-114 |
| TrypLE Exrpress Enzyme (1X), no phenol red | Thermo Fisher Scientific | Cat# 12-604-021 |
| Mesenchymal Stem Cell Basal Medium for Adipose, Umbilical and Bone Marrow-derived MSCs | ATCC | Cat# PCS-500-030 |
| Mesenchymal Stem Cell Growth Kit for Adipose and Umbilical-derived MSCs - Low Serum | ATCC | Cat# PCS-500-040 |
| StemPro Adipogenesis Differentiation Kit | Thermo Fisher Scientific | Cat# A1007001 |
| Polyethylenimine (PEI) (MW 40,000) | Polysciences | Cat#24765 |
| Polybrene | Santa Cruz Biotechnology | Cat#sc-134220 |
| Goat Anti-Mouse IgG Antibody, IRDye 680RD Conjugated | LI-COR Biosciences | Cat#926-68070 |
| Goat Anti-Rabbit IgG Antibody, IRDye 800CW Conjugated | LI-COR Biosciences | Cat#926-32211 |
| Dynabeads Protein G | Thermo Fisher Scientific | Cat#10004D |
| NuPage LDS Sample Buffer (4X) | Life Technologies | Cat#NP0007 |
| Formaldehyde | Sigma-Aldrich | Cat#F8775 |
| Glycine | Sigma-Aldrich | Cat#G7126 |
| RNase | Thermo Fisher Scientific | Cat# EN0531 |
| Proteinase K | Thermo Fisher Scientific | Cat# AM2546 |
| Agencourt AMPure XP | Beckman Coulter | Cat#A63882 |
| Critical commercial assays | ||
| NEBNext Ultra II DNA Library Prep with Sample Purification Beads | New England Biolabs | Cat# E7103 |
| RNeasy Mini Kit | Qiagen | Cat# 74106 |
| NEBNext Poly(A) mRNA Magnetic Isolation Module | New England Biolabs | Cat# E7490 |
| NEBNext Ultra II Directional RNA Library Prep Kit for Illumina | New England Biolabs | Cat# E7660 |
| Illumina Tagment DNA Enzyme and Buffer | Illumina | Cat# 20034198 |
| Deposited data | ||
| ChIP-seq, RNA-seq, and ATAC-seq from cell lines | This study | GEO: GSE179720 |
| RNA-seq of deidentified tumor samples | This study | GEO: GSE179720 |
| RNA-seq of BAF complex-perturbed cancers | Le Loarer et al., 2015 | GEO: SRP052896 |
| Experimental models: Cell lines | ||
| HEK293T LentiX | Clontech | Cat#632180 |
| MLPS-1765-92 | Aman et al., 1992 | RRID:CVCL_S817 |
| MLPS-402-91 | Aman et al., 1992 | RRID:CVCL_S813 |
| MLPS-DL221 | Graaf et al., 2016 | RRID:CVCL_DQ91 |
| ASC52telo, hTERT immortalized adipose derived Mesenchymal stem cells | ATCC | Cat# SCRC-4000 |
| Adipose-Derived Mesenchymal Stem Cells; Normal, Human | ATCC | Cat# PCS-500-011 |
| Oligonucleotides | ||
| shSCR (non-silencing shRNA construct) 5’-CTTACTCTCGCCCAAGCGAGA-3’ | Dharmacon | RHS4346 |
| shDDIT3 5’-CGATTTCCTGCTTGAGCCG-3’ | Dharmacon | RHS4430-200227707 (V3LHS_643408) |
| shBRG1 5’-TCTCTAGGTCGTTGAGGCT-3’ | Dharmacon | RHS4430-200242720 (V3LHS_317182) |
| Recombinant DNA | ||
| Ini1 (BAF47) CRISPR/Cas9 KO Plasmid | Santa Cruz | Cat# sc-401485 |
| EF-1a-MCS-PGK-Blast-EMPTY | Kadoch & Crabtree, 2013 | N/A |
| EF-1a-MCS-PGK-Blast-FUS::DDIT3-HA | Kadoch & Crabtree, 2013 | N/A |
| EF-1a-MCS-PGK-Blast-CEBPB-V5 | Kadoch & Crabtree, 2013 | N/A |
| EF-1a-MCS-PGK-Blast-CEBPB-Ndel20-V5 | Kadoch & Crabtree, 2013 | N/A |
| EF-1a-MCS-PGK-Blast-CEBPB-Ndel40-V5 | Kadoch & Crabtree, 2013 | N/A |
| EF-1a-MCS-PGK-Blast-CEBPB-RLWDmut-V5 | Kadoch & Crabtree, 2013 | N/A |
| EF-1a-MCS-PGK-Blast-DDIT3-HA | Kadoch & Crabtree, 2013 | N/A |
| EF-1a-MCS-PGK-Blast-DDIT3-Ndel10-HA | Kadoch & Crabtree, 2013 | N/A |
| EF-1a-MCS-PGK-Blast-DDIT3-Ndel20-HA | Kadoch & Crabtree, 2013 | N/A |
| EF-1a-MCS-PGK-Blast-DDIT3-WEmut-HA | Kadoch & Crabtree, 2013 | N/A |
| EF-1a-MCS-PGK-Blast-DDIT3-TLWEmut-HA | Kadoch & Crabtree, 2013 | N/A |
| EF-1a-MCS-PGK-Puro-EMPTY | Kadoch & Crabtree, 2013 | N/A |
| EF-1a-MCS-PGK-Puro-FUS::DDIT3-HA | Kadoch & Crabtree, 2013 | N/A |
| Software and algorithms | ||
| Bowtie2 | Langmead and Salzberg, 2012 | http://bowtie-bio.sourceforge.net/bowtie2/index.shtml |
| STAR | Dobin et al., 2013 | https://github.com/alexdobin/STAR |
| MACS2 | Zhang et al., 2008 | https://github.com/taoliu/MACS |
| ngsplot | Shen et al., 2014 | https://github.com/shenlab-sinai/ngsplot |
| EdgeR | Robinson et al., 2010 | https://bioconductor.org/packages/release/bioc/html/edgeR.html |
| GSEA | Subramanian et al., 2005 | http://software.broadistitute.org/gsea/index.jsp |
| Bedtools | Quinlan and Hall, 2010 | http://bedtools.readthedocs.io/en/latest/ |
| Samtools | Li et al., 2009 | http://samtools.sourceforge.net/ |
| Picard | Broad Institute | http://broadinstitute.github.io/picard |
| Trimmomatic | Bolger et al., 2014 | http://www.usadellab.org/cms/?page=trimmomatic |
| Gene Ontology | Gene Ontology Consortium, 2015 | http://geneontology.org/ |
| BWA-MEM | Li, 2013 | bio-bwa.sourceforge.net/ |
| Matplotlib | Hunter, 2007 | https://matplotlib.org/stable/ |
| Seaborn | Michael Waskom | https://seaborn.pydata.org/ |
| Other | ||