



Abstract
Background:
Secretory immunoglobulin A (sIgA) plays an important role in antiviral protective immunity. Although salivary testing has been used for many viral infections, including severe acute respiratory syndrome (SARS) and Middle East Respiratory Syndrome (MERS), its use has not yet been well established with the SARS coronavirus 2 (SARS-CoV-2). Quantification of salivary IgA and IgG antibodies can elucidate mucosal and systemic immune responses after natural infection or vaccination. Here, we report the development and validation of a rapid enzyme-linked immunosorbent assay (ELISA) for anti–SARS-CoV-2 salivary IgA and serum IgG antibodies, and present quantitative results for immunized subjects both prior to or following COVID-19 infections.
Objective:
Total and serum SARS-CoV-2 spike–specific IgG responses were compared with salivary spike–specific IgA and IgG responses in samples obtained from patients recently infected with SARS-CoV-2 and from subjects recently immunized with COVID-19 vaccines.
Methods:
A total of 52 paired saliva and serum samples were collected from 26 study participants: 7 subjects after COVID-19 infection and 19 subjects who were uninfected. The ELISA results from these samples were compared with five prepandemic control serum samples. Total IgG and SARS-CoV-2 spike–specific IgG in the serum samples from the subjects who were infected and vaccinated were also measured in a commercial laboratory with an enzyme immunoassay.
Results:
A wide variation in antibody responses was seen in salivary and serum samples measured by both methods. Three groups of serum total and IgG spike–specific SARS-CoV-2 antibody responses were observed: (1) low, (2) intermediate, and (3) high antibody responders. A correlational analysis of salivary IgA (sIgA) responses with serum IgG concentrations showed a statistical correlation in the low and intermediate antibody responder groups but not in the high group (which we believe was a result of saturation).
Conclusion:
These preliminary findings suggest measuring salivary and serum IgG and IgA merit further investigation as markers of current or recent SARS-CoV-2 infections.
Keywords: SARS-CoV-2 virus, COVID-19, Spike protein, serum, saliva, PF= BNT162b2 (Pfizer-BioNTech) vaccine, Mod= mRNA-1273 (Moderna) vaccine
Secretory immunoglobulin A (sIgA), in mucosal secretions has been shown to play a major role in early defenses against respiratory infections, particularly those caused by viral pathogens.1,2 Our group was among the first to characterize viral neutralizing antibodies in human serum and to identify the importance of sIgA in nasal secretions as a predictive marker of protective immunity to several respiratory infections.3–9 Studies more relevant to coronavirus disease 2019 (COVID-19) today are those that were performed in volunteers inoculated intranasally with the common cold virus (coronavirus 229E) at the Common Cold Research Unit in the United Kingdom, where responses were monitored by antibody rises, symptomatology, and virus excretion.10 Although both circulating and nasal wash antibodies in these studies were associated with protection from infection and disease, only specific IgA antibodies in nasal secretions seemed to shorten the period of virus shedding.10
Testing of sIgA in saliva, a more convenient way to quantify sIgA than by measurement in nasal secretions, has been evaluated in several recent studies11–18 to characterize mucosal immune responses to many viral infections, including those caused by severe acute respiratory syndrome coronavirus 2 (SARS-CoV-2). However, the effectiveness of salivary testing has not yet been fully characterized in the COVID-19 pandemic. If achieved, quantification of IgA and IgG antibodies in saliva would not only permit a better understanding of mucosal and systemic immune responses after natural COVID-19 infection or immunization with COVID-19 vaccines but could also offer a more cost-effective, noninvasive tool with ease of saliva collection for the diagnosis and management of patients with COVID-19 disease. Here, we report the development of a rapid immunoassay for measuring SARS-CoV-2 IgA and IgG antibodies against SARS-CoV-2 in serum and saliva, and describe some clinically relevant correlations of findings obtained from subjects after infection with COVID-19 as well as from pre-COVID-19 and post-COVID-19 vaccine immunized subjects.
METHODS
Clinical Subjects and Sample Collection
The human research protocol for the study was approved by the Georgetown University Institutional Review Board. From April 19, 2021, to December 17, 2021, a total of 52 paired saliva and serum samples were collected from 26 study participants, ranging in age from 14 to 87 years; 11 were males (mean age, 51 years) and 15 were female (mean age, 49 years) (Table 1). Five additional pre-COVID-19 pandemic COVID-19 serum samples (collected in 2017) were purchased from Precision for Medicine, Norton, MA, and were included as non-SARS-CoV-2 controls. Of the seven participants who contracted COVID-19 (subject nos. 1–1, 10-1, 13–1,14-1.16-1,17-1,18-1), salivary and serum samples were available from two participants (before immunization with COVID-19 vaccines (subject nos. 1–1 and 18–1) (Table 2). All the study subjects were healthy and free of infection with the exception of study subject no. 3–1 who was diagnosed with common variable immune deficiency. After obtaining informed consent, 10 mL of blood and 5 mL of saliva were obtained from each study subject. Serum samples were obtained from supernatants after centrifugation at 2000 rpm for 20 minutes. Saliva samples were processed according to methods described by Henson et al.19 Briefly, specimens were vortexed rapidly for 1–2 minutes and clarified by centrifugation at 10,000 rpm. Serum and saliva samples were stored at –80°C and were heat inactivated at 56°C for 1 hour before analysis.
Table 1.
Salivary and serum antibody responses in total study group


ELISA = Enzyme-linked immunosorbent assay; COVID-19 = coronavirus disease 2019; IgG = immunoglobulin G; sIgA = salivary IgA; sIgG = salivary IgG; S-IgA = serum IgA; S-IgG = serum IgG; COVINF = COVID-19 infection; Pfi no. 1 = receipt of 1st Pfizer vaccine; Pfi no. 2 = receipt of 2nd Pfizer vaccine; Pfi no. 3 = receipt of 1st booster Pfizer vaccine; Mod no. 1 = receipt of 1st Moderna vaccine; Mod no. 2 = receipt of 2nd Moderna vaccine; Mod no. 3 = receipt of 1st booster Moderna vaccine; XX = not tested.
Table 2.
Salivary and serum antibody responses in seven study subjects after COVID-19 infection

ELISA = Enzyme-linked immunosorbent assay; COVID-19 = coronavirus disease 2019; IgG = immunoglobulin G; sIgA = salivary IgA; sIgG =; S-IgA = serum IgA; S-IgG = serum IgG; COVINF = COVID-19 infection; Pfi no. 1 = receipt of 1st Pfizer vaccine; Pfi no. 2 = receipt of 2nd Pfizer vaccine; Pfi no. 3 = receipt of 1st booster Pfizer vaccine; Mod no. 1 = receipt of 1st Moderna vaccine; Mod no. 2 = receipt of 2nd Moderna vaccine; Mod no. 3 = receipt of 1st booster Moderna vaccine; XX = not tested.
Study Design
The overall intent of this study design was to determine if the IgG and IgA salivary antibodies that target SARS-CoV-2 spike protein S1 in both saliva and serum could provide a surrogate method not only for the measurement of serum antibody responses that result from COVID-19 infection as well as those responses after immunization with COVID-19 vaccines. In approaching these possibilities, a series of analyses were performed that examined if there were varying degrees of immunologic reactivity in humans that could stratify immune responses into high, intermediate, and low responders by using both the commercially available serum assays that measure total and IgG anti-spike antibody as well as the in-house developed enzyme immunoassay (EIA) salivary immunoassays that measure IgG and IgA antibodies in saliva and in serum.
A definitive concordant agreement of salivary IgA with serum IgG antibody directed against SARS-CoV-2 has not been achieved for two reasons. First, a commercial EIA for sIgA measurement is not currently available; second, the measurement of serum antibody by using commercial EIAs is semiquantitative. An enzyme-linked immunosorbent assay (ELISA), therefore, was developed in our laboratory designed to quantitatively measure IgA and IgG antibody responses to the spike (S1) antigen in both serum and saliva, which could be compared with two commercially available total and IgG specific anti-spike antibody assays performed at Quest Laboratories (Secaucus, NJ).
Commercial SARS-CoV-2 Spike Protein Receptor Binding Domain Total and IgG Antibody Assays
The commercially available U.S. Food and Drug Administration Emergency Use Authorized SARS-CoV-2 anti-spike receptor binding domain semiquantitative chemiluminescent antibody assays used in the present study included (1) the Siemens (Siemens Healthcare Diagnostics, Tarrytown, NY) ADVIA Centaur Anti-SARS-CoV-2 immunoassay, which measures IgG antibody,20 and (2) the Roche (Roche Diagnostics, Indianapolis, IN) Elecsys Anti-SARS-CoV-2 S immunoassay, which measures total antibody.21 These assays were performed at Quest Diagnostics (Quest Diagnostics, Secaucus, NJ). Both immunoassays use the Quanterix (Quanterix Corporation, Billerica, MA) HD-X immunoassay system to provide a semiquantitative result by using a three-step paramagnetic microbead–based sandwich ELISA. In brief, the COVID-19 spike protein was coated onto paramagnetic capture beads. Biotinylated antihuman IgG detects the SARS-CoV-2 spike antibodies, and streptavidin-ß-galactosidase hydrolyzes the substrate solution into a fluorescent product that provides the signal for measurement. Samples that produced a chemiluminescent signal above an assay cutoff threshold were classified as positive for SARS-CoV-2 antibody. Such positive antibody results indicate that the person has a potential anti–SARS-CoV-2 spike immune response to a recent or previous SARS-CoV-2 infection or after immunization with a spike protein–based COVID-19 vaccine. These assay results are not intended for use to confirm immunity to SARS-CoV-2 infection.
Laboratory-Developed ELISA SARS-CoV-2 Assay for Detecting IgG and IgA Antibodies to the Spike Antigens
A quantitative ELISA was developed in our laboratory to measure IgA and IgG antibody concentrations in response to spike protein 1 (ABClonal catalog RP01261) (ABclonal Technology, Woburn, MA) in both saliva and serum samples. Briefly, 96-well plates (Fisher) (Thermo Fisher Scientific, Waltham, MA USA) were coated with 100 μL of spike protein 1 (2 μg/mL) (ABClonal). A purified anti–spike protein IgG (2 mg/mL [ABClonal] in 50 mM carbonate buffer [pH 9.5]) was added, and the plates were incubated at 4°C overnight to establish a standard curve for the determination of IgG and IgA concentrations. Excess antigens were removed by washing the plates three times with phosphate-buffered saline (PBS) solution (pH 7.2; Rockland MB-008) (Rockland, Inc, Pottstown, PA). An aliquot of 300 μL of 3% (w/v) Fish Gel solution in PBS solution (Rockland MB066-0100) was added into each well to allow blocking for 1 hour at room temperature. After washing three times with PBS solution, 100 μL aliquots of serial dilutions of heat-inactivated serum and saliva samples were added into individual wells at room temperature for 1 hour to permit binding with the spike protein antigen.
All dilutions for salivary and serum samples and subsequent enzyme-conjugated secondary antibodies were prepared in 1% Fish Gel. Before the second antibody reaction, unbound antibodies in serum and saliva samples were washed an additional three times with 0.05% (v/v) NP40 PBS solution. Optimal dilutions of 100 μL of horseradish peroxidase–conjugated goat antihuman IgG (1:10000; ABCAM no. 6858) (ABCAM, Waltham, MA) and horseradish peroxidase–conjugated goat antihuman IgA (1:5000; ABCAM no. 97215) were loaded into each well and incubated at room temperature for 30 minutes. After removing the second antibodies and washing with 0.05% (v/v) NP40 PBS solution, 100 μL of 1-step Turbo TMB (Thermo Scientific) were added. After 30 minutes of incubation at room temperature, absorbance was read by a microplate reader (Dynex Technologies, Chantilly, VA) at 620 nm. For a control, wells without serum and saliva but with goat antihuman IgA and goat antihuman IgG were treated as IgA and IgG baselines in each testing plate.
The optical density (OD) values for IgA measurement were adjusted by subtracting the OD reading of tested samples from the IgA baseline OD and the IgG measurements from the IgG baseline OD. The adjusted OD values were then plotted against the standard curve to calculate the concentration of IgG and IgA expressed in μg/mL. To minimize antibody variance of salivary samples, the concentrations of IgG and IgA antibodies were normalized by the total protein levels of serum and saliva in each sample, and the final results were expressed as μg/mL/mg protein. The protein measurements were performed by NanoDrop spectrophotometer (Thermo Scientific) methodology.
Statistical Analyses
The correlation between the two variable groups was analyzed by Pearson r, and statistical significance was determined by a two-tailed test by using GraphPad Prism 7 (GraphPad Software, San Diego, CA). Statistically significant differences between the mean values of each group were analyzed by using the t-test or one-way analysis of variance, followed by the Bonferroni multiple comparison tests by using GraphPad Prism 7. A p value of <0.05 was considered statistically significant. A linear regression model was used to assess the degree of variability of the data set and the strength of the relationship between the measurement of the IgG concentration by spectrophotometric analysis. A regression coefficient (R2) > 0.7 was considered reliable.
RESULTS
In Table 1 are the results of the total anti–SARS-CoV-2 antibody responses determined in 52 paired saliva and serum samples collected from 26 subjects, which showed the serum total and IgG anti-spike antibody responses determined by commercial EIAs compared with SARS-CoV-2–specific serum and salivary IgA and IgG determined by our laboratory-developed ELISA.
Results of Commercial Serum Assays that Measured Total and IgG Anti-Spike Antibody
Shown in Fig. 1 are the semiquantitative results of serum total and IgG spike–specific antibody responses performed by a commercially available SARS-CoV-2 EIA. Analysis of these results revealed three groups of antibody responses: (1) low, (2) intermediate, and (3) high. The cutoff points for the low group's total antibody levels ranged from 0 to 600 μg/mL and, for the IgG, ranged from 0 to 5 μg/mL; the cutoff points for the intermediate group's total antibody levels ranged from 601 to 2000 μg/mL and, for the IgG, ranged from 5 to 17 μg; the cutoff points for the high group total antibody levels ranged from 2001 to >2500 μg/mL and, for the IgG, ranged from 17.1 to >20 μg/mL.
Figure 1.

Three groups of serum total and IgG SARS-CoV-2 spike antibody responses were observed by SARS-CoV-2; total antibody, spike, semiquantitative method (left, y-axis) or SARS-CoV-2 antibody (IgG), spike, semiquantitative spike-specific method (right, y-axis): (1) low, (2) intermediate, and (3) high. The cutoff points for the low group's total ab value ranged from 0 to 600 μg/mL and, for the IgG level, from 0 to 5 μg/mL; the cutoff points for the intermediate group's total ab value ranged from 601 to 2000 μg/mL and, for the IgG level, from 5 μg/mL to 17 μg; the cutoff points for the high group's total ab value ranged from 2001 to >2500 μg/mL and, for the IgG level, from 17.1 to >20 μg/mL. IgG = Immunoglobulin G; SARS-CoV-2 = severe acute respiratory syndrome coronavirus 2; ab = antibody.
A more-specific question in the interpretation of these results was addressed by measuring the differences in the serum total and IgG spike-specific antibody responses to COVID-19 vaccines in the study subjects previously infected with SARS-CoV-2 from those immunized and without previous COVID-19 infection. Shown in Fig. 2 are the results of the total and IgG anti-spike antibody responses in subject no. 1–1, who had COVID-19 infection 5 months before receiving two doses of the BNT162b2 vaccine (Pfizer-BioNTech, New York, NY), which was compared with responses seen in subject no. 2–1, who had not been infected and had received two doses of the messenger-RNA–1273 vaccine (Moderna, Moderna, Inc., Cambridge, Massachusetts). Although postinfection levels of total and IgG anti-spike antibody responses in subject no. 1–1 had fallen to 209.1 μg/mL and 2.1 μg/mL, respectively, there was a rapid anamnestic increase in antibody titers to >2500 μg/mL and >20 μg/mL within 7 days of initial immunization in contrast to subject no. 2–1, in whom the first detectable antibody responses of 36.5 μg/mL and 9.0 μg/mL were not seen until 2 weeks after initial immunization (Fig. 2A). This figure represented an “illustrative case example” and should not be interpreted as an overall comparison of all responses to infection versus immunization because there were many other variables that could be affecting these responses, notably the different vaccines.
Figure 2.

(A) A comparison of SARS-CoV-2 total antibody (red lines) and SARS-CoV-2 spike antibody (IgG) (blue lines) after immunization with COVID-19 vaccine in subject no. 1–1 who had been infected with SARS-CoV-2 5 months previously compared with subject no. 2–1 who had not been infected. (B) A comparison of total antibody and IgG spike antibody responses in 7 subjects infected and 18 subjects vaccinated by using groups stratified by cutoff values of high, intermediate, or low for evaluation as described in the Fig. 1 legend. SARS-CoV-2 = Severe acute respiratory syndrome coronavirus 2; IgG = immunoglobulin G; COVID-19 = coronavirus disease 2019.
A more helpful analysis was to compare total and IgG anti–spike antibody responses in the two groups of subjects (vaccinated versus infection stratified by vaccine type and cutoff values of high, intermediate, and low responses for evaluation of individual responses seen in 7 subjects who had infection versus 18 available subjects who received COVID-19 vaccines). As shown in Fig. 2B and in Supplemental Table 1, it can be seen that total and IgG anti-spike antibody responses were significantly higher only in the subjects who had been previously infected with SARS-CoV-2 and then subsequently immunized with a COVID-19 vaccine but only in the high cutoff antibody group (p < 0.05).
Results of ELISA Salivary Immunoassays that Measured IgA- and IgG-Associated Antibody to Spike Targeted Antigen in Saliva and in Serum
A set of experiments was performed to determine the order of appearance of IgA and IgG associated antibody to spike-targeted antigens in serum and saliva. The quantity of each antibody isotope was calculated from a standard curve prepared with purified anti-spike IgG, which ranged from 1 to ∼10 µg/mL, as shown in Fig. 3. Shown in Figs. 4 A and B are the EIA IgA and IgG antibody responses found in saliva and serum for study subjects no. 1–1 and no. 2–1, respectively. The results in Fig. 4 A (on the left panel) compared the development of salivary IgA with the development of salivary IgG, which shows an earlier development of salivary IgG peaking at 15 days in contrast to salivary IgA, which peaks at 20 days. Similarly, in Fig. 4 B (left panel) in subject no. 2–1, the development of salivary IgG and salivary IgA began appearing at the same time point but with a peak of IgG appearing earlier, at 10 days, with a later rise in salivary IgA. In contrast, in comparing the development of serum IgG and serum IgA (Fig. 4A and Fig. 4B, right panels), the appearance of both occurred at the same time but with an earlier peak of IgA at 10 days and a later rise in serum IgG, which peaked at 25 days.
Figure 3.
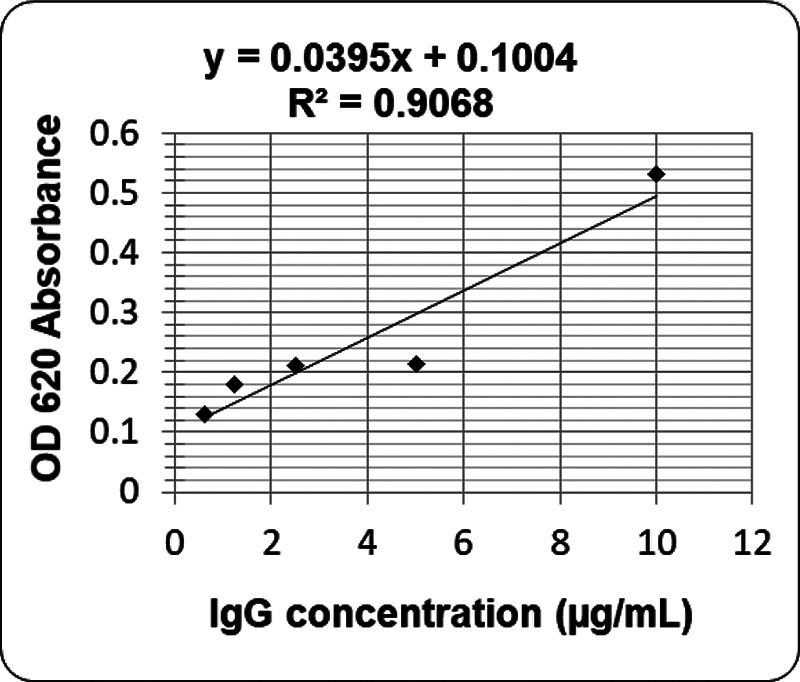
A standard curve of anti-spike IgG in ELISA. IgG = Immunoglobulin G; ELISA = enzyme-linked immunosorbent assay.
Figure 4.

EIA IgA and IgG antibody responses found in saliva and serum for study (A) subject no. 1–1 and (B) subject no. 2–1. The error bars in this and subsequent figures 5 and 6 signify SD and represent the variability in replicate measurements that were performed at discrete time points for the measurement of IgG or IgA. EIA = Enzyme immunoassay; IgA = immunoglobulin A; SD = standard deviation.
Correlational Analysis of sIgA Responses with Serum IgG Concentrations
Because of this inverse relationship of the appearance of IgA with IgG in saliva and in serum, the correlation of sIgA concentrations with serum IgG concentrations was next examined (Fig. 5). This type of nonexperimental analysis was performed to determine if a correlation existed between the two variables of sIgA concentrations with serum IgG concentrations, with little or no effort to control other extraneous variables. A correlational analysis of sIgA responses with serum IgG concentrations showed a statistical correlation in the low IgG group (panel A) and in the intermediate antibody group (panel B) (p < 0.001). In contrast, in the high IgG group (panel C), no correlation was observed (p > 0.05).
Figure 5.

The sIgA concentrations are correlated with serum IgG concentrations in the (A) low IgG and in (B) intermediate IgG groups in contrast to the (C) high IgG group, in which no correlation was found. Multiple time points were included because some subjects had multiple specimens collected for analysis. Each dot represents the average of IgG or IgA values performed in triplicate determinations ± SD. sIgA = Secretory immunoglobulin A; SD = standard deviation.
Correlational Analysis of sIgA and IgG and of Serum IgA and IgG Antibody Responses between Patients Who Are Infected and Patients Who Were Not Infected
A subsequent set of analyses was performed to determine if any statistical differences of either salivary IgA and IgG or serum IgA and IgG responses existed between individuals who were infected and individuals who were not infected and who received vaccination. Shown in Fig. 6 (panel A), there was no difference of salivary IgA between the subjects who were previously infected and the subjects who were not infected, but the salivary IgG values were higher in the infected group (p < 0.01). In contrast, when serum IgA and IgG values were analyzed, serum IgG antibody levels were equally detected in subjects who were previously infected and the subjects who were not infected, which were significantly higher than those seen in serum samples collected before the COVID-19 pandemic, with p < 0.01 and p < 0.05, as shown in Fig. 6 (panel B). Serum IgA antibody in the subjects previously infected were higher than in the prepandemic samples (p < 0.001) and the subjects who were vaccinated (p < 0.01). Analysis of our data suggests that there are similar salivary IgA and serum IgG responses in subjects who are vaccinated who were either previously infected or not infected.
Figure 6.

The different IgA and IgG responses between the subjects who were infected and the subjects who were not infected. Multiple time points were included because some subjects had multiple specimens collected for analysis. IgA = Immunoglobulin A.
DISCUSSION
We report development of a rapid EIA for measuring salivary and serum IgA and IgG antibodies against SARS-CoV-2, and we provided quantitative serum and salivary antibody results obtained both from subjects previously infected with SARS-CoV-2 as well as from subjects recently immunized with current COVID-19 vaccines. Analyses of total and IgG spike–specific serum antibody responses to CoV-2 spike protein performed in a commercial laboratory were compared with those obtained by our in-house ELISA (Table 1). The overall intent of the study was to determine if the measurement of IgG and IgA salivary antibodies that target SARS-CoV-2 spike protein S1 in both saliva and serum by using EIA could provide a more cost-effective noninvasive tool with ease of saliva collection for the diagnosis and management of patients with COVID-19 disease.
Other published studies show validity and reliability in the use of an EIA for detection and quantification of SARS-CoV-2 sIgA and IgG.11–18 The importance of stratification of serum SARS-CoV-2–specific antibody with the severity of COVID-19 disease was demonstrated in the study by Cervia et al.,11 which showed that systemic antibody production against SARS-CoV-2 mainly developed in patients with severe COVID-19 with severe acute respiratory distress syndrome, with very high serum IgA titers, whereas transient production of serum SARS-CoV-2–specific antibodies may be associated with mild disease in patients in whom mucosal SARS-CoV-2–specific IgA secretion is also seen. In the study by Costantini et al.,16 the development and validation of a highly accurate, sensitive, and specific in-house EIA effectively quantitatively assessed the presence of SARS-CoV-2–specific IgA and IgG in saliva. Similarly, the ELISA performed in the present study was shown to efficiently measure antibody responses by using a direct spike antigen binding methodology.
There were several observations made in this report not described in other studies. One of the most interesting findings was the wide range of variation in antibody responses seen in our study population. The immense diversity of the human immune system controlled by a massive array of polymorphic genes described in a recent report by Liston et al.22 underscores the variability of immune responses seen in our study subjects. Our study was also supported by two previously published reports. The study of Wei et al.23 documented a variability of the anti-spike antibody response to natural SARS-CoV-2 infection in the general population, and the report by Steensels et al.24 described the heterogeneity of antibody responses in recipients of the two U.S. FDA authorized messenger RNA vaccines.
The finding of a statistical correlation of salivary IgA (sIgA) with serum IgG antibody responses in only the low and intermediate antibody groups in which the end point antibody concentrations were available but not in the high responder group in which results were expressed only in imprecise values of >2500 may have not permitted an accurate measurement of the correlation in this group. A more-specific finding in our study was the difference in serum total and IgG spike-specific antibody responses to COVID-19 vaccines in a subject who was previously infected with SARS-CoV-2 (subject no. 1–1) from a subject immunized without previous COVID-19 infection (subject no. 2–1). The observation that IgG antibody appears first in saliva, followed by IgA and the converse of initial IgA, followed by a gradual increase in serum IgG (S-IgG) was particularly of interest and necessitates explanation. This earlier appearance of IgG was described previously.16,18
Overall, we detected SARS-CoV-2–specific IgA and IgG responses as early as 1 week after the onset of disease in subject no. 1–1 who had previously been infected 5 months earlier. The IgA positive rate continued in the specimens available for study. The more helpful analysis that compared the total and IgG antispike antibody responses in two groups of subjects (infected [7] versus non-infected [19] stratified by vaccine type and cutoff values (Fig. 2B and Supplemental Table 1) demonstrated that total and IgG anti-spike antibody responses were significantly higher only in the subjects who had been previously infected with SARS-CoV-2 and then subsequently immunized with a COVID-19 vaccine but only in the high cutoff antibody group (p < 0.05). The measurement of salivary antibody as described in this and other studies11–18 may have relevance to the measurement of nasal neutralizing antibodies to COVID-19 vaccines, as described in a recent study by Declercq et al.25 and in the development of novel COVID-19 vaccines that can be delivered by the nasal route.26
Our study had limitations. Data on the onset and severity of disease were not always available for collection. We were not able to test convalescent sera with emerging SARS-CoV-2 mutants. Other reports have shown some cross-reactivity with SARS-CoV-2 mutants, but a recent article by Cao et al.27 suggests that the omicron mutant may escape the majority of existing SARS-CoV-2 neutralizing antibodies. The data, that, when analyzed showed differences in serum total and IgG spike-specific antibody responses to COVID-19 vaccines in a subject who was previously SARS-CoV-2 infected (subject no. 1–1) from a subject immunized without previous COVID-19 infection (subject no. 2–1), came from only two individuals. This finding should be confirmed in a larger group of subjects. Other limitations of the study included a small sample size, a lack of longitudinal data and follow-up on many patients, the use of mixed vaccines, and other patient factors that may affect responses to vaccine and/or infection as well as other risk factors, such as immune compromise and obesity. Another limitation of the study was the use of commercial assays that measure IgG and total SARS-CoV-2 antibody as a “reference standard.” As described previously, although these serologic tests were used to compare serum and salivary antibody responses by using a SARS-CoV-2 spike EIA developed in our laboratory, these commercial assays are not considered stringent reference standards and, therefore, cannot be used for confirming that immunity to COVID infection exists either via previous infection or in response to a vaccine.28–30
CONCLUSION
We developed an EIA that can detect SARS-CoV-2–specific IgA and IgG antibodies in saliva and serum, which correlated well with commercial assays. Significant fluctuations of salivary IgA and IgG antibody levels were observed after infection or immunization with COVID-19 vaccines. Mucosal immunity, including sIgA, plays an important role in host defense against respiratory pathogens, and analysis of our earlier data with nasal antibody suggests that salivary IgA may also be significant in protective immunity to COVID-19. The noninvasive nature and ease of saliva collection facilitate its potential use as a predictive marker of protective immunity after infection or immunization with COVID-19 vaccines and lend further support for continued study.
ACKNOWLEDGMENT
The authors wish to acknowledge the valuable scientific consultative contributions of Dr. William A. Meyer III, Technical Director at Quest Diagnostics, in the preparation of this report.
Footnotes
No external funding sources reported
The authors have no conflicts of interest to declare pertaining to this article
Supplemental data available at www.IngentaConnect.com
REFERENCES
- 1. Tomasi TB, Jr, Tan EM, Solomon A, et al. Characteristics of an immune system common to certain external secretions. J Exp Med. 1965; 121:101–124. [DOI] [PMC free article] [PubMed] [Google Scholar]
- 2. Tomasi TB, Jr, DeCoteau E. Mucosal antibodies in respiratory and gastrointestinal disease. Adv Intern Med. 1970; 116:401–425. [PubMed] [Google Scholar]
- 3. Bellanti JA, Artenstein MS, Buescher EL. Characterization of virus neutralizing antibodies in human serum and nasal secretions. J Immunol. 1965; 94:344–351. [PubMed] [Google Scholar]
- 4. Smith CB, Bellanti JA, Chanock RM. Immunoglobulins in serum and nasal secretions following infection with type 1 parainfluenza virus and injection of inactivated vaccines. J Immunol. 1967; 99:133–141. [PubMed] [Google Scholar]
- 5. Bellanti JA. Role of local gamma-A-immunoglobulins in immunity. Am J Dis Child. 1968; 115:239–246. [DOI] [PubMed] [Google Scholar]
- 6. Bellanti JA, Sanga RL, Klutinis B, et al. Antibody responses in serum and nasal secretions of children immunized with inactivated and attenuated measles-virus vaccines. N Engl J Med. 1969; 280:628–633. [DOI] [PubMed] [Google Scholar]
- 7. Kim HW, Bellanti JA, Arrobio JO, et al. Respiratory syncytial virus neutralizing activity in nasal secretions following natural infection. Proc Soc Exp Biol Med. 1969; 131:658–661. [DOI] [PubMed] [Google Scholar]
- 8. Bellanti JA, Artenstein MS, Brandt BL, et al. Immunoglobulin responses in serum and nasal secretions after natural adenovirus infections. J Immunol. 1969; 103:891–898. [PubMed] [Google Scholar]
- 9. Bellanti JA. Biologic significance of the secretory A immunoglobulins. Pediatrics. 1971; 48:715–729. [PubMed] [Google Scholar]
- 10. Callow KA. Effect of specific humoral immunity and some non-specific factors on resistance of volunteers to respiratory coronavirus infection. J Hyg (Lond). 1985; 95:173–189. [DOI] [PMC free article] [PubMed] [Google Scholar]
- 11. Cervia C, Nilsson J, Zurbuchen Y, et al. Systemic and mucosal antibody responses specific to SARS-CoV-2 during mild versus severe COVID-19. J Allergy Clin Immunol. 2021; 147:545–5577.e9. [DOI] [PMC free article] [PubMed] [Google Scholar]
- 12. Law JC, Girard M, Chao GYC, et al. Persistence of T cell and antibody responses to SARS-CoV-2 up to 9 months after symptom onset. J Immunol. 2022; 208:429–443. [DOI] [PubMed] [Google Scholar]
- 13. Heaney CD, Pisanic N, Randad PR, et al. Comparative performance of multiplex salivary and commercially available serologic assays to detect SARS-CoV-2 IgG and neutralization titers. J Clin Virol. 2021; 145:104997. [DOI] [PMC free article] [PubMed] [Google Scholar]
- 14. Egorov AI, Griffin SM, Fuzawa M, et al. A multiplex noninvasive salivary antibody assay for SARS-CoV-2 infection and its application in a population-based survey by mail. Microbiol Spectr. 2021; 9:e0069321. [DOI] [PMC free article] [PubMed] [Google Scholar]
- 15. Vilela ACS, Costa CA, Oliveira SA, et al. Validity and reliability of immunochromatographic IgM/IgG rapid tests for COVID-19 salivary diagnosis. Oral Dis. 2021. Oct 25: 10.1111/odi.14059. [DOI] [PMC free article] [PubMed] [Google Scholar]
- 16. Costantini VP, Nguyen K, Lyski Z, et al. Development and validation of an enzyme immunoassay for detection and quantification of SARS-CoV-2 salivary IgA and IgG. J Immunol. 2022; 208:(6):1500–1508. [DOI] [PMC free article] [PubMed] [Google Scholar]
- 17. Ketas TJ, Chaturbhuj D, Cruz Portillo VM, et al. Antibody responses to SARS-CoV-2 mRNA vaccines are detectable in saliva. bioRxiv. [Preprint]. 2021. Mar 11: 10.1101/2021.03.11.434841. [DOI] [PMC free article] [PubMed] [Google Scholar]
- 18. Alkharaan H, Bayati S, Hellström C, et al. Persisting salivary IgG against SARS-CoV-2 at 9 months after mild COVID-19: a complementary approach to population surveys. J Infect Dis. 2021; 224:407–414. [DOI] [PMC free article] [PubMed] [Google Scholar]
- 19. Henson BS, Wong DT. Collection, storage, and processing of saliva samples for downstream molecular applications. Methods Mol Biol. 2010; 666:21–30. [DOI] [PubMed] [Google Scholar]
- 20. https://www.fda.gov/media/138446/download.
- 21. https://www.fda.gov/media/144037/download.
- 22. Liston A, Humblet-Baron S, Duffy D, et al. Human immune diversity: from evolution to modernity. Nat Immunol. 2021; 22:1479–1489. [DOI] [PubMed] [Google Scholar]
- 23. Wei J, Matthews PC, Stoesser N, et al. Anti-spike antibody response to natural SARS-CoV-2 infection in the general population. Nat Commun. 2021; 12:6250. [DOI] [PMC free article] [PubMed] [Google Scholar]
- 24. Steensels D, Pierlet N, Penders J, et al. Comparison of SARS-CoV-2 antibody response following vaccination with BNT162b2 [Pfizer] or mRNA-1273. JAMA. 2021; 326:1533–1535. [DOI] [PMC free article] [PubMed] [Google Scholar]
- 25. Declercq J, Tobback E, Vanhee S, et al. COVID-19 vaccination with BNT162b2 and ChAdOx1 vaccines has the potential to induce nasal neutralizing antibodies. Allergy. 2022; 77:304–307. [DOI] [PMC free article] [PubMed] [Google Scholar]
- 26. Lam J-Y, Ng Y-Y, Yuen C-K, et al. A nasal omicron vaccine booster elicits potent neutralizing antibody response against emerging SARS-CoV-2 variants. Emerg Microbes Infect. 2022; 11:964–967. [DOI] [PMC free article] [PubMed] [Google Scholar]
- 27. Cao Y, Wang J, Jian F, et al. Omicron escapes the majority of existing SARS-CoV-2 neutralizing antibodies. Nature. 2022; 602:657–663. [DOI] [PMC free article] [PubMed] [Google Scholar]
- 28. FDA. Antibody (serology) testing for COVID-19: information for patients and consumers. https://www.fda.gov/medical-devices/coronavirus-covid-19-and-medical-devices/antibody-serology-testing-covid-19-information-patients-and-consumers.
- 29. Duong YT, Wright CG, Justman J. Antibody testing for coronavirus disease 2019: not ready for prime time. BMJ. 2020; 370:m2655. [DOI] [PMC free article] [PubMed] [Google Scholar]
- 30. Kadkhoda K. Update to COVID-19 serologic testing: FAQs and caveats. Cleve Clin J Med. 2022. Jan 12. [DOI] [PubMed] [Google Scholar]
Associated Data
This section collects any data citations, data availability statements, or supplementary materials included in this article.