Abstract
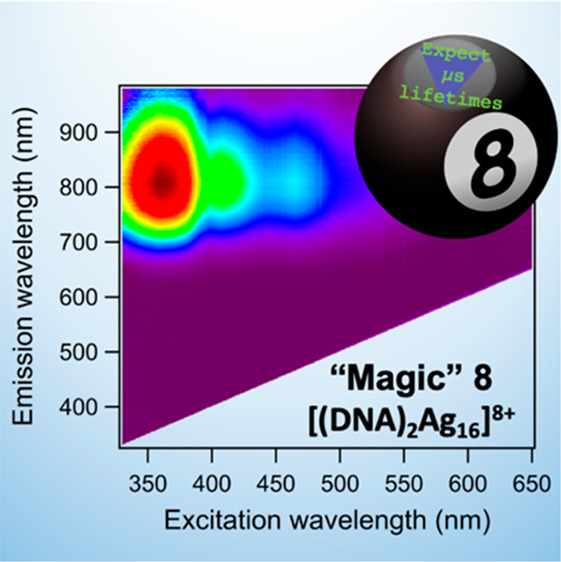
DNA oligomers are known to serve as stabilizing ligands for silver nanoclusters (AgN-DNAs) with rod-like nanocluster geometries and nanosecond-lived fluorescence. Here, we report two AgN-DNAs that possess distinctly different structural properties and are the first to exhibit only microsecond-lived luminescence. These emitters are characterized by significant broadband downconversion from the ultraviolet/visible to the near-infrared region. Circular dichroism spectroscopy shows that the structures of these two AgN-DNAs differ significantly from previously reported AgN-DNAs. We find that these nanoclusters contain eight valence electrons, making them the first reported DNA-stabilized luminescent quasi-spherical superatoms. This work demonstrates the important role that nanocluster composition and geometry play in dictating luminescence properties of AgN-DNAs and significantly expands the space of structure–property relations that can be achieved for AgN-DNAs.
DNA oligomers can serve as multidentate ligands to stabilize silver nanoclusters (AgN-DNAs) with tunable optical properties. Silver cations (Ag+) interact with DNA through the nucleobases,1 giving AgN-DNAs genomic-like properties.2 The nucleobase sequence encodes the number of silver atoms, N, and the size-correlated excitation and emission wavelengths of AgN-DNAs. DNA strands of different sequences have yielded a diverse spectral palette of AgN-DNAs with colors from 400 nm up to 1000 nm.2 In conjunction with high fluorescence quantum yields (QYs), large Stokes shifts as compared to organic dyes,2,3 and unique photophysics,4,5 AgN-DNAs are promising emitters for sensing6 and biomedical imaging.4,7,8
Studies have demonstrated that the silver nanocluster cores of fluorescent AgN-DNAs can be rod-like. In contrast to the spheroidal geometries typical of monolayer-protected AgN,9 Schultz et al. proposed that DNA ligands impose highly anisotropic, rod-like geometries on the encapsulated AgN.10 This prediction was supported by other studies11−13 and confirmed by the first published crystal structures of fluorescent AgN-DNAs.14,15 High-resolution electrospray ionization mass spectrometry10 (HR-ESI-MS) studies show that fluorescence excitation and emission wavelengths of AgN-DNAs are correlated with the numbers of effective valence electrons within the nanocluster core and that fluorescent AgN-DNAs have a preference for even numbers of valence electrons.12 Because silver has a valency of 1, the valence electron count is often described in the literature as the Ag0 content of the nanocluster, N0, rather than total silver content N.2 AgN-DNAs with green and red fluorescence possess “magic numbers” of N0 = 4 and 6, respectively,12 and a few near-infrared (NIR) fluorescent AgN-DNAs with emission peaks between 775 and 1000 nm are known to contain N0 = 10 and 12.12,16 No values of N0 have been reported so far for AgN-DNAs with peak emission between 685 and 775 nm. Notably, the N0 = 4, 6, 10, and 12 of fluorescent AgN-DNAs differ from the “superatomic” magic numbers for quasi-spherical ligand-stabilized nanoclusters (N0 = 2, 8, ...).17 To date, no fluorescent AgN-DNAs have been reported with N0 = 2 or 8, and only two nonfluorescent AgN-DNAs are reported to contain N0 = 8.12 The eight-electron “magic” monolayer-protected gold and silver nanoclusters are highly prevalent and correspond to a 1S2 1P6 superatomic electron configuration.18,19 The low abundance of eight-electron AgN-DNAs may indicate that DNA ligands prefer to stabilize nanoclusters without spherical symmetry.
Here, we report the first evidence for luminescent DNA-stabilized eight-electron AgN, which possess distinctly different structures and photophysical properties than previously reported AgN-DNAs. Optical and compositional characterization of two HPLC-purified NIR-emissive AgN-DNAs with atypical multipeaked excitation spectra and chiroptical signatures are presented. HR-ESI-MS shows that these AgN-DNAs possess N0 = 8 valence electrons. These AgN-DNAs have no significant nanosecond-lived fluorescence but instead present microsecond-lived luminescence and larger broadband downconversion than any other AgN-DNAs reported to date.20 Our findings support that the investigated N0 = 8 AgN-DNAs have distinctly different compositions and geometries compared to previously reported rod-shaped AgN-DNAs. These results demonstrate the influence of nanocluster composition and geometry on the luminescence properties of nanocluster emitters.
The AgN-DNAs studied here were identified using high-throughput synthesis and characterization methods.12 The DNA oligomer 5′-ATCTCCACAG-3′ stabilizes a species with an emission peak at 800 nm (800-AgN-DNA), reported by Swasey et al.16 The oligomer 5′-GACGACGGAT-3′ stabilizes a species with peak emission at 760 nm (760-AgN-DNA), reported in a large-scale study of AgN-DNA excitation and emission spectra by Copp et al.3 Samples were purified by high performance liquid chromatography (HPLC) prior to characterization to ensure the presence of only one emissive species in solution (Figures S1–S4).
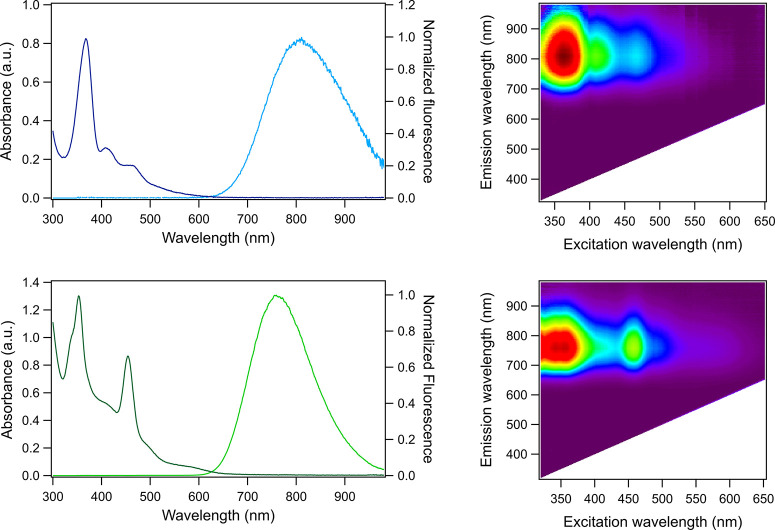
Figure 1 shows that 800-AgN-DNA and 760-AgN-DNA possess absorption and excitation spectra that are uncharacteristically complex as compared to other HPLC-purified AgN-DNAs,2 motivating further study. The absorption spectra of these AgN-DNAs exhibit several distinct bands corresponding to the nanocluster at near-UV and blue wavelengths (Figure 1A,C), along with the absorption and excitation features around 260 nm that are due to UV transitions of the nucleobases.21 800-AgN-DNA exhibits a dominant AgN-related absorbance peak at 370 nm, with two less intense yet defined peaks at 410 and 460 nm, and a tail that spans from 500 to 570 nm. 760-AgN-DNA exhibits two dominant absorbance peaks at 355 nm (with a shoulder around 335 nm) and 455 nm and minor features at 405, 495, and 575 nm. 2D emission vs excitation maps for these AgN-DNAs (Figure 1B,D) show that the emission spectrum is independent of the excitation wavelength (see also Figure S4), supporting the presence of only one emissive species in solution. This is also confirmed by the good overlap between the absorption and excitation spectra of both 800-AgN-DNA and 760-AgN-DNA (Figure S3).
Figure 1.
(A) Normalized absorbance (dark blue) and normalized emission (light blue) spectra and (B) 2D excitation/emission plot for 800-AgN-DNA. (C) Absorbance (dark green) and emission (light green) spectra and (D) 2D emission vs excitation plot for 760-AgN-DNA. All measurements were conducted in 10 mM NH4OAc, recorded at room temperature. Emission spectra in (A) and (C) were recorded using a UV LED excitation source.
While small excitation features at short wavelengths have been reported for other NIR-emissive AgN-DNAs, all previously reported HPLC-purified AgN-DNAs in the literature have one intense excitation peak in the green to NIR spectral region.20,22,23 The simplicity of typical AgN-DNA excitation spectra contrasts with the multipeaked absorbance spectra of monolayer-protected AgN.19 Notably, 800-AgN-DNA and 760-AgN-DNA share excitation/absorption features with other eight-electron AgN.24−26 Similar features are also observed for zeolite-stabilized AgN,27,28 which exhibit strong excitation peaks in the 250 to 450 nm region with broad downconversion to the visible/NIR range.
800-AgN-DNA and 760-AgN-DNA have room temperature (luminescence) QYs of 1% and 4%, respectively, which are lower than those reported for other NIR-emissive AgN-DNAs.10,23,29 As a result of the significant difference between excitation and emission wavelengths of these nanoclusters, the QY was determined using 736-Ag16-DNA, a well-studied NIR AgN-DNA with an unusually large Stokes shift, as the reference compound (Figures S5 and S6).15,20,30
Electronic circular dichroism (CD) spectra of 800-AgN-DNA and 760-AgN-DNA were compared to those of four previously reported HPLC-purified AgN-DNAs.31 CD spectroscopy, which measures the difference in absorbance of left and right circularly polarized light, is highly sensitive to the electronic structure. DNA is an inherently chiral biomolecule with electronic transitions below ∼300 nm, and changes in middle UV (200–300 nm) CD signatures indicate DNA conformational changes. Swasey et al. showed that adding Ag+ to DNA alters the middle UV CD spectrum as compared to bare DNA, demonstrating Ag+-mediated DNA rearrangement. Reduction of the Ag+-DNA complex forms AgN-DNAs, and new CD features arise at near-UV (300–400 nm) and visible to NIR wavelengths as a result of the effective valence electrons of the nanoclusters.31,32 All previously reported CD spectra of AgN-DNAs show strong negative signals in the near-UV region and a positive peak in the visible-NIR region that is aligned with the dominant absorbance peak of the AgN-DNA.31
The CD spectra for 800-AgN-DNA and 760-AgN-DNA (Figure 2) differ from these past studies in several ways. First, both negative and intense positive CD features are present from 200 to 300 nm, supporting different DNA ligand conformations. CD transitions > 300 nm, which are attributed to the AgN,31 also differ from past reported behavior. For 800-AgN-DNA (Figure 2A), the dominant CD feature at 370 nm is bisignate, indicating the presence of two separate transitions. This may explain why the absorbance peak at 370 nm is not perfectly symmetrical (Figure 1A). Additional longer wavelength CD features present a negative Cotton effect, in contrast to previously reported AgN-DNAs.31 We observe similar behavior for 760-AgN-DNA (Figure 2B), with bisignate transitions between 350 and 400 nm and negative visible peaks. The clear differences between CD spectra of 800-AgN-DNA and 760-AgN-DNA compared to previously studied AgN-DNAs suggest significant structural differences between these two classes of nanoclusters.
Figure 2.
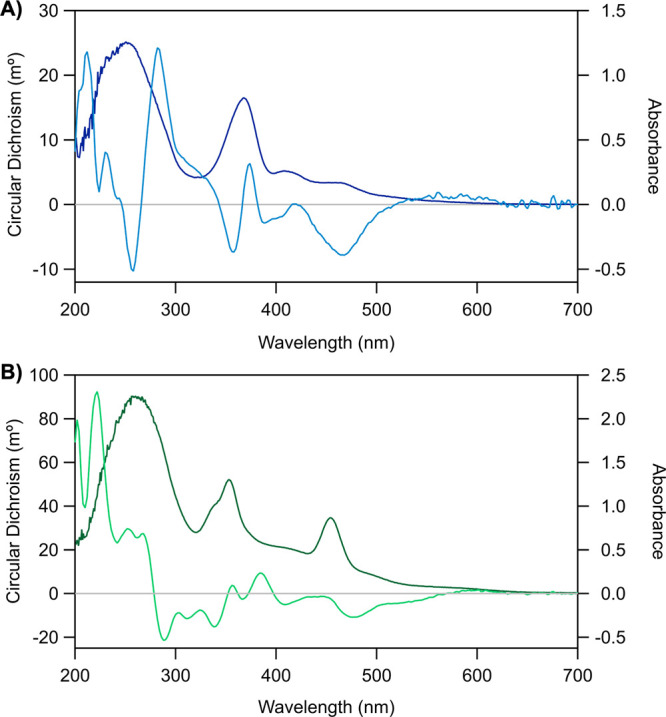
CD spectra (light blue/green) and absorbance spectra (dark blue/green) of (A) 800-AgN-DNA and (B) 760-AgN-DNA in 10 mM NH4OAc at room temperature (see SI for details).
We determined the compositions and total charges of 800-AgN-DNA and 760-AgN-DNA by negative ion mode HR-ESI-MS, which is well-suited for characterizing noncovalent interactions in nucleic acids.33 HR-ESI-MS allows determination of both ion mass, m, and charge, z, rather than just the ratio m/z, by resolving the isotope pattern that arises due to the natural variation in isotopic abundances of the elements.10,34 By this method, we not only count the number of silver atoms, N, and DNA strands, ns, but also separate N into effective neutral (N0) and cationic (N+) silver content, thereby determining the oxidation state of the AgN-DNA and the effective valence electron count equivalent to N0.10
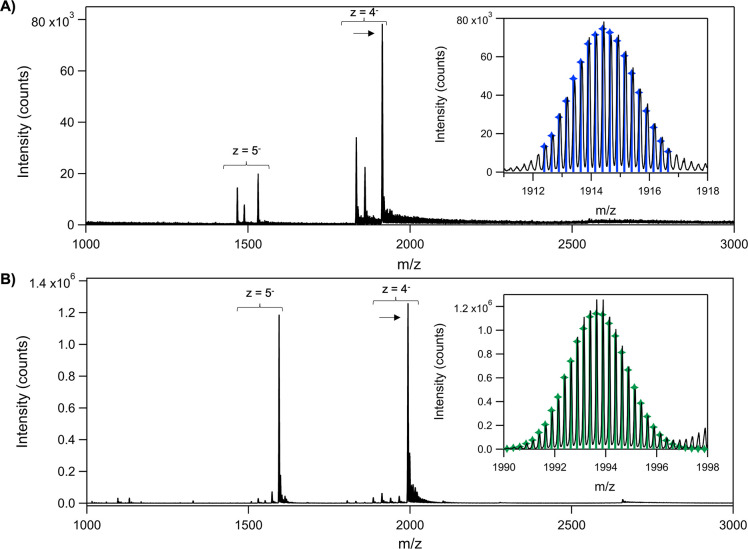
Mass spectra are shown in Figure 3. Both AgN-DNAs show dominant products for charge states z = 4– and z = 5–. For 800-AgN-DNA, the most intense peak at each charge state (z = 4– in Figure 3A; z = 5– in Figure S8) corresponds to a product composed of two DNA strands (ns = 2) and N = 16 total silvers, with an overall charge of +8, i.e., [(DNA)2Ag16]8+ (see Table S1 for fits). Thus, this AgN-DNA has eight effective valence electrons, N0 = 8. Two peaks with smaller intensities at each charge state correspond to ns = 2 with N = 13 and 14, respectively, and preserve the same value of N0 = 8 (Figures S7 and S9). For 760-AgN-DNA (Figure 3B and Figure S10), the two most intense peaks correspond to a product of ns = 2 and N = 17, with an overall nanocluster charge of +9, i.e., [(DNA)2Ag17]9+. Thus, this nanocluster also has N0 = 8. Minor peaks correspond to smaller ns = 2 products with N = 10 to 16 and different overall nanocluster charges (Figure S7). Because samples were HPLC-purified prior to characterization, the smaller products likely form due to loss of silvers during the electrospray process, as is common for other AgN-DNAs.16 Because N0 is conserved in the dominant products at z = 4– and z = 5– charge states for both emitters (Figures S8 and S10 and Table S1), these results support that the nanocluster cores of 800-AgN-DNA and 760-AgN-DNA host eight effective valence electrons. (Note that AgN-DNA peaks are distinctly resolved from adducts of additional Na+ cations, Figure S11.) These are the first reported luminescent AgN-DNAs with N0 = 8, a “magic number” for spherical gold and silver superatoms.26,35
Figure 3.
Mass spectra of (A) 800-AgN-DNA and (B) 760-AgN-DNA. Experimental data in black. Arrows indicate the experimental peaks shown in insets, with calculated isotopic distributions for (A) [(DNA)2Ag16]8+ (blue) and (B) [(DNA)2Ag17]9+ (green) at z = 4–.
The optical spectra, lower QYs, and compositions of 800-AgN-DNA and 760-AgN-DNA support that these emitters have clear structural differences compared to previously reported fluorescent AgN-DNAs. These differences may influence their photophysical properties. Hence, we investigated the nature of the luminescence process in N0 = 8 AgN-DNAs using a burst mode approach.36 Both AgN-DNAs only show evidence for microsecond-lived luminescence (Figure 4) at room temperature. For 800-AgN-DNA, the intensity decay upon turning off the laser was tail-fitted monoexponentially, resulting in a decay time of 2.39 ± 0.01 μs. The decay curve of 760-AgN-DNA was tail-fitted with a monoexponential model, resulting in a decay time of 19.5 ± 0.1 μs. These values are in good agreement with the decay times obtained using time-correlated single photon counting (TCSPC) and a Xenon flash lamp as an excitation source (Figures S12 and S13).
Figure 4.
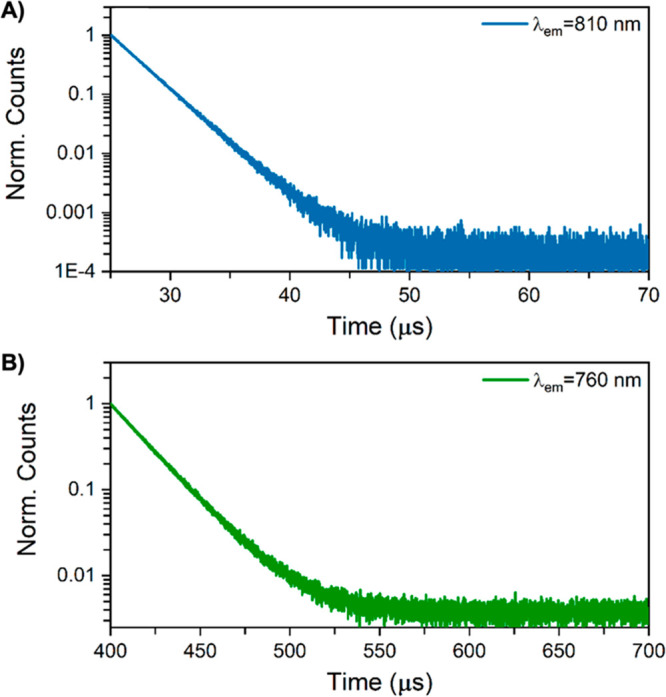
Decay curves of (A) 800-AgN-DNA and (B) 760-AgN-DNA measured in burst mode, exciting at 374.3 nm with a picosecond-pulsed laser (PicoQuant). Measurements were carried out at 25 °C in 10 mM NH4OAc. The full burst mode data, together with the corresponding instrument response functions (IRFs) and monoexponential fits, can be found in Figures S14 and S15.
Microsecond-lived luminescence is usually indicative of a spin-forbidden phosphorescence process, which is sensitive to quenching by Dexter energy transfer with molecular oxygen. O2 has a triplet ground state and is widely used to quench phosphorescence from organic molecules. We investigated the effect of O2 on the decay time of 800-AgN-DNA to determine if the microsecond-lived luminescence of this emitter is phosphorescence-like. The concentration of dissolved O2 was lowered in the 800-AgN-DNA solution using a water jet pump, and no change in the microsecond lifetime was observed (Figure S16, Table S3). The absence of an effect on the microsecond lifetime could indicate a nonphosphorescence-based decay pathway or might be caused by the DNA scaffold acting as a barrier that prevents the diffusion of O2 toward the AgN cluster. Given the remaining uncertainty, we prefer to refer to the microsecond-lived radiative emission as luminescence instead of phosphorescence for these AgN-DNAs.
Microsecond-lived NIR luminescence was first reported by Rück et al. for an HPLC-purified AgN-DNA that also exhibited green nanosecond fluorescence.22 Similarly, Petty et al. reported an unpurified AgN-DNA with dual green fluorescence and NIR phosphorescence.37 In contrast, 800-AgN-DNA and 760-AgN-DNA show only microsecond-lived luminescence with no significant nanosecond-lived fluorescence. This suggests that the electronic structures of 800-AgN-DNA and 760-AgN-DNA differ from most previously investigated AgN-DNAs characterized by nanosecond-lived fluorescence.38
As a result of the similarities among the eight-electron AgN-DNAs reported here and other ligand-protected eight-electron superatom AgN,24−26 we propose that 800-AgN-DNA and 760-AgN-DNA have quasi-spherical cluster geometries. Purified emissive AgN-DNAs whose N0 have been determined by HR-ESI-MS10,12,16,39 have single dominant visible to NIR absorption peaks that are well-described by calculations for linear atomic chains of Ag atoms.10,40 In contrast, the most intense absorption peaks of 800-AgN-DNA and 760-AgN-DNA are at UV energies (Figure 1). Calculations show that quasi-spherical or globular AgN have intense cluster-related absorption peaks around 3.5 eV or higher,41,42 which suggests that 800-AgN-DNA and 760-AgN-DNA may be more quasi-spherical and less rod-like than fluorescent AgN-DNAs. The distinct photophysical differences between rod-like AgN-DNAs with nanosecond-lived fluorescence and eight-electron superatom AgN-DNAs with microsecond-lived luminescence illustrate how nanocluster composition and shape influence the electronic structure of AgN-DNAs. Gold nanoclusters also exhibit shape-dependent photophysics.43 For example, spherical Au25(SR)18– exhibits ∼100 ns luminescence lifetimes, while rod-shaped [Au25(PPh3)10(SR)5Cl2]2+ display microsecond luminescence decay times and distinct absorbance spectra compared to Au25(SR)18–. Interestingly, we find that AgN-DNAs exhibit opposite lifetime behaviors, with nanosecond-scale fluorescence for rod-like AgN-DNAs and microsecond-scale luminescence for eight-electron AgN-DNAs. Future structural characterization and computational studies are needed to confirm the hypothesis that the eight-electron AgN-DNAs reported here possess spherical geometry and to better understand the structure–property correlations of AgN-DNAs in general.
In conclusion, we present two HPLC-purified NIR-emissive AgN-DNAs with broadband UV/vis to NIR downconversion, microsecond-lived luminescence, and N0 = 8 effective valence electrons in the AgN core. These are the first AgN-DNAs reported with only microsecond-lived luminescence but no concurrent nanosecond fluorescence. These are also the first reported luminescent AgN-DNAs with N0 = 8 superatomic shell filling numbers. The distinct photophysical and chiroptical properties of these AgN-DNAs, as compared to previously investigated AgN-DNAs, together with their eight effective valence electrons, support that these nanoclusters may be spherical unlike fluorescent AgN-DNAs, which have rod-like structures. Thus, this study expands the diversity of possible silver nanocluster geometries that can be stabilized by multidentate DNA ligands.
Experimental Methods
Synthesis of AgN-DNAs. AgN-DNAs were synthesized by mixing DNA oligomers (Integrated DNA Technologies) with AgNO3 in a 10 mM NH4OAc solution, followed by partially reducing the silver content with a 0.5 ratio of NaBH4. Final concentrations were 25 μM DNA, 100 μM AgNO3, and 50 μM NaBH4 for 800-AgN-DNA and 35 μM DNA, 10 mM NH4OAc, 175 μM AgNO3, and 87.5 μM NaBH4 for 760-AgN-DNA. Samples were stored in the dark at 4 °C until purification by high performance liquid chromatography (HPLC) (details in the SI) and then exchanged into 10 mM NH4OAc before further characterization.
Optical Characterization. Steady-state absorbance and emission spectra were recorded using a thermoelectrically cooled, fiber-coupled spectrometer (Ocean Optics QE65000). Absorbance spectra were collected using a DH-Mini (Ocean Insight) deuterium and tungsten halogen UV–vis–NIR light source. Fluorescence spectra were collected using a UV LED for universal UV excitation21 and an HPX-2000 xenon lamp (Ocean Insight) coupled with a Monoscan 2000 monochromator (Ocean Optics) for visible excitation. Time-resolved emission measurements were carried out with a FluoTime300 instrument from PicoQuant (see the SI for details). Circular dichroism (CD) measurements were performed on a Jasco J-810 CD spectrometer.
Mass Spectrometry. Electrospray ionization mass spectrometry (ESI-MS) was performed with a Waters Xevo G2-XS QTof. Samples were directly injected at 10 μL/min in negative ion mode with a 2 kV capillary voltage, 30 V cone voltage, and no collision energy. Spectra were collected from 1000 to 4000 m/z and integrated for 1 s. Source and desolvation temperatures were 80 and 150 °C, respectively. Gas flows were 45 L/h for the cone and 450 L/h for the desolvation. Samples were injected with 50 mM NH4OAc–MeOH (80:20) solution at pH 7 (for 760-AgN-DNA, the solution also contained 0.1% HCOOH). Determination of the nanocluster size and charge was performed by fitting the calculated isotopic distribution of the AgN-DNA to the experimental spectra (details in the SI). Calculated isotopic distributions were obtained from MassLynx using the chemical formula and corrected for the overall positive charge (oxidation state) of the complex.2
Acknowledgments
This work was supported by NSF Biophotonics CBET-2025790. C.C., V.R., M.B.L., and T.V. acknowledge funding from the Villum Foundation (VKR023115) and the Independent Research Fund Denmark (0136-00024B). A.G.-R. acknowledges a Balsells Graduate Fellowship.
Supporting Information Available
The Supporting Information is available free of charge at https://pubs.acs.org/doi/10.1021/acs.jpclett.2c02207.
Materials and methods, HPLC chromatograms, additional steady-state and time-resolved photoluminescence spectra and decay fits, data for quantum yield determination, mass spectra, and calculated mass distributions (PDF)
The authors declare no competing financial interest.
Supplementary Material
References
- Swasey S. M.; Leal L. E.; Lopez-Acevedo O.; Pavlovich J.; Gwinn E. G. Silver (I) as DNA Glue: Ag(+)-Mediated Guanine Pairing Revealed by Removing Watson-Crick Constraints. Sci. Rep. 2015, 5, 10163. 10.1038/srep10163. [DOI] [PMC free article] [PubMed] [Google Scholar]
- Gonzàlez-Rosell A.; Cerretani C.; Mastracco P.; Vosch T.; Copp S. M. Structure and Luminescence of DNA-Templated Silver Clusters. Nanoscale Adv. 2021, 3 (5), 1230–1260. 10.1039/D0NA01005G. [DOI] [PMC free article] [PubMed] [Google Scholar]
- Copp S. M.; Gonzàlez-Rosell A. Large-Scale Investigation of the Effects of Nucleobase Sequence on Fluorescence Excitation and Stokes Shifts of DNA-Stabilized Silver Clusters. Nanoscale 2021, 13, 4602–4613. 10.1039/D0NR08300C. [DOI] [PMC free article] [PubMed] [Google Scholar]
- Fleischer B. C.; Petty J. T.; Hsiang J.-C.; Dickson R. M. Optically Activated Delayed Fluorescence. J. Phys. Chem. Lett. 2017, 8 (15), 3536–3543. 10.1021/acs.jpclett.7b01215. [DOI] [PMC free article] [PubMed] [Google Scholar]
- Krause S.; Cerretani C.; Vosch T. Disentangling Optically Activated Delayed Fluorescence and Upconversion Fluorescence in DNA Stabilized Silver Nanoclusters. Chem. Sci. 2019, 10 (20), 5326–5331. 10.1039/C9SC00865A. [DOI] [PMC free article] [PubMed] [Google Scholar]
- Chen Y.; Phipps M. L.; Werner J. H.; Chakraborty S.; Martinez J. S. DNA Templated Metal Nanoclusters: From Emergent Properties to Unique Applications. Acc. Chem. Res. 2018, 51 (11), 2756–2763. 10.1021/acs.accounts.8b00366. [DOI] [PubMed] [Google Scholar]
- Liisberg M. B.; Kardar Z. S.; Copp S. M.; Cerretani C.; Vosch T. Single-Molecule Detection of DNA-Stabilized Silver Nanoclusters Emitting at the NIR I/II Border. J. Phys. Chem. Lett. 2021, 12 (4), 1150–1154. 10.1021/acs.jpclett.0c03688. [DOI] [PubMed] [Google Scholar]
- Gambucci M.; Zampini G.; Quaglia G.; Vosch T.; Latterini L. Probing the Fluorescence Behavior of DNA-Stabilized Silver Nanoclusters in the Presence of Biomolecules. ChemPhotoChem 2021, 5, 369–375. 10.1002/cptc.202000262. [DOI] [Google Scholar]
- Xie Y. P.; Shen Y. L.; Duan G. X.; Han J.; Zhang L. P.; Lu X. Silver Nanoclusters: Synthesis, Structures and Photoluminescence. Mater. Chem. Front. 2020, 4 (8), 2205–2222. 10.1039/D0QM00117A. [DOI] [Google Scholar]
- Schultz D.; Gardner K.; Oemrawsingh S. S. R.; Markešević N.; Olsson K.; Debord M.; Bouwmeester D.; Gwinn E. Evidence for Rod-Shaped DNA-Stabilized Silver Nanocluster Emitters. Adv. Mater. 2013, 25 (20), 2797–2803. 10.1002/adma.201204624. [DOI] [PubMed] [Google Scholar]
- Ramazanov R. R.; Kononov A. I. Excitation Spectra Argue for Threadlike Shape of DNA-Stabilized Silver Fluorescent Clusters. J. Phys. Chem. C 2013, 117 (36), 18681–18687. 10.1021/jp404758j. [DOI] [Google Scholar]
- Copp S. M.; Schultz D.; Swasey S.; Pavlovich J.; Debord M.; Chiu A.; Olsson K.; Gwinn E. Magic Numbers in DNA-Stabilized Fluorescent Silver Clusters Lead to Magic Colors. J. Phys. Chem. Lett. 2014, 5 (6), 959–963. 10.1021/jz500146q. [DOI] [PMC free article] [PubMed] [Google Scholar]
- Copp S. M.; Schultz D.; Swasey S. M.; Faris A.; Gwinn E. G. Cluster Plasmonics: Dielectric and Shape Effects on DNA-Stabilized Silver Clusters. Nano Lett. 2016, 16 (6), 3594–3599. 10.1021/acs.nanolett.6b00723. [DOI] [PubMed] [Google Scholar]
- Huard D. J. E.; Demissie A.; Kim D.; Lewis D.; Dickson R. M.; Petty J. T.; Lieberman R. L. Atomic Structure of a Fluorescent Ag8 Cluster Templated by a Multistranded DNA Scaffold. J. Am. Chem. Soc. 2019, 141 (29), 11465–11470. 10.1021/jacs.8b12203. [DOI] [PMC free article] [PubMed] [Google Scholar]
- Cerretani C.; Kanazawa H.; Vosch T.; Kondo J. Crystal Structure of a NIR-Emitting DNA-Stabilized Ag 16 Nanocluster. Angew. Chemie Int. Ed. 2019, 58 (48), 17153–17157. 10.1002/anie.201906766. [DOI] [PubMed] [Google Scholar]
- Swasey S. M.; Copp S. M.; Nicholson H. C.; Gorovits A.; Bogdanov P.; Gwinn E. G. High Throughput near Infrared Screening Discovers DNA-Templated Silver Clusters with Peak Fluorescence beyond 950 Nm. Nanoscale 2018, 10, 19701–19705. 10.1039/C8NR05781H. [DOI] [PubMed] [Google Scholar]
- Jin R. Atomically Precise Metal Nanoclusters: Stable Sizes and Optical Properties. Nanoscale 2015, 7, 1549–1565. 10.1039/C4NR05794E. [DOI] [PubMed] [Google Scholar]
- Häkkinen H. Atomic and Electronic Structure of Gold Clusters: Understanding Flakes, Cages and Superatoms from Simple Concepts. Chem. Soc. Rev. 2008, 37 (9), 1847–1859. 10.1039/b717686b. [DOI] [PubMed] [Google Scholar]
- Jin R.; Zeng C.; Zhou M.; Chen Y. Atomically Precise Colloidal Metal Nanoclusters and Nanoparticles: Fundamentals and Opportunities. Chem. Rev. 2016, 116 (18), 10346–10413. 10.1021/acs.chemrev.5b00703. [DOI] [PubMed] [Google Scholar]
- Bogh S. A.; Carro-Temboury M. R.; Cerretani C.; Swasey S. M.; Copp S. M.; Gwinn E. G.; Vosch T. Unusually Large Stokes Shift for a Near-Infrared Emitting DNA-Stabilized Silver Nanocluster. Methods Appl. Fluoresc. 2018, 6 (2), 024004. 10.1088/2050-6120/aaa8bc. [DOI] [PubMed] [Google Scholar]
- O’Neill P. R.; Gwinn E. G.; Fygenson D. K. UV Excitation of DNA Stabilized Ag Cluster Fluorescence via the DNA Bases. J. Phys. Chem. C 2011, 115 (49), 24061–24066. 10.1021/jp206110r. [DOI] [Google Scholar]
- Rück V.; Cerretani C.; Neacşu V. A.; Liisberg M. B.; Vosch T. Observation of Microsecond Luminescence While Studying Two DNA-Stabilized Silver Nanoclusters Emitting in the 800–900 Nm Range. Phys. Chem. Chem. Phys. 2021, 23 (24), 13483–13489. 10.1039/D1CP01731D. [DOI] [PubMed] [Google Scholar]
- Neacşu V. A.; Cerretani C.; Liisberg M. B.; Swasey S. M.; Gwinn E. G.; Copp S. M.; Vosch T. Unusually Large Fluorescence Quantum Yield for a Near-Infrared Emitting DNA-Stabilized Silver Nanocluster. Chem. Commun. 2020, 56, 6384. 10.1039/D0CC01849J. [DOI] [PubMed] [Google Scholar]
- Gam F.; Chantrenne I.; Kahlal S.; Chiu T. H.; Liao J. H.; Liu C. W.; Saillard J. Y. Alloying Dichalcogenolate-Protected Ag 21 Eight-Electron Nanoclusters: A DFT Investigation. Nanoscale 2021, 14 (1), 196–203. 10.1039/D1NR06019H. [DOI] [PubMed] [Google Scholar]
- Weerawardene K. L. D. M.; Aikens C. M. Origin of Photoluminescence of Ag 25 (SR) 18 – Nanoparticles: Ligand and Doping Effect. J. Phys. Chem. C 2018, 122 (4), 2440–2447. 10.1021/acs.jpcc.7b11706. [DOI] [Google Scholar]
- Joshi C. P.; Bootharaju M. S.; Alhilaly M. J.; Bakr O. M. [Ag25(SR)18]-: The “Golden”Silver Nanoparticle Silver Nanoparticle. J. Am. Chem. Soc. 2015, 137 (36), 11578–11581. 10.1021/jacs.5b07088. [DOI] [PubMed] [Google Scholar]
- De Cremer G.; Coutiño-Gonzalez E.; Roeffaers M. B. J.; Moens B.; Ollevier J.; Van Der Auweraer M.; Schoonheydt R.; Jacobs P. A.; De Schryver F. C.; Hofkens J.; et al. Characterization of Fluorescence in Heat-Treated Silver-Exchanged Zeolites. J. Am. Chem. Soc. 2009, 131 (8), 3049–3056. 10.1021/ja810071s. [DOI] [PubMed] [Google Scholar]
- Coutino-Gonzalez E.; Baekelant W.; Grandjean D.; Roeffaers M. B. J.; Fron E.; Aghakhani M. S.; Bovet N.; Van Der Auweraer M.; Lievens P.; Vosch T.; et al. Thermally Activated LTA(Li)–Ag Zeolites with Water-Responsive Photoluminescence Properties. J. Mater. Chem. C 2015, 3 (45), 11857–11867. 10.1039/C5TC02723C. [DOI] [Google Scholar]
- Petty J. T.; Fan C.; Story S. P.; Sengupta B.; S. John Iyer A.; Prudowsky Z.; Dickson R. M. DNA Encapsulation of 10 Silver Atoms Produces a Bright, Modulatable, Near Infrared-Emitting Cluster. J. Phys. Chem. Lett. 2010, 1 (17), 2524–2529. 10.1021/jz100817z. [DOI] [PMC free article] [PubMed] [Google Scholar]
- Cerretani C.; Palm-Henriksen G.; Liisberg M. B.; Vosch T. The Effect of Deuterium on the Photophysical Properties of DNA-Stabilized Silver Nanoclusters. Chem. Sci. 2021, 12 (48), 16100–16105. 10.1039/D1SC05079F. [DOI] [PMC free article] [PubMed] [Google Scholar]
- Swasey S. M.; Karimova N.; Aikens C. M.; Schultz D. E.; Simon A. J.; Gwinn E. G. Chiral Electronic Transitions in Fluorescent Silver Clusters Stabilized by DNA. ACS Nano 2014, 8 (7), 6883–6892. 10.1021/nn5016067. [DOI] [PubMed] [Google Scholar]
- Swasey S. M.; Gwinn E. G. Silver-Mediated Base Pairings: Towards Dynamic DNA Nanostructures with Enhanced Chemical and Thermal Stability. New J. Phys. 2016, 18 (4), 045008. 10.1088/1367-2630/18/4/045008. [DOI] [Google Scholar]
- Largy E.; König A.; Ghosh A.; Ghosh D.; Benabou S.; Rosu F.; Gabelica V. Mass Spectrometry of Nucleic Acid Noncovalent Complexes. Chem. Rev. 2022, 122 (8), 7720–7839. 10.1021/acs.chemrev.1c00386. [DOI] [PubMed] [Google Scholar]
- Koszinowski K.; Ballweg K. A Highly Charged Ag 64+ Core in a DNA-Encapsulated Silver Nanocluster. Chem. - A Eur. J. 2010, 16 (11), 3285–3290. 10.1002/chem.200902743. [DOI] [PubMed] [Google Scholar]
- Walter M.; Akola J.; Lopez-Acevedo O.; Jadzinsky P. D.; Calero G.; Ackerson C. J.; Whetten R. L.; Grönbeck H.; Häkkinen H. A Unified View of Ligand-Protected Gold Clusters as Superatom Complexes. Proc. Natl. Acad. Sci. U. S. A. 2008, 105 (27), 9157–9162. 10.1073/pnas.0801001105. [DOI] [PMC free article] [PubMed] [Google Scholar]
- Liisberg M. B.; Krause S.; Cerretani C.; Vosch T. Probing Emission of a DNA-Stabilized Silver Nanocluster from the Sub-Nanosecond to Millisecond Timescale in a Single Measurement. Chem. Sci. 2022, 13 (19), 5582–5587. 10.1039/D2SC01137A. [DOI] [PMC free article] [PubMed] [Google Scholar]
- Petty J. T.; Carnahan S.; Kim D.; Lewis D. Long-Lived Ag106+ Luminescence and a Split DNA. Scaffold. J. Chem. Phys. 2021, 154 (24), 244302. 10.1063/5.0056214. [DOI] [PubMed] [Google Scholar]
- Cerretani C.; Carro-Temboury M. R.; Krause S.; Bogh S. A.; Vosch T. Temperature Dependent Excited State Relaxation of a Red Emitting DNA-Templated Silver Nanocluster. Chem. Commun. 2017, 53 (93), 12556–12559. 10.1039/C7CC06785B. [DOI] [PubMed] [Google Scholar]
- Petty J. T.; Ganguly M.; Rankine I. J.; Chevrier D. M.; Zhang P. A DNA-Encapsulated and Fluorescent Ag106+ Cluster with a Distinct Metal-Like Core. J. Phys. Chem. C 2017, 121 (27), 14936–14945. 10.1021/acs.jpcc.7b04506. [DOI] [Google Scholar]
- Guidez E. B.; Aikens C. M. Theoretical Analysis of the Optical Excitation Spectra of Silver and Gold Nanowires. Nanoscale 2012, 4 (14), 4190–4198. 10.1039/c2nr30253e. [DOI] [PubMed] [Google Scholar]
- Baishya K.; Idrobo J. C.; Öğüt S.; Yang M.; Jackson K.; Jellinek J. Optical Absorption Spectra of Intermediate-Size Silver Clusters from First Principles. Phys. Rev. B 2008, 78 (7), 075439. 10.1103/PhysRevB.78.075439. [DOI] [Google Scholar]
- Bae G.-T.; Aikens C. M. Time-Dependent Density Functional Theory Studies of Optical Properties of Ag Nanoparticles: Octahedra, Truncated Octahedra, and Icosahedra. J. Phys. Chem. C 2012, 116 (18), 10356–10367. 10.1021/jp300789x. [DOI] [Google Scholar]
- Zhou M.; Jin R. Optical Properties and Excited-State Dynamics of Atomically Precise Gold Nanoclusters. Annu. Rev. Phys. Chem. 2021, 72 (1), 121–142. 10.1146/annurev-physchem-090419-104921. [DOI] [PubMed] [Google Scholar]
Associated Data
This section collects any data citations, data availability statements, or supplementary materials included in this article.


