Abstract
Elevation of active ςE levels in Escherichia coli by either repressing the expression of rseA encoding an anti-ςE factor or cloning rpoE in a multicopy plasmid, led to a large decrease in the number of dead cells and the accumulation of cellular proteins in the medium in the stationary phase. The numbers of CFU, however, were nearly the same as those of the wild type or cells devoid of the cloned gene. In the wild-type cells, rpoE expression was increased in the stationary phase and a low-level release of intracellular proteins was observed. These results suggest that dead cell lysis in stationary-phase E. coli occurs in a ςE-dependent fashion. We propose there is a novel physiological function of the ςE regulon that may guarantee cell survival in prolonged stationary phase by providing nutrients from dead cells for the next generation.
Escherichia coli undergoes a decrease in viable cell number in the early stationary phase when grown in rich media (28). Our previous study suggested that the ssnA gene helps promote the decline in cell viability (27). Disruption of ssnA caused a significant retardation of this decline, while increased expression gave rise to cell growth inhibition. Since the expression was not extensive enough to have a physical effect on cell structure, the growth inhibition seems to be due to the increase in the cellular activity of ssnA.
Here, we have identified the rpoE gene, encoding ςE, as the gene that suppresses growth inhibition by ssnA. RpoE, first identified as a transcription factor for the rpoH gene encoding a main heat shock ς factor (6, 25), is involved in the expression of several genes (4, 19) whose products deal with unfolded periplasmic or membrane proteins, caused by heat shock or environmental stresses in E. coli (15, 18, 19). ςE is an essential sigma factor in E. coli, not only at high temperatures but also at low temperatures (5, 7, 11). The active ςE molecules are increased in response to unfolded extracytoplasmic proteins (13) via a unique mechanism of ςE modulation, in which RseA, RseB, and RseC encoded by the rpoE-rseABC operon are involved (4, 15, 16). RseA, an inner membrane protein, functions as an anti-ςE factor. RseB, a periplasmic protein, binds to RseA and is thought to function as a sensor for unfolded proteins. RseC is an inner membrane protein that positively modulates ςE activity, although the mechanism of this interaction remains unclear. When unfolded proteins are accumulated in the periplasm in response to stress, such as high temperature or chemicals, RseB separates from the complex consisting of RseB, RseA, and ςE, releasing ςE as an active form in the cytoplasm. The active ςE then induces transcription from the rpoE P2 promoter to allow its autoinduction and expression of the genes of the ςE regulon (18, 19). Among these genes, htrA and fkpA are known to encode periplasmic serine protease (11, 12, 24) and periplasmic peptidyl prolyl isomerase (3), respectively, which mediate protein turnover or protein folding in the extracytoplasmic compartments. No other genes of the ςE regulon, however, have been characterized in detail.
In the present study, we also found that the elevation of active ςE led to dead cell lysis without influence on the number of living cells, which was demonstrated by examining the effect of the rpoE gene on cell growth and morphology in the stationary phase and by monitoring protein accumulation in medium. The rpoE expression and protein accumulation in medium were also examined in the wild type. On the basis of these results, we discuss the possibility of a novel function of the ςE regulon in the stationary phase.
MATERIALS AND METHODS
Medium and culture conditions.
A list of the bacteria and plasmids used in this study is presented in Table 1. Liquid culture was performed by using LB (1% Bacto Tryptone, 0.5% yeast extract, 0.5% NaCl) at 37°C under aerobic conditions by reciprocal shaking (100 times/min). In growth experiments, precultured cells were inoculated into LB (0.1% of total volume), and cell growth was observed by monitoring turbidity or CFU. Appropriate drugs were added at the following final concentrations: ampicillin, 100 μg/ml; tetracycline, 8 μg/ml; kanamycin, 40 μg/ml; chloramphenicol, 20 μg/ml.
TABLE 1.
Bacterial strains and plasmids used in this study
| Strain or plasmid | Genotype or description | Reference or source |
|---|---|---|
| E. coli strains | ||
| W3110 | IN(rrnD-rrnE) rph-1 | K. Mizobuchi |
| WK3 | W3110 rseA::Tn10kan | This work |
| MCKH21 | MC4100 rpoE::kan λ φ (htrA-lacZ) | 7 |
| YU505 | W3110 rpoE::kan | This work |
| NK7049 | ΔlacX74 galOP308 rpsL | 23 |
| YU551 | NK7049 λ φ (rpoE-lacZ) | This work |
| Plasmids | ||
| pBR322 | Ampr Tetr | 1 |
| pACYC177 | Ampr Kanr | 2 |
| pACYC177–322 | Ampr Kanr | 26 |
| pBRSSNA | pBR322 with the 2.9-kb PstI fragment bearing ssnA | 27 |
| pACYCRPOE | pACYC177–322 with the 2.8-kb EcoRI fragment bearing rpoE and rseA | This work |
| pBRRPOE | pBR322 with the 2.1-kb EcoRV fragment bearing rpoE from pACYCRPOE | This work |
| pRS551 | Ampr Kanr promoterless lacZ | 23 |
| pRSRPOE | pRS551 with the 610-base PCR fragment bearing the rpoE promoter region | This work |
| pMCL210 | lacZα Cmr | 17 |
| pMCLRSEA | pMCL210 with the 750-base PCR fragment bearing rseA | This work |
Transposon-induced gene disruption.
W3110 (wild type) cells were infected with NK1316 (λ mini Tn10kan) as described previously (8) and then cultured in LB containing kanamycin (15 μg/ml) for 8 h. The number of different disruptants in the disruptant pool was determined by spreading onto LB plates containing kanamycin (15 μg/ml) immediately after the infection. Plasmid pBRSSNA bearing ssnA (27) was then introduced into the pooled cells, the colony sizes of the transformants were compared on LB plates containing tetracycline after a 20-h incubation, and larger colonies were isolated. Tn10kan-inserted regions in the mutants were transduced with P1 phage (14) into the wild type, and the resultant transductants were checked again as to whether they showed growth inhibition in liquid culture in the presence of pBRSSNA.
DNA manipulation.
Conventional recombinant DNA techniques (20) were applied for DNA manipulation. The Tn10kan-insertion in WK3 was detected by Southern hybridization with the kan fragment from pACYC177 (2) as a probe. The hybridizing 1.8-kb HindIII fragment was then cloned and sequenced (21), and a homology search was performed by using FASTA in the DDBJ database. The 2.8-kb EcoRI fragment bearing rpoE and rseA was cloned from the Kohara λ clone 4A12 (9) into the EcoRI site on pACYC177–322 (a hybrid vector with the large PstI-BamHI fragment of pACYC177 and the small PstI-BamHI fragment of pBR322). The 2.1-kb EcoRV fragment from the recombinant pACYCRPOE was inserted into the ScaI site on pBR322, generating pBRRPOE. The rseA gene was cloned after PCR amplification of the DNA by using two primers, 5′-CCCGGATCCAAGTTCAACCGCTTATC-3′ and 5′-CCTCTGCAGTGTCACTAATGACATGG-3′, with BamHI and PstI sites, respectively, at the 5′ ends with genomic DNA of strain W3110 as a template. The amplified 750-bp DNA bearing the rseA gene was digested with BamHI and PstI and inserted between the BamHI and PstI sites on pMCL210, generating pMCLRSEA. The identity of the inserted fragment was confirmed by DNA sequencing.
A single-copy rpoE-lacZ operon fusion on the genome was constructed according to the procedure of Simons et al. (23). The 610-bp PCR fragment encompassing the promoter-operator region, including part of the coding region of the rpoE gene, was subcloned into the EcoRI-BamHI sites of pRS551 to generate pRSRPOE. To prepare the PCR fragment, upstream and downstream primers 5′-GGGGAATTCGAATGTTCAGGGAGAGT-3′ and 5′-AAGGGATCCATCCAGCGCACGATAGG-3′, with EcoRI and BamHI sites, respectively, at the 5′ ends, were used with genomic DNA from strain W3110 as a template. The identity of the fragment inserted into pRS551 was confirmed by DNA sequencing. E. coli strain P90C transformed with pRSRPOE was used as a host strain for growth of phage λRS45 (23) to prepare a phage lysate, according to standard methods (22). E. coli strain NK7049 was infected with the lysate, and phage lysogens were screened on LB plates containing kanamycin (35 μg/ml), streptomycin (50 μg/ml), and X-Gal (5-bromo-4-chloro-3-indolyl-β-d-galactopyranoside) (0.005%). This gave rise to strain YU551 [NK7049 λ φ (rpoE-lacZ)].
Microscopy.
Cells grown in LB were diluted with 100 mM potassium phosphate (pH 7.0) and stained with acridine orange at a final concentration of 30 μg/ml at room temperature for 3 min. Stained cells were filtered through a polycarbonate membrane and viewed with a B-2A filter (EX450–490) on a Nikon E600 microscope with fluorescence capability (Nikon, Tokyo, Japan). Photomicrographs were taken with a charge-coupled device camera with an exposure time of 10 ms and printed with a CP710A printer (Mitsubishi, Tokyo, Japan). The reagent solution and buffer used in the cell staining procedure were filtered through a cellulose acetate filter (0.2-μm pore diameter). The number (N) of acridine orange-stained cells per 1 ml of culture was estimated by the formula N = (n × 1/v × d), where n is the number of acridine orange-stained cells on the filter, as observed under the microscope, v is the volume used for staining expressed in milliliters, and d is the dilution of the culture.
Gene expression analysis.
Reverse transcription-PCR (RT-PCR) was carried out with 0.1 μg of total RNA, prepared as described previously (27), and the mRNA Selective PCR kit (Takara Shuzo). The primers for the RT-PCR were 5′-TGGGGAGACTTTACCTC-3′ and 5′-TCGTCAACGCCTGATAA-3′ for rpoE, 5′-ATGTTGATTCTGAAGAA-3′ and 5′-TTTCAAAACAGGTCATC-3′ for ssnA, and 5′-ACCACATTAGCACTGAG-3′ and 5′-GGTTTTTCGGGTTCTGG-3′ for htrA. The RT-PCR products were then electrophoresed on a 0.9% agarose gel, and after staining with ethidium bromide, the relative amounts of the products were densitometrically estimated by using a Bio-Rad molecular imager.
For assay with the lacZ operon fusion, cells with the rpoE-lacZ fusion on the genome were grown at 37°C in LB containing streptomycin (50 μg/ml) and kanamycin (35 μg/ml). The preculture was diluted 30-fold with the same medium containing antibiotics and further incubated for the appropriate times. Samples were then taken from the culture, and β-galactosidase activity was measured according to the procedure described by Miller (14). For determination of activity, the following formula was used (14):
 |
OD420 and OD550 were read from the reaction mixture, OD600 reflects the cell density just before assay, t is the time of the reaction expressed in minutes, and v is the volume of culture used in the assay expressed in milliliters.
Analysis of protein accumulation in medium.
Cells were grown at 37°C in LB medium, and at the time indicated, a portion of the culture was centrifuged at 17,000 × g for 2 min to separate the cell and medium fractions. The cells were resuspended in 20 mM Tris-HCl (pH 7.0) and subjected to sonication. Proteins in the medium fraction were recovered by adding trichloroacetic acid at a final concentration of 5%, centrifugation, and resuspension of the precipitate as described above. Both fractions were then applied to sodium dodecyl sulfate (SDS)–12% polyacrylamide gel electrophoresis.
RESULTS AND DISCUSSION
Suppression of ssnA-dependent growth inhibition by the increase in active ςE.
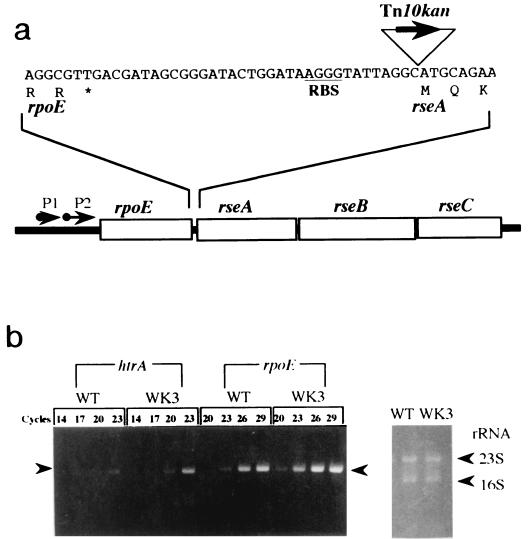
The ssnA gene involved in cell loss in the early stationary phase was shown to inhibit cell growth when cloned in a multicopy plasmid (27). A suppressor, WK3, for the ssnA-dependent growth inhibition was isolated by transposon mutagenesis. The suppression in growth of the suppressor was observed in the exponential phase, but in the stationary phase, the turbidity of its cell culture was lower than that of the wild type lacking the ssnA plasmid clone. The transposon was inserted between the ribosome recognition sequence and initiation codon of rseA, encoding an anti-ςE factor (4, 16), as shown in Fig. 1a, suggesting that rseA expression is reduced in WK3. To examine this possibility, both pMCLRSEA bearing rseA and pBRSSNA bearing ssnA were cointroduced into WK3, resulting in significant inhibition of cell growth on plates as well as in liquid cultures compared to that of WK3 harboring pBRSSNA alone. It was thus hypothesized that WK3 has more active ςE molecules than the wild type, W3110, because of the reduction of its negative regulator, RseA, and the subsequent positive autoregulation of the rpoE transcription (18, 19).
FIG. 1.
Tnl0kan insertion site and expression of rpoE and htrA in WK3 (W3110 rseA::Tn10kan). (a) The insertion site of Tn10kan in WK3, the ribosome-binding sequence (RBS) of rseA, and the stop codon of rpoE are represented by a triangle, an underline, and an asterisk, respectively. Amino acid sequences of RpoE and RseA are shown under the nucleotide sequence. Two promoters, P1 and P2 (arrows attached to solid circles), exist for the rpoE-rseA-rseB-rseC (boxes) operon. (b) Expression of htrA (left) and rpoE (right) was analyzed by RT-PCR with total RNA from WK3 or the wild-type (WT) W3110 cells, which were grown until the stationary phase (24 h) under the conditions described in Materials and Methods. Cycles show the number of PCRs. In the left panel, the left and right arrowheads indicate the positions of RT-PCR products for the htrA and rpoE transcripts, respectively. The right panel represents rRNAs used as a control.
This hypothesis was substantiated by the cloning of rpoE in a multicopy plasmid, which was also able to suppress the growth inhibition. We also checked the expression of rpoE and htrA, two genes transcribed by ςE-RNA polymerase, in WK3 by RT-PCR and found their expression to increase about sevenfold and sixfold, respectively, compared with that of the wild type (Fig. 1b). Therefore, it is likely that the increase in active ςE molecules suppresses the ssnA-dependent growth inhibition.
ςE-induced dead cell decreases and protein accumulation increases.
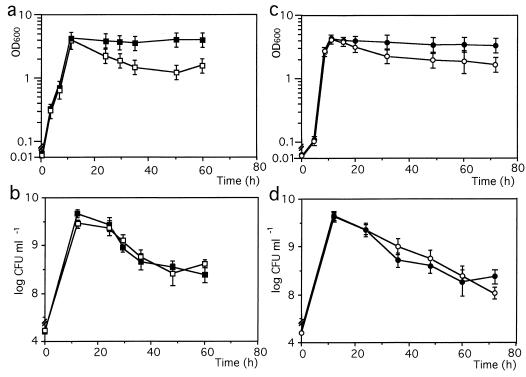
In the above experiments, we found that WK3 and W3110 harboring pBRRPOE bearing rpoE showed a large decrease in cell density in the early stationary phase compared to W3110 or W3110 carrying the vector alone (Fig. 2a and c). The decrease may be due to the increase in active ςE molecules as discussed below. The loss of cell density seen in W3110 harboring pBRRPOE, however, was less than that seen in WK3, although the former strain has a higher copy number of the rpoE gene than the latter. This could be due to the different level of the anti-ςE factor, these levels being very low in WK3. We also determined the numbers of CFU in these cultures as shown in Fig. 2b and d. Surprisingly, the CFU were nearly the same, although all strains exhibited a decrease in CFU of more than 1 order of magnitude, as first observed by Kolter et al. for wild-type E. coli (10). Additionally, lysed cells as stringy clumps were observed in the stationary phase in the liquid cultures of WK3 or W3110 cells harboring pBRRPOE, but not of W3110 or W3110 cells carrying the vector plasmid. These results led us to assume that the decrease in cell density in the early stationary phase in strain WK3 or W3110 carrying pBRRPOE is due to the lysis of dead cells.
FIG. 2.
Effect of elevated active rpoE molecules on cell growth. Cells were grown under the conditions described in Materials and Methods. At the times indicated, the cell density was estimated by measuring the turbidity at OD600 (a and c), and the viable cell number (CFU) was determined by counting the colony number 20 h after plating (b and d). W3110 (solid squares) and WK3 (W3110 rseA::Tn10kan; open squares) are shown in panels a and b, and W3110 cells harboring pBR322 (solid circles) or pBRRPOE (open circles) are shown in panels c and d. Symbols represent average values from three different experiments with standard deviations.
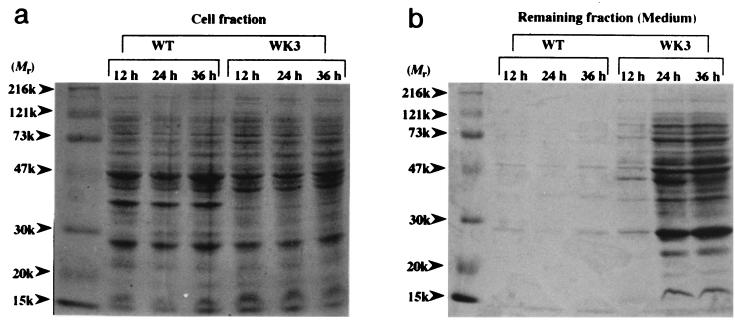
If the previous assumption is true, then proteins from lysed cells should accumulate in the medium. Consequently, cultures under the same conditions used in Fig. 2 were sampled at different times and centrifuged. The resultant precipitate and supernatant (medium) fractions were analyzed by SDS-polyacrylamide gel electrophoresis (Fig. 3a and b). Pronounced protein bands were observed in the medium fractions after the late exponential phase in WK3, and the intensity of the bands from the mutant medium fractions increased with cultivation time; conversely, the intensities of the bands from the cell fractions were weakened. Accumulation of protein was also observed in the medium of W3110 harboring the rpoE plasmid clone (data not shown). These results clearly indicate that as the stationary phase was proceeding, proteins gradually accumulated in the medium from dead cells of strains with relatively high levels of active ςE molecules. Notably, most protein bands of the medium fraction correspond roughly in size and intensity to those of the cell fraction.
FIG. 3.
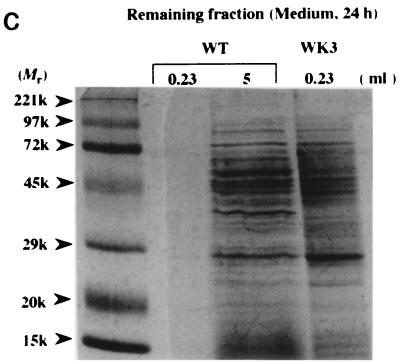
Protein accumulation in supernatants of W3110 (wild type [WT]) and WK3. Cell cultivation and fractionation of cultures were performed as described in Materials and Methods. At the times indicated, cell and remaining (medium) fractions were prepared and subjected to SDS–12% polyacrylamide gel electrophoresis. Samples of the cell (a) and medium (b) fractions were applied at equivalent amounts to 0.11 and 0.23 ml of culture, respectively. (c) The medium fraction from the wild type at 24 h was applied at an amount equivalent to (0.23 ml) or 22 times as much as (5 ml) the amount of the corresponding sample of WK3.
Microscopy of WK3 and W3110 harboring the rpoE plasmid clone.
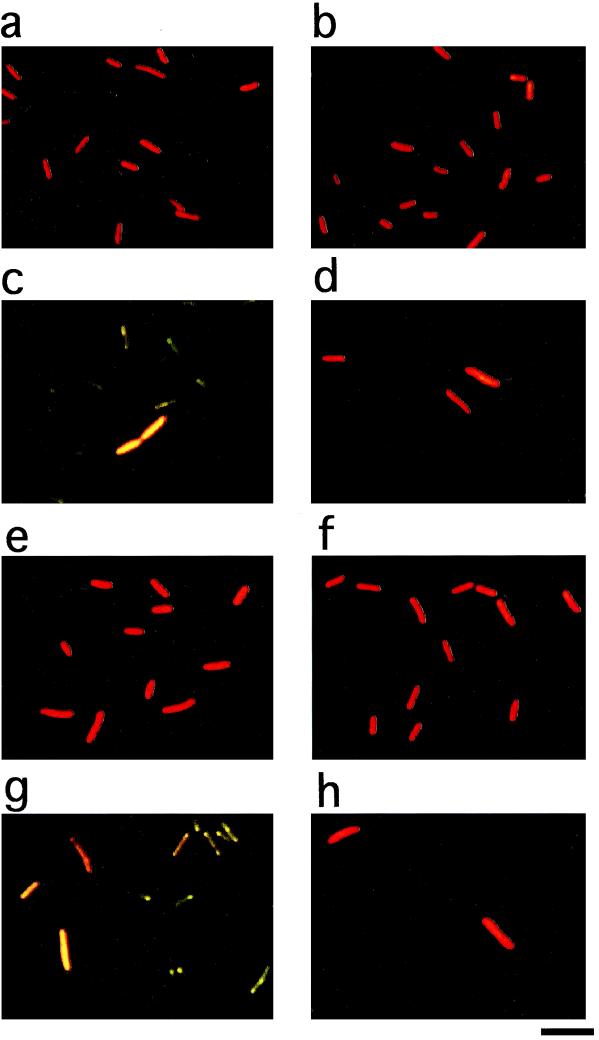
Microscopic analysis was conducted after staining the cells with acridine orange, which allows one to distinguish living (red to orange) from dead (green) cells as described by Zambrano and Kolter (29). Up to the end of the exponential phase, no morphological difference was observed between WK3 and the wild type (Fig. 4a and b) (data not shown). In the stationary phase (48-h incubation), the wild-type culture exhibited many green cells and a few red-to-orange cells (Fig. 4c). The number of red-to-orange cells was estimated to be 3 × 10⁸ cells/ml, which was almost equivalent to the CFU on the plates (Fig. 2b). In WK3, although nearly the same number of red cells as CFU was observed, few green cells were seen (Fig. 4d), indicating there were no dead cells in the WK3 culture. These observations appear to be consistent with the results of growth and CFU curves, as shown in Fig. 2a and b, and support the idea that the lysis of dead cells is responsible for the decrease in cell density in WK3. Moreover, similar results were obtained with W3110 harboring pBRRPOE, a multicopy plasmid bearing rpoE, or the vector (Fig. 4e to h). These results suggest that the increase in active ςE molecules caused the decrease in cell density by dead cell lysis in the stationary phase.
FIG. 4.
Effect of elevated active ςE molecules on cells in the stationary phase. W3110 (a and c), WK3 (b and d), W3110 harboring pBR322 (e and g), and W3110 harboring pBRRPOE (f and h) were grown under the conditions described in Materials and Methods. Cells from a 12-h culture (a, b, e, and f) or 48-h culture (c, d, g, and h) were diluted and stained with acridine orange. The scale bar represents 3 μm.
Expression of rpoE and accumulation of proteins in medium in the wild-type strain.
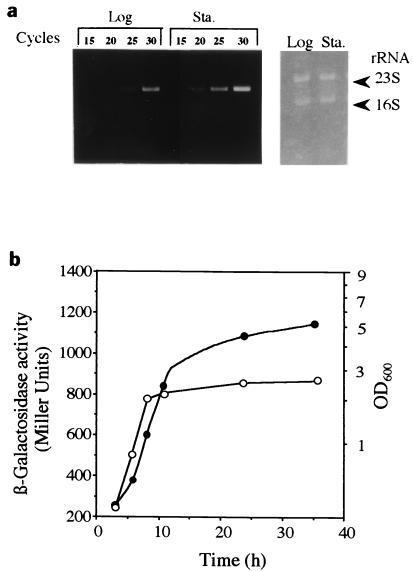
To examine whether such dead cell lysis occurs in the wild-type strain or not, proteins accumulated in 5 ml of medium harvested at the stationary phase (24 h) were analyzed (Fig. 3c). The protein pattern from the wild-type medium was found to be similar to that from the WK3 medium, except for a few bands. These results encouraged us to analyze rpoE expression in the stationary phase by RT-PCR. The results revealed that the expression was significantly higher in this phase of growth (Fig. 5a), corresponding to the time of accumulation of protein in the medium. The rpoE expression along with cell growth was also analyzed by using a single rpoE-lacZ operon fusion in YU551 [NK7049 λ φ(rpoE-lacZ)], which bears both rpoE promoters, constitutive P1 and ςE-inducible P2 (18). β-Galactosidase activity from the fusion construct significantly increased at the stationary phase (Fig. 5b), suggesting again that the rpoE expression level is elevated at this phase.
FIG. 5.
Expression of rpoE along with cell growth in wild-type strain. (a) Total RNAs prepared from the wild-type (W3110) cells, grown at 37°C until the exponential (8 h [Log]) or stationary (24 h [Sta.]) phase, were subjected to RT-PCR with primers for rpoE. Cycles show the number of PCRs. The panel to the right represents rRNAs as a control. (b) YU551 cells with the rpoE-lacZ fusion on the genome were grown at 37°C, and samples taken at the times indicated were subjected to a β-galactosidase assay. Solid and open circles represent β-galactosidase activity and cell growth as determined by turbidity, respectively.
Possible role for the ςE regulon in the stationary phase.
We further attempted to investigate the role of the rpoE gene in the stationary phase by using an rpoE-disrupted strain. YU505 (W3110 rpoE::kan) was generated by P1 transduction from MCKH21 [MC4100 rpoE::kan λ φ(htrA-lacZ)]. The transductants, however, displayed heterogeneity in colony size: the large colonies which appeared irregularly might be suppressor mutants, as reported by De Las Peñas et al. (5). Therefore, disruption of the rpoE gene seems to have a serious effect on cell growth, which prevented us from obtaining reproducible results.
Analysis with an antibody to SsnA or by RT-PCR revealed that the increased expression of rpoE in WK3 or the rpoE clone had no effect on SsnA stability or ssnA expression (unpublished observations and data not shown). Suppression of ssnA-dependent growth inhibition by rpoE was observed from the early exponential phase, where the population of dead cells seemed to be low. The suppression, however, cannot be evaluated based on the physiological function of ssnA, because it is still unknown. We thus guess, based on the known function of the ςE regulon, that ssnA causes damage to some extracytoplasmic protein(s), resulting in inhibition of cell growth or cell death, and that the damaged protein(s) may be renatured or degraded by the ςE regulon. Similarly, abnormal extracytoplasmic proteins caused by environmental stresses are supposed to be accumulated especially in the stationary phase and to be dealt with by the regulon in the wild-type cells.
The dead cell lysis observed in the stationary phase is apparently regulated by the ςE regulon, but the molecular mechanism remains to be defined. This is the first demonstration that the ςE regulon directs dead cell lysis, which could be hypothesized to be nutritionally required for the maintenance of the living cell population in the prolonged stationary phase. Since there are corresponding genes and homologues to rpoE (19; databases), systems similar to the E. coli ςE-dependent dead cell lysis would be expected to exist in many microorganisms. The ςE regulon is thus suggested to be crucial for cell turnover in the stationary phase of growth.
ACKNOWLEDGMENTS
We thank O. Adachi, K. Matsushita, and H. Toyama for helpful discussion. We also thank K. Hiratsu for providing a strain.
This work was supported by a grant-in-aid for basic research from the Ministry of Education, Science and Culture of Japan (to M.Y.).
REFERENCES
- 1.Bolivar F, Rodriguez R L, Betlach M C, Heyneker H L, Boyer H W, Crosa J H, Falkow S. Construction and characterization of new cloning vehicles. II. A multiple cloning system. Gene. 1977;2:95–113. [PubMed] [Google Scholar]
- 2.Chang A C Y, Cohen S N. Construction and characterization of amplifiable multicopy DNA cloning vehicles derived from P15A cryptic miniplasmid. J Bacteriol. 1978;134:1141–1156. doi: 10.1128/jb.134.3.1141-1156.1978. [DOI] [PMC free article] [PubMed] [Google Scholar]
- 3.Danese P N, Silhavy T J. The ςE and the Cpx signal transduction systems control the synthesis of periplasmic protein-folding enzymes in Escherichia coli. Genes Dev. 1997;11:1183–1193. doi: 10.1101/gad.11.9.1183. [DOI] [PubMed] [Google Scholar]
- 4.De Las Peńas A, Connolly L, Gross C A. The ςE-mediated response to extracytoplasmic stress in Escherichia coli is transduced by RseA and RseB, two negative regulators of ςE. Mol Microbiol. 1997;24:373–385. doi: 10.1046/j.1365-2958.1997.3611718.x. [DOI] [PubMed] [Google Scholar]
- 5.De Las Peñas A, Connolly L, Gross C A. ςE is an essential sigma factor in Escherichia coli. J Bacteriol. 1997;179:6862–6864. doi: 10.1128/jb.179.21.6862-6864.1997. [DOI] [PMC free article] [PubMed] [Google Scholar]
- 6.Erickson J W, Gross C A. Identification of the ςE subunit of Escherichia coli RNA polymerase: a second alternate sigma factor involved in high-temperature gene expression. Genes Dev. 1989;3:1462–1471. doi: 10.1101/gad.3.9.1462. [DOI] [PubMed] [Google Scholar]
- 7.Hiratsu K, Amemura M, Nashimoto H, Shinagawa H, Makino K. The rpoE gene of Escherichia coli, which encodes ςE, is essential for bacterial growth at high temperature. J Bacteriol. 1995;177:2918–2922. doi: 10.1128/jb.177.10.2918-2922.1995. [DOI] [PMC free article] [PubMed] [Google Scholar]
- 8.Kleckner N, Bender J, Gottesman S. Use of transposon with emphasis on Tn10. Methods Enzymol. 1991;204:139–180. doi: 10.1016/0076-6879(91)04009-d. [DOI] [PubMed] [Google Scholar]
- 9.Kohara Y, Akiyama K, Isono K. The physical map of the whole E. coli chromosome: application of a new strategy for rapid analysis and sorting of a large genomic library. Cell. 1987;50:495–508. doi: 10.1016/0092-8674(87)90503-4. [DOI] [PubMed] [Google Scholar]
- 10.Kolter R, Siegele D A, Tormo A. The stationary phase of the bacterial life cycle. Annu Rev Microbiol. 1993;47:855–874. doi: 10.1146/annurev.mi.47.100193.004231. [DOI] [PubMed] [Google Scholar]
- 11.Lipinska B, Fayet O, Baird L, Georgopoulos C. Identification, characterization, and mapping of the Escherichia coli htrA gene, whose product is essential for bacterial growth only at elevated temperatures. J Bacteriol. 1989;171:1574–1584. doi: 10.1128/jb.171.3.1574-1584.1989. [DOI] [PMC free article] [PubMed] [Google Scholar]
- 12.Lipinska B, Sharma S, Georgopoulos C. Sequence analysis and regulation of the htrA gene of Escherichia coli: a ς32-independent mechanism of heat-inducible transcription. Nucleic Acids Res. 1988;16:10053–10067. doi: 10.1093/nar/16.21.10053. [DOI] [PMC free article] [PubMed] [Google Scholar]
- 13.Mecas J, Rouviëre P E, Erickson J W, Donohue T J, Gross C A. The activity of ςE, an Escherichia coli heat-inducible ς-factor, is modulated by expression of outer membrane proteins. Genes Dev. 1993;7:2618–2628. doi: 10.1101/gad.7.12b.2618. [DOI] [PubMed] [Google Scholar]
- 14.Miller J H. A short course in bacterial genetics: a laboratory manual and handbook for Escherichia coli and related bacteria. Cold Spring Harbor, N.Y: Cold Spring Harbor Laboratory Press; 1992. [Google Scholar]
- 15.Missiakas D, Mayer M P, Lemaire M, Georgopoulos C, Raina S. Modulation of the Escherichia coli ςE (RpoE) heat-shock transcription-factor activity by the RseA, RseB and RseC proteins. Mol Microbiol. 1997;24:355–371. doi: 10.1046/j.1365-2958.1997.3601713.x. [DOI] [PubMed] [Google Scholar]
- 16.Missiakas D, Raina S. Protein misfolding in the cell envelope of Escherichia coli: new signaling pathways. Trends Biochem Sci. 1997;22:59–63. doi: 10.1016/s0968-0004(96)10072-4. [DOI] [PubMed] [Google Scholar]
- 17.Nakano Y, Yoshida Y, Yamashita Y, Koga T. Construction of a series of pACYC-derived plasmid vectors. Gene. 1995;162:157–158. doi: 10.1016/0378-1119(95)00320-6. [DOI] [PubMed] [Google Scholar]
- 18.Raina S, Missiakas D, Georgopoulos C. The rpoE gene encoding the ςE (ς24) heat shock sigma factor of Escherichia coli. EMBO J. 1995;14:1043–1055. doi: 10.1002/j.1460-2075.1995.tb07085.x. [DOI] [PMC free article] [PubMed] [Google Scholar]
- 19.Rouviëre P E, De Las Peñas A, Mecas J, Lu C Z, Rudd K E, Gross C. rpoE, the gene encoding the second heat-shock sigma factor, ςE, in Escherichia coli. EMBO J. 1995;14:1032–1042. doi: 10.1002/j.1460-2075.1995.tb07084.x. [DOI] [PMC free article] [PubMed] [Google Scholar]
- 20.Sambrook J, Fritsch E F, Maniatis T. Molecular cloning: a laboratory manual. 2nd ed. Cold Spring Harbor, N.Y: Cold Spring Harbor Laboratory Press; 1989. [Google Scholar]
- 21.Sanger F, Nicklen S, Coulson A R. DNA sequencing with chain-terminating inhibitors. Proc Natl Acad Sci USA. 1977;74:5463–5467. doi: 10.1073/pnas.74.12.5463. [DOI] [PMC free article] [PubMed] [Google Scholar]
- 22.Silhavy T J, Berman M L, Enquist L W. Experiments with gene fusions. Cold Spring Harbor, N.Y: Cold Spring Harbor Laboratory; 1984. [Google Scholar]
- 23.Simons R W, Houman F, Kleckner N. Improved single and multicopy lac based cloning vectors for protein and operon fusions. Gene. 1987;53:85–96. doi: 10.1016/0378-1119(87)90095-3. [DOI] [PubMed] [Google Scholar]
- 24.Strauch K L, Johnson K, Beckwith J. Characterization of degP, a gene required for proteolysis in the cell envelope and essential for growth of Escherichia coli at high temperature. J Bacteriol. 1989;171:2689–2696. doi: 10.1128/jb.171.5.2689-2696.1989. [DOI] [PMC free article] [PubMed] [Google Scholar]
- 25.Wang Q, Kaguni J M. A novel sigma factor is involved in expression of the rpoH gene of Escherichia coli. J Bacteriol. 1989;171:4248–4253. doi: 10.1128/jb.171.8.4248-4253.1989. [DOI] [PMC free article] [PubMed] [Google Scholar]
- 26.Yamada M, Inbe H, Tanaka M, Sumi K, Matsushita K, Adachi O. Mutant isolation of the Escherichia coli quinoprotein glucose dehydrogenase and analysis of crucial residues Asp-730 and His-775 for its function. J Biol Chem. 1998;273:22021–22027. doi: 10.1074/jbc.273.34.22021. [DOI] [PubMed] [Google Scholar]
- 27.Yamada M, Talukder A A, Nitta T. Characterization of the ssnA gene, which is involved in the decline of cell viability at the beginning of stationary phase in Escherichia coli. J Bacteriol. 1999;181:1838–1846. doi: 10.1128/jb.181.6.1838-1846.1999. [DOI] [PMC free article] [PubMed] [Google Scholar]
- 28.Zambrano M M, Siegele D A, Almiron M, Tormo A, Kolter R. Microbial competition: Escherichia coli mutants that take over stationary phase culture. Science. 1993;259:1757–1760. doi: 10.1126/science.7681219. [DOI] [PubMed] [Google Scholar]
- 29.Zambrano M M, Kolter R. GASPing for life in stationary phase. Cell. 1996;86:181–184. doi: 10.1016/s0092-8674(00)80089-6. [DOI] [PubMed] [Google Scholar]


