Abstract
Introduction:
Modern dentistry aims to restore the comfort and health of the stomatognathic system. Dental implants have emerged as a promising option for this purpose. Concentrated growth factors (CGFs) have been suggested to enhance the healing of bone grafts and enhance the integration of implants into the bone. Growth factors are proteins which regulate the complex process of wound healing. They play an important role in cell migration, cell proliferation, and angiogenesis in the tissue regeneration phase. CGF was first developed by Sacco in 2006. It can be used as a barrier membrane to accelerate soft-tissue healing. CGF does not require any chemical or anticoagulants, and hence, it is free from viral transmission diseases. Crestal bone levels, peri-implant bone density, bleeding, probing depth, mobility, occlusion factors, restoration adequacy, radiographic images, oral hygiene, and patient health status are some of the important parameters for determining longevity of success rates in implant dentistry. This study will assess the peri-implant bone density and crestal bone levels with and without the use of CGF.
Aim:
To evaluate the effect of CGFs on peri-implant bone density and in the preservation of crestal bone levels around dental implants.
Materials and Methods:
Sampling procedure: Random selection of population (Sealed envelope method)
Number of groups: Two-Control group (Group 1) and Experimental group (Group 2)
Sample size: 20
For Group 2, implants were placed with CGF. For Group 1, implants were placed without CGF. The peri-implant bone density and bone levels were measured by Digora and signora software.
Results:
The mean crestal bone loss on the mesial aspect of implants placed in Group 2 is 0.294 mm and Group 1 is 0.345 mm, and the mean crestal bone loss on the distal aspect of implants placed in Group 2 is 0.320 mm and in Group 1 is 0.331 mm. There are no many significant differences on mesial and distal aspects around implants between the two groups Intragroup comparison of bone density values in Group 1 shows the mean difference from baseline to 1 month is 0.6, and after three and 6 months periods are 1.1 and 1.1, respectively, which indicates not much significant improvement in bone density values in Group 1. Intergroup comparison shows a significant difference between both the groups starting from as early as the 1st month.
Conclusion:
The results of this study indicate that CGF is significantly better in the regeneration of bone around the implants when comparing with nonCGF groups. Although CGF showed improvement in bone formation, there are no many differences in crestal bone level changes on mesial and distal sides of the implants between the two groups.
KEYWORDS: Bone density, concentrated growth factors, crestal bone level, dental implant
INTRODUCTION
Modern dentistry aims to restore the comfort and health of the stomatognathic system. Dental implants have emerged as a promising option for this purpose.[1]
A dental implant is a prosthetic device made of alloplastic material(s) implanted into the oral tissues beneath the mucosal or/and periosteal layer, and on/or within the bone to provide retention and support for a fixed or removable dental prosthesis; a substance that is placed into or/and on the jaw bone to support a fixed or removable dental prosthesis.
A typical implant consists of a titanium screw (resembling a tooth root) with a roughened or smooth surface. The majority of dental implants are made out of commercially pure titanium which is available in four grades depending upon the amount of carbon and iron contained. More recently, grade 5 titanium is being used increasingly. Grade 5 Titanium, Titanium 6Al-4V alloy (signifying the titanium alloy containing 6% Aluminum and 4% vanadium alloy) is believed to offer similar osseointegration levels as commercially pure titanium. Ti-6Al-4V alloy offers better tensile strength and fracture resistance. Implant surfaces may be modified by plasma spraying, anodizing, etching, or sandblasting to improve the osseointegration potential of the implant.[2]
Osseointegration or osteointegration refers to a direct bone-to-metal interface without the interposition of nonbone tissue. This concept has been described by Branemark, as consisting of a highly differentiated tissue making “a direct structural and functional connection between ordered, living bone, and the surface of a load-carrying implant.”[3]
Professor Per-Ingvar Branemark (1952) working in the laboratory of the vital microscopy, University of Goteberg, Sweden, accidentally discovered that titanium bonded well with bone; a phenomenon which was later termed as osseointegration.[4]
The osseointegration of dental implants is critically dependent on their surface properties.[5]
Growth factors
Growth factors are proteins which regulate the complex processes of wound healing.[6] Growth factors play a main role on cell migration, cell proliferation, and angiogenesis in the tissue regeneration phase.[7]
Concentrated growth factors (CGFs) have been suggested to enhance the healing of bone grafts and enhance the integration of implants into the bone. CGF was first developed by Sacco in 2006.[7]
The four main categories identified as parameters for success related to the implant level, peri-implant soft-tissue level, prosthesis level, and the patient's subjective assessment.[8] The aim of this study was to assess the peri-implant bone density and crestal bone levels around implants with and without the application of CGFs.
MATERIALS AND METHODS
IRB approval
Before the start of the study, the methodology was presented to the IRB, and approval was obtained.
Reg No/Date: 2014-MD-Brl-VEN-02; 14.3.2015
Sampling procedure: Random selection of population (sealed envelope method)
Number of groups: Two-control group (Group 1) and experimental group (Group 2)
Sample size: 20
Inclusion criteria
Subjects with missing teeth
Physically healthy individuals (ASA I/II)
Subjects who had given signed informed consent [Figure 1].
Figure 1.
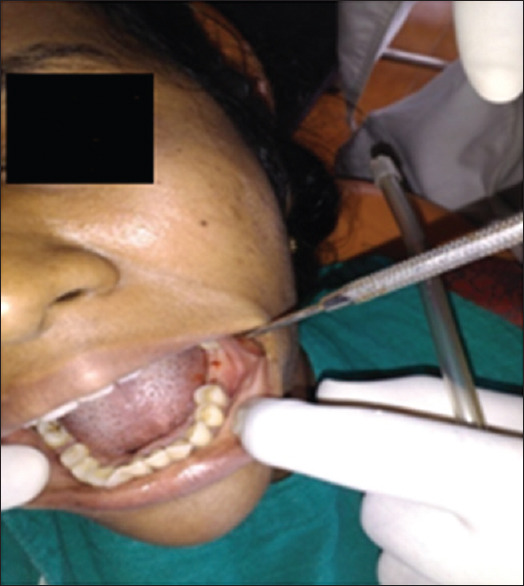
Implant patient
Exclusion criteria
Medically compromised individuals
Subjects with medication known to interfere with wound and bone healing.
Implant placement protocol: (experimental)
Osteotomy preparation was done following standard surgical protocols with adequate irrigation. For this group, implants were placed with CGF [Figure 2].
Figure 2.
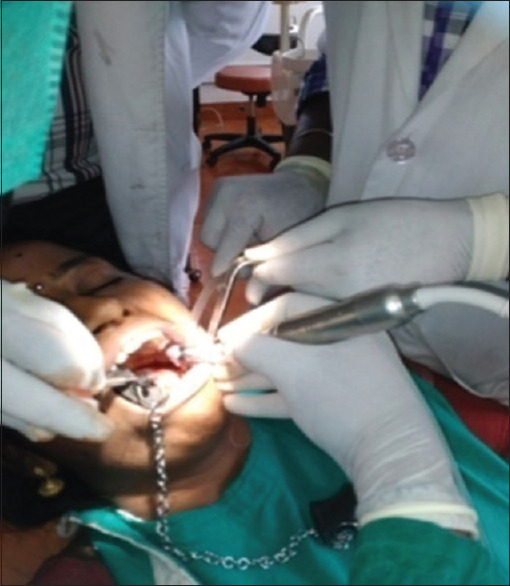
Implant placement procedure
Concentrated growth factor production technique
CGF is produced by collecting the patient's blood into 10 ml test tubes [Figure 3], which are immediately centrifuged with the MEDIFUGE SILFRADENT centrifuge [Figure 4]. Up to 8 test tubes can be taken at any one time, with no need to add any other substances, and single centrifugation will yield 3 fractions in each test tube. The coagulation may be used in the form of a membrane, by compressing it, or in fragments created by fragmenting the coagulation itself [Figures 5 and 6].
Figure 3.
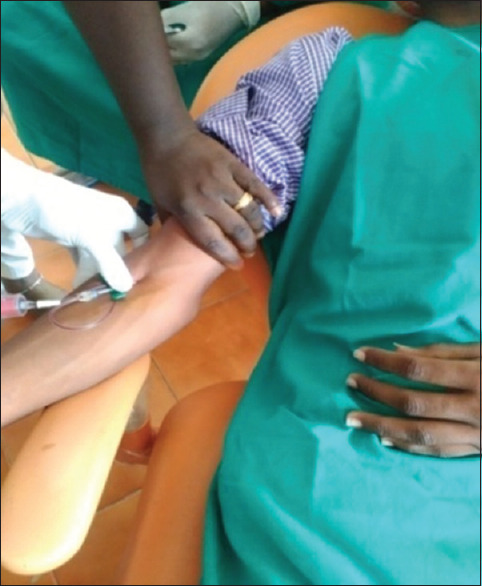
Withdrawing blood for concentrated growth factor
Figure 4.
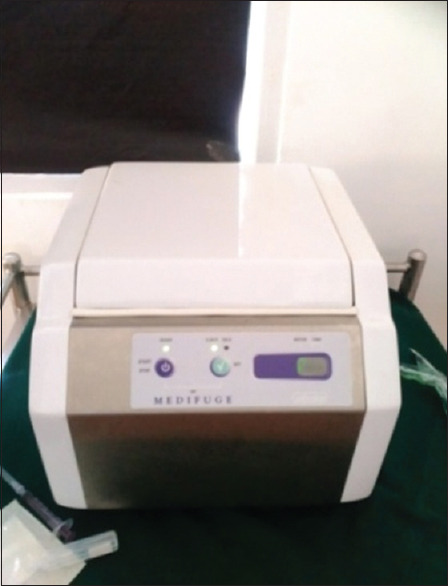
Medifuge centrifug
Figure 5.
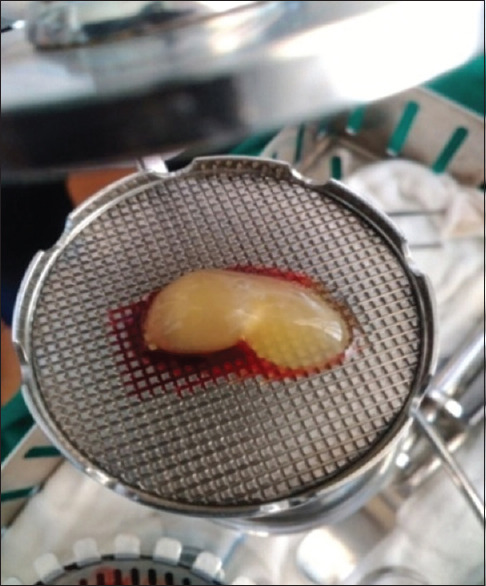
Concentrated growth factors
Figure 6.
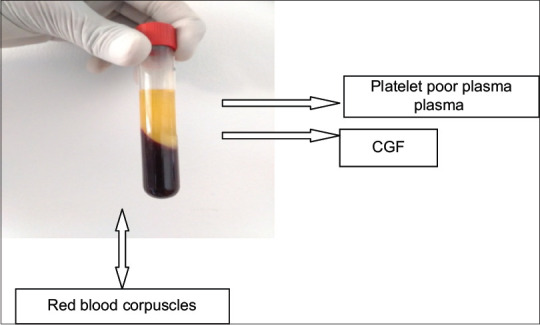
CGF in centrifuged blood
Once filled, the test tubes are quickly placed into the rotor of the Medifuge (Silfradent, Italy) [Figure 4] centrifuge accelerator, without shaking them.
Implant placement procedure
Before the surgery, careful and detailed planning was done to identify vital structures such as the inferior alveolar nerve or the sinus, as well as the shape and dimensions of the bone to properly orient the implants for the most predictable outcome. Two-dimensional radiographs, such as orthopantomography and periapical radiographs were made before the surgery. The placement of a dental implant requires preparation of the bone using precision drills with highly regulated speed and torque to prevent overheating or putting too much pressure on the bone [Figure 7]. It is important for the patient to follow postoperative instructions closely to maximize implant success [Figure 8].
Figure 7.
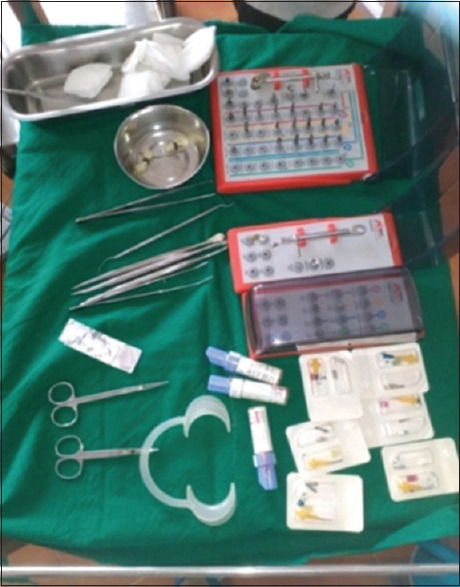
Armamentarium
Figure 8.
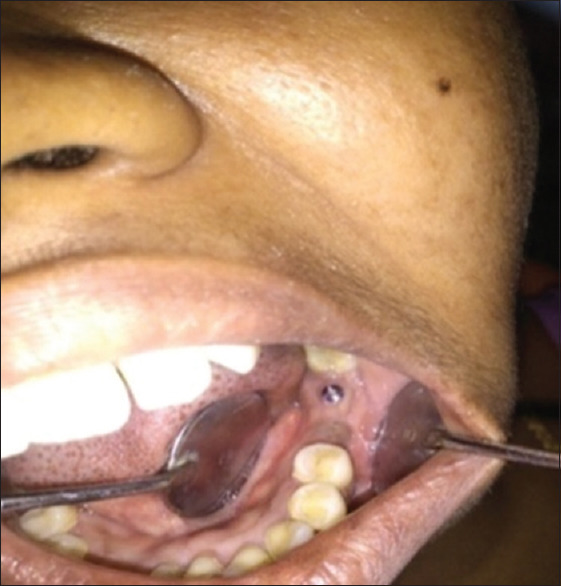
After implant placement
Post surgical and recall level radiographs
Orthopantomogram and intraoral periapical radiographs using radiovisiography were taken after each implant placement. Orthopantomogram and radiographs were taken at the baseline, after 1st month, 3rd, and 6th months.
Data collection phase
The peri-implant bone density and crestal bone levels were measured at 0, 1st, 3rd, and 6th months of implant placement.
Analysis of bone density
The peri-implant bone density was assessed using DIGORA software [Figure 9]. Digora software has increased sensitivity in the detection of bone changes noninvasively.[9] Four digitalized OPG are taken at prescheduled intervals. Nine points were marked around implants (Mesially four points, distally four points, and apically one point). Mesial four points M1, M2, M3, M4 were placed in the precise positions between thread no. 2 and 3, 4 and 5, 6 and 7, and 8 and 9 of the implant on the mesial aspect and Distal four points D1, D2, D3, and D4 were placed in similar points on the distal aspect and point A was marked 1 mm apically from the apex of the implant. The images were compared at different intervals using DIGORA Software. The radiographic density differences between each interval were evaluated and analyzed.
Figure 9.
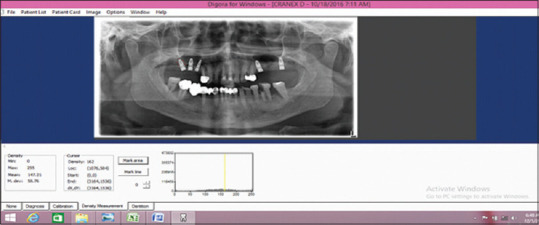
Measurement of bone density by Digora software
Analysis of crestal bone level
The crestal bone levels were assessed using digitalized Orthopantomogram (Signora) [Figures 10 and 11]. The top surface of the implant was used as the reference line and the first bone-implant contact on mesial and distal aspects was used as the bone level indicator.[10] Perpendicular lines were dropped from the reference line and the bone level on the mesial and distal sides of the implant, and the distance was measured to the nearest 0.01 mm with the image tool (Signora). The readings were recorded at baseline, 1 month, 3 months, and 6 months for all groups. All measurements were performed by an instructed dental student and checked by another investigator under the supervision of the main investigator of the study. The mean bone loss was calculated. These readings were then analyzed statistically.
Figure 10.
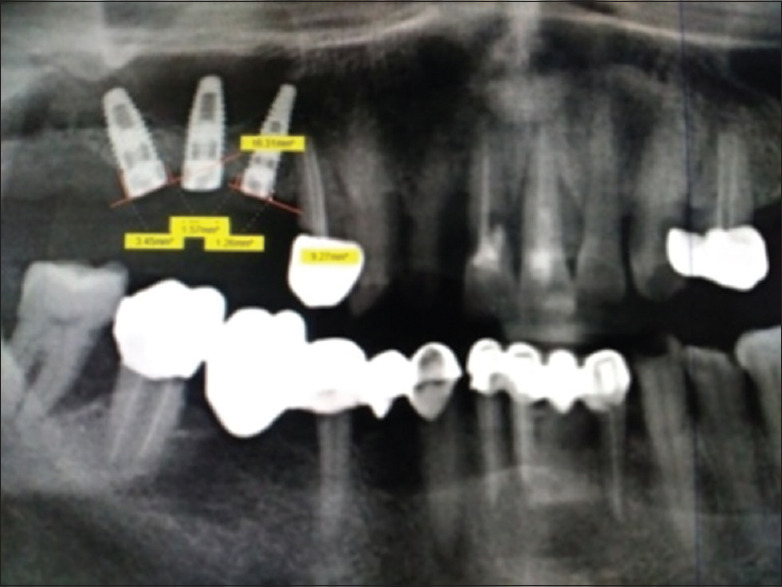
Measurement of crestal bone (maxilla)
Figure 11.
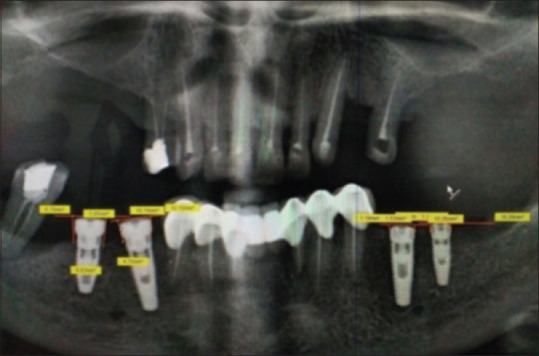
Measurement of crestal bone (mandible)
Statistical analysis
In this study, Student's t-test (paired and unpaired) was used. Paired t-test is used to measure at two different points from the data collected from subjects, whereas unpaired t-test was used to measure from two different and independent subjects. The readings obtained were analyzed by SPSS software (Version 19.0) CHICAGO, United States of America, and paired and unpaired t-tests were used to evaluate the intra- and inter-group differences in bone density around implants and unpaired t-test was used to compare the differences between two groups in crestal bone levels. The values of periimplant bone density were compared with baseline at 1 month, at 3 months, and at 6 months within the same group; and between groups, and crestal bone level values were compared at baseline, 1 month, 3 months, and 6 months between groups. The P value was taken significantly at P < 0.05 and highly significant at P < 0.01.
RESULTS
Out of the twenty implants which were placed for the study, 10 implants (50%) were placed without CGFs (Group 1) and 10 implants were placed with CGFs (Group 2). The results were tabulated and statistically analyzed.
Differences in the crestal bone levels were not statistically significant at all the time intervals (From baseline to 1st month, 3rd month, and 6th month) [Tables 1 and 2]. Inter-group comparison (Group 1– without CGF, Group 2– with CGF) of mean bone level for Group 1 from mesial baseline to 1st month, 3rd month, and 6th month were 0.120, 0.213, and 0.345, respectively, and Group 2 at 1st, 3rd month, and 6th month were 0.074, 0.171, and 0.294, respectively [Table 3]. Mean bone level for Group I from distal baseline to 1st month, 3rd, and 6th months were 0.133,0.248, and 0.331, respectively and Group 2 at 1st, 3rd, and 6th months were 0.100, 0.222, and. 320, respectively [Table 3]. On analyzing the results statistically, there was no statistically significant difference between the two groups [Table 4].
Table 1.
Crestal Bone Values and Differences at Baseline, 1st , 3rd & 6th Month ( Without CGF)
| Implant without CGF (Group 1) ( readings in mm) | |||||||||||||
|---|---|---|---|---|---|---|---|---|---|---|---|---|---|
|
| |||||||||||||
| Baseline readin | At 1st month | At 3rd month | At 6th month | Diff btwn baseline and 1st month | Diff btwn baseline and 3rd month | Diff btwn baseline and 6th month | |||||||
|
|
|
|
|
|
|
|
|||||||
| Mesial | Distal | Mesial | Distal | Mesial | Distal | Mesial | Distal | Mesial | Distal | Mesial | Distal | Mesial | Distal |
| 1.19 | 1.53 | 1.24 | 1.61 | 1.31 | 1.68 | 1.42 | 1.72 | 0.05 | 0.08 | 0.12 | 0.15 | 0.23 | 0.19 |
| 2.05 | 1.73 | 2.16 | 1.81 | 2.21 | 1.92 | 2.28 | 1.99 | 0.11 | 0.08 | 0.16 | 0.19 | 0.23 | 0.26 |
| 3.09 | 3.02 | 3.14 | 3.14 | 3.21 | 3.19 | 3.32 | 3.21 | 0.05 | 0.12 | 0.12 | 0.17 | 0.23 | 0.19 |
| 1.5 | 2.83 | 1.78 | 2.91 | 2.04 | 3 | 2.33 | 3.06 | 0.28 | 0.08 | 0.54 | 0.17 | 0.83 | 0.23 |
| 2.98 | 2.97 | 3.02 | 3.35 | 3.08 | 3.35 | 3.13 | 3.43 | 0.04 | 0.38 | 0.1 | 0.38 | 0.15 | 0.46 |
| 0.82 | 1.23 | 0.98 | 1.34 | 1 | 1.44 | 1.21 | 1.54 | 0.16 | 0.11 | 0.18 | 0.21 | 0.39 | 0.31 |
| 0.76 | 2.27 | 0.98 | 2.33 | 1.1 | 2.42 | 1.21 | 2.51 | 0.22 | 0.06 | 0.34 | 0.15 | 0.45 | 0.24 |
| 2.19 | 2.51 | 2.28 | 2.56 | 2.32 | 2.62 | 2.49 | 2.76 | 0.09 | 0.04 | 0.13 | 0.11 | 0.3 | 0.25 |
| 2.17 | 1.26 | 2.31 | 1.42 | 2.44 | 1.52 | 2.63 | 1.57 | 0.14 | 0.16 | 0.27 | 0.26 | 0.46 | 0.31 |
| 1.78 | 2.59 | 1.84 | 2.81 | 1.95 | 3.28 | 1.96 | 3.46 | 0.06 | 0.22 | 0.17 | 0.69 | 0.18 | 0.87 |
Table 2.
Crestal Bone Values and Differences at Baseline, 1st , 3rd & 6th Month ( With CGF)
| Implant with CGF (Group 2) ( in mm) | |||||||||||||
|---|---|---|---|---|---|---|---|---|---|---|---|---|---|
|
| |||||||||||||
| Baseline reading | At 1st month | At 3rd month | At 6th month | Diff btwn baseline and 1st month | Diff btwn baseline and 3rd month | Diff btwn baseline and 6th month | |||||||
|
|
|
|
|
|
|
|
|||||||
| Mesial | Distal | Mesial | Distal | Mesial | Distal | Mesial | Distal | Mesial | Distal | Mesial | Distal | Mesial | Distal |
| 4.19 | 4.72 | 4.21 | 4.82 | 4.32 | 4.84 | 4.46 | 4.86 | 0.02 | 0.1 | 0.13 | 0.12 | 0.27 | 0.14 |
| 4.34 | 3.72 | 4.42 | 3.81 | 4.51 | 3.94 | 4.62 | 3.96 | 0.08 | 0.09 | 0.17 | 0.22 | 0.28 | 0.24 |
| 3.46 | 3.24 | 3.52 | 3.34 | 3.61 | 3.52 | 3.84 | 3.56 | 0.06 | 0.1 | 0.15 | 0.28 | 0.38 | 0.32 |
| 1.26 | 1.57 | 1.31 | 1.68 | 1.34 | 1.71 | 1.38 | 1.73 | 0.05 | 0.11 | 0.08 | 0.14 | 0.12 | 0.26 |
| 1.95 | 3.45 | 1.98 | 3.54 | 2.19 | 3.67 | 2.5 | 3.69 | 0.03 | 0.09 | 0.24 | 0.22 | 0.55 | 0.24 |
| 1.5 | 2.04 | 1.62 | 2.15 | 1.74 | 2.29 | 1.84 | 2.34 | 0.12 | 0.11 | 0.24 | 0.25 | 0.34 | 0.3 |
| 1.4 | 0.66 | 1.52 | 0.76 | 1.62 | 0.98 | 1.73 | 1.06 | 0.12 | 0.1 | 0.22 | 0.32 | 0.33 | 0.4 |
| 1.1 | 1 | 1.13 | 1.1 | 1.21 | 1.31 | 1.37 | 1.37 | 0.03 | 0.1 | 0.11 | 0.31 | 0.27 | 0.37 |
| 1.22 | 2.59 | 1.34 | 2.68 | 1.37 | 3.02 | 1.39 | 3.16 | 0.12 | 0.09 | 0.15 | 0.03 | 0.17 | 0.57 |
| 3.25 | 2.16 | 3.36 | 2.27 | 3.47 | 2.49 | 3.48 | 2.52 | 0.11 | 0.11 | 0.22 | 0.33 | 0.23 | 0.36 |
Table 3.
Inter Group Comparison of Crestal Bone Values
| Groups | n | Mean | Std. Deviation | Mean difference | P | |
|---|---|---|---|---|---|---|
| Mesial baseline to 1 mont diff | without CGF | 10 | 0.120 | 0.081 | 0.046 | 0.13 |
| With CGF | 10 | 0.074 | 0.041 | |||
| Distal baseline to 1 mont diff | without CGF | 10 | 0.133 | 0.101 | 0.033 | 0.32 |
| With CGF | 10 | 0.100 | 0.008 | |||
| Mesial baseline to 3 mont diff | without CGF | 10 | 0.213 | 0.137 | 0.042 | 0.38 |
| With CGF | 10 | 0.171 | 0.057 | |||
| Distal baseline to 3 mont diff | without CGF | 10 | 0.248 | 0.173 | 0.026 | 0.68 |
| With CGF | 10 | 0.222 | 0.098 | |||
| Mesial baseline to 6 mont diff | without CGF | 10 | 0.345 | 0.202 | 0.051 | 0.50 |
| With CGF | 10 | 0.294 | 0.119 | |||
| Distal baseline to 6 mont diff | without CGF | 10 | 0.331 | 0.205 | 0.011 | 0.88 |
| With CGF | 10 | 0.320 | 0.117 |
*Unpaired t test
Table 4.
Comparison of Mesial & Distal Baseline To 1st, 3rd & 6th Month (Group 1 &2 )
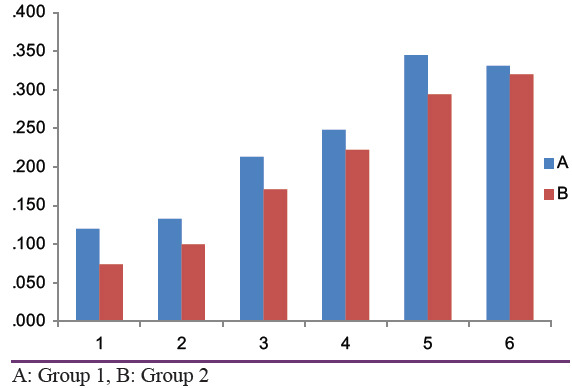
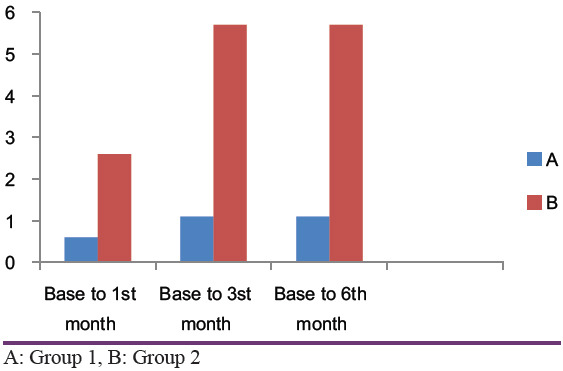
Bone density values without CGF and with CGF at 1st, 3rd and 6th month intervals were given [Tables 5 and 6]. The mean bone density in Group 1 at baseline, 1st month, 3rd month, and 6th month was 0.60, 1.10, and 1.10 and in Group 2, it was 2.60, 5.70, and 5.7, respectively [Tables 7 and 8]. In group 1, the difference between baseline and 1st month, baseline and 3rd month, and baseline and 6th month was 0.6, 1.1, and 1.1, respectively, and for group 2 it was 2.6, 5.7, and 5.7, respectively [Tables 7 and 8]. On analyzing the results statistically, there was a statistically significant difference between baseline and 1st month, baseline and 3rd month, and baseline and 6th month in group 2, but in group 1, the differences were not statistically significant [Table 9].
Table 5.
Bone Density Values Without CGF ( Readings at Baseline, 1st Month , 3rd& 6th Month)
| without CGF | ||||||
|---|---|---|---|---|---|---|
|
| ||||||
| Baseline reading | At 1st month | at 3rd month | at 6th month | Diff btwn baseline and 1st month | Diff btwn baseline and 3rd month | Diff btwn baseline and 6th month |
| 198 | 199 | 200 | 200 | 1 | 2 | 2 |
| 200 | 201 | 202 | 202 | 1 | 2 | 2 |
| 206 | 205 | 205 | 205 | -1 | -1 | -1 |
| 162 | 162 | 163 | 163 | 0 | 1 | 1 |
| 161 | 162 | 163 | 163 | 1 | 2 | 2 |
| 164 | 165 | 166 | 166 | 1 | 2 | 2 |
| 160 | 161 | 160 | 160 | 1 | 0 | 0 |
| 192 | 193 | 192 | 192 | 1 | 0 | 0 |
| 182 | 183 | 184 | 184 | 1 | 2 | 2 |
| 184 | 184 | 185 | 185 | 0 | 1 | 1 |
Table 6.
Bone Density Values With CGF ( Readings at Baseline, 1st Month , 3rd & 6th Month)
| With CGF | ||||||
|---|---|---|---|---|---|---|
|
| ||||||
| Baseline reading | At 1st month | at 3rd month | at 6th month | Diff btwn baseline and 1st month | Diff btwn baseline and 3rd month | Diff btwn baseline and 6th month |
| 198 | 201 | 204 | 204 | 3 | 6 | 6 |
| 196 | 199 | 202 | 202 | 3 | 6 | 6 |
| 200 | 202 | 205 | 205 | 2 | 5 | 5 |
| 161 | 163 | 166 | 166 | 2 | 5 | 5 |
| 162 | 165 | 168 | 168 | 3 | 6 | 6 |
| 160 | 162 | 165 | 165 | 2 | 5 | 5 |
| 162 | 165 | 168 | 168 | 3 | 6 | 6 |
| 192 | 195 | 198 | 198 | 3 | 6 | 6 |
| 182 | 185 | 188 | 188 | 3 | 6 | 6 |
| 183 | 185 | 189 | 189 | 2 | 6 | 6 |
Table 7.
Intra Group Comparison of Bone Density ( With & Without CGF)
| Paired Samples Statistics | |||||||
|---|---|---|---|---|---|---|---|
|
| |||||||
| Group | n | Mean | Sth. Deviation | Mean difference | P | ||
| 1.00 | Pair 1 | Baseline reading | 10 | 180.90 | 17.94 | 0.6 | 0.02 |
| At 1st month | 10 | 181.50 | 17.74 | ||||
| Pair 2 | Baseline reading | 10 | 180.90 | 17.94 | 1.1 | 0.01 | |
| At 3rd month | 10 | 182.00 | 17.73 | ||||
| Pair 3 | Baseline reading | 10 | 180.90 | 17.94 | 1.1 | 0.01 | |
| At 6th month | 10 | 182.00 | 17.73 | ||||
| 2.00 | Pair 1 | Baseline reading | 10 | 179.60 | 16.81 | 2.6 | <0.001 |
| At 1st month | 10 | 182.20 | 16.92 | ||||
| Pair 2 | Baseline reading | 10 | 179.60 | 16.81 | 5.7 | <0.001 | |
| At 3rd month | 10 | 185.30 | 16.94 | ||||
| Pair 3 | Baseline reading | 10 | 179.60 | 16.81 | 5.7 | <0.001 | |
| At 6th month | 10 | 185.30 | 16.94 | ||||
Table 8.
Inter Group Comparison of Bone Density ( With & Without CGF)
| Bone density - Between group comparison | ||||||
|---|---|---|---|---|---|---|
|
| ||||||
| Group | n | Mean | Sth. Deviation | Mean diff | P | |
| Diff btwn baseline and 1st month | 1.00 | 10 | 0.60 | 0.70 | 2 | <0.001 |
| 2.00 | 10 | 2.60 | 0.52 | |||
| Diff btwn baseline and 3rd month | 1.00 | 10 | 1.10 | 1.10 | 4.6 | <0.001 |
| 2.00 | 10 | 5.70 | 0.48 | |||
| Diff btwn baseline and 6th month | 1.00 | 10 | 1.10 | 1.10 | 4.6 | <0.001 |
| 2.00 | 10 | 5.70 | 0.48 | |||
Table 9.
Comparative analysis of Bone density from Baseline to 1st, 3rd & 6th month (Group 1 & 2)
DISCUSSION
The primary function of a dental implant is to act as an abutment for a prosthetic device, similar to a natural tooth root and crown.[11]
Osseointegration is defined as a direct structural and functional connection between ordered, living bone and the surface of a load-carrying implant.[12] Fugazzotto et al., demonstrated the efficacy of cylinder implant used in D4 bone. It was documented that implant success rates were much lower in D4 bone than in D1, D2, and D3.
Beginning in the 1990s, till today growth factors have emerged as the “ Holy Grail “ in wound healing.[13] Researches by Dong-seok sohn and others showed that CGFs improve bone formation and play a vital role in the osseointegration of implants. Growth factors play a major role to repair or generate tissues. Most of the growth factors are in blood plasma and platelets. Hence, platelet concentrates contain sufficient growth factors such as platelet-derived growth factors (PDGF), transforming growth factors (TGF-β), insulin-like growth factors-I, epidermal growth factors, vascular endothelial growth factors, and basic fibroblast growth factors.[14]
CGFss are known to have higher tensile strength, higher concentration of growth factors, and higher viscosity than platelet-rich fibrin (PRF), platelet-rich plasma (PRP), and hence, compressed CGF can be used as barrier membrane with growth factors as alternative collagen membrane. This barrier membrane induces the faster formation and fast tissue healing.[14]
Need for using concentrated growth factor
CGFs [Figures 5 and 6] is well-known to accelerate new bone formation. Other blood derivatives like PRP use complex protocols to prepare and chemical additives. CGFs overcome these disadvantages. CGF does not require any chemical or allergenic additives such as Bovine thrombin or anticoagulants, so is free from viral transmission diseases. CGF is 100% autologous fibrin.[7] CGF can be used alone or with a bone graft.[15] CGF with fibrin-rich blocks induces fast new bone formation.[16]
Other growth factors
Platelet rich plasma and its preparation
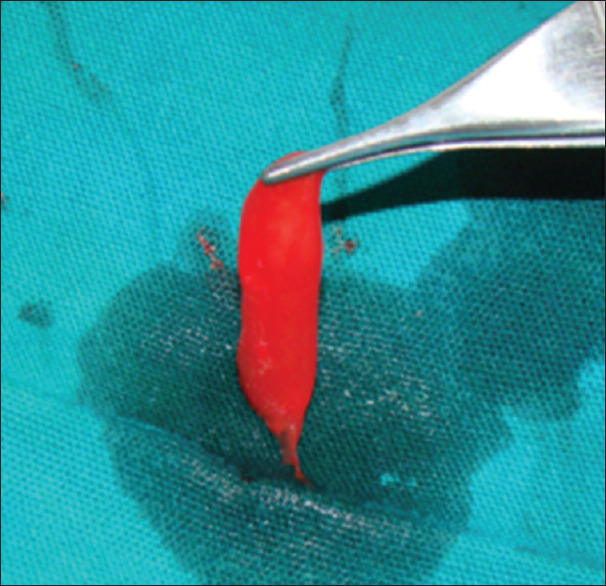
PRP is a rich source of growth factors [Figure 12].[17] It is an autologous source of platelet-derived growth factor and TGF-β.[18] PRP [Figure 12] enhances both hard and soft-tissue healing through concentrated platelets.[19] PRP gel is formed by mixing PRP with thrombin and calcium chloride.[20] Concentrated PRP can be prepared by further centrifugation of PRP.[21] PRP modulates cell proliferation in a cell type-specific manner.[22] The use of PRP in combination with autologous bone led to increased bone regeneration and bone density.[23] Further PRP in combination with mesenchymal stem cells enhances bone formation.[24]
Figure 12.
Platelet rich plasma
Plateler-rich fibrin
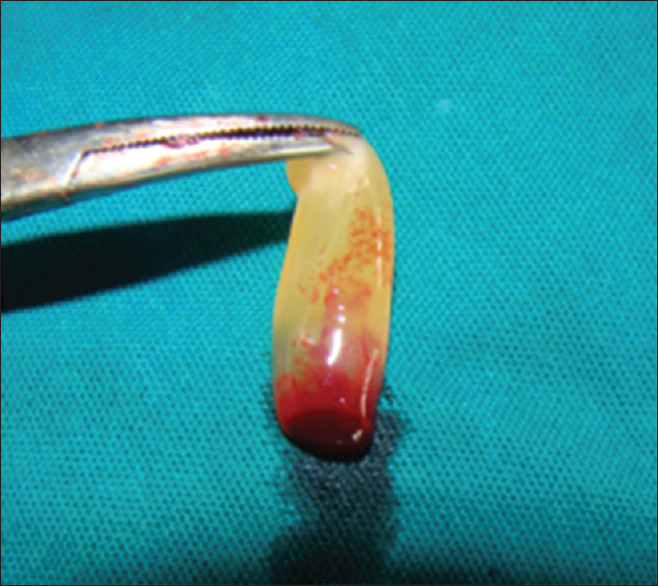
A PRF blood clot contains 4% red blood cells, 95% platelets, and 1% white blood cells [Figure 13].[25] PRF can be used along with bone grafts which promotes bone growth and maturation.[26]
Figure 13.
Platelet rich fibrin
Platelet-derived growth factor
It is considered to be the main healing hormone and has been evaluated in the large number of studies. In bone culture, PDGF stimulates mitogenic and chemotactic activities as well as protein synthesis.[27] PDGF found in other cells such as macrophages, endothelial cells, monocytes, and fibroblasts.[28]
Transforming growth factor–β
It is present at the level of the bone matrix. It promotes angiogenesis and extracellular matrix production.[29]
Mode of action of concentrated growth factor
CGF, like PRF, does not require the addition of bovine thrombin or any anticoagulants. Furthermore, altered protocols in obtaining the blood sample and in the centrifuging procedure compare with PRF. Unlike PRF however, CGF uses variable rpm from 2400 to 2700 rpm to separate cells in the venous blood, resulting in fibrin-rich blocks that are much larger, denser, and richer in growth factors than common PRF. This shows the better regenerative capacity and higher versatility when using the fibrin-rich block.[5]
Crestal bone loss around dental implants is considered to be one of the major problems and its preservation around the implant is very essential for the long-term success of implant restoration. The amount of crestal bone lost during the 1st year after the implant placement affects the implant longevity. According to the established criteria for the assessment of implant survival and success, in the 1st year the marginal bone level change should be <1.5 mm. Smith and Zarb concluded that alveolar bone loss should be <0.2 mm is one of the criteria for implant success.[30]
In this study, the mean crestal bone loss on the mesial aspect of implants placed with CGF (Group II) is 0.294 mm and without CGF (Group I) is 0.345 mm and the mean crestal bone loss on the distal aspect of implants placed with CGF (Group 2) is 0.320 mm and without CGF (Group 1) is 0.331 mm [Table 3]. Although the difference is within the success criteria of the implant (mean crestal bone loss <1.5 mm in 1 year), there are not many significant differences on mesial and distal aspects around implants between the two groups [Tables 3 and 4]. These results were in accordance with the pilot study done by Anshul Chugh et al., on radiological evaluation of marginal bone around dental implants.[29]
Another part of the study was done to analyze the effect of CGFs on peri-implant bone density. A total of 20 implants placed with and without CGFs and differences in the bone density values were analyzed from baseline to 1 month, 3 months, and 6 months.
Intragroup comparison of bone density values without CGF (Group 1) shows the mean difference from baseline to 1 month is 0.6, and after three and 6 months periods are 1.1 and 1.1, respectively which indicates not much significant improvement in bone density values without CGFs. On the other hand, the mean difference of the bone density values with the presence of CGFs (Group 2) from baseline to first, third, and 6th months are found to be 2.6, 5.7, and 5.7, respectively indicates a marked increase in density values around the implants [Tables 7 and 8]. Intergroup comparison shows a significant difference between both the groups starting from as early as the 1st month [Table 9].
The present study is in accordance with the similar studies conducted by Renu Kundu et al., with PRP on bone and implant stability revealed marked improvement in implant stability. However, the distinction is that, with CGF, the level of enhancement acquired is phenomenon and starts at the early stages of bone healing and osseointegration. Furthermore, the bone density is enhanced above the baseline level, which could mean that bone mineralization is also enhanced by CGF. A more focused study on that subject may shine light in this area.
CONCLUSION
The results of this study indicate that CGF is significantly better in the regeneration of bone around the implants when comparing with nonCGF groups. Although CGF showed improvement in bone formation, there are no many differences in crestal bone level changes on mesial and distal sides of the implants between the two groups. Alhough the present study was done with a 6 follow-up and the osseous regeneration was only measured indirectly over computer-aided software (Digora), CGF did attribute to be a much simpler and a better platelet concentrate, in promoting osseous regeneration. CGF also aided in increasing the density of the bone around the implant from baseline to a much higher level. This attribute could be used in cases where bone mineralization is compromised. However, the exact action of CGF on bone mineralization needs to be studied further.
Financial support and sponsorship
Nil.
Conflicts of interest
There are no conflicts of interest.
REFERENCES
- 1.Kundu R, Rathee M. Effect of platelet-rich-plasma (PRP) and implant surface topography on implant stability and bone. J Clin Diagn Res. 2014;8:C26–30. doi: 10.7860/JCDR/2014/9177.4478. [DOI] [PMC free article] [PubMed] [Google Scholar]
- 2.Nandhini B, Sushma S. Dental implants: As an alternative for tooth replacement. J Pharm Sci Innov. 2013;2:29–36. [Google Scholar]
- 3.Mavrogenis AF, Dimitriou R, Parvizi J, Babis GC. Biology of implant osseointegration. J Musculoskelet Neuronal Interact. 2009;9:61–71. [PubMed] [Google Scholar]
- 4.Nandal S, Ghalaut P, Shekhawat H. A radiological evaluation of marginal bone around dental implants: An in vivo study. Natl J Maxillofac Surg. 2014;5:126–37. doi: 10.4103/0975-5950.154813. [DOI] [PMC free article] [PubMed] [Google Scholar]
- 5.Elias CN, Meirelles L. Improving osseointegration of dental implants. Expert Rev Med Devices. 2010;7:241–56. doi: 10.1586/erd.09.74. [DOI] [PubMed] [Google Scholar]
- 6.Goutam M, Chandu GS, Mishra SK, Singh M, Tomar BS. Factors affecting Osseointegration: A literature review. J Orofacial Res. 2013;3:197–201. [Google Scholar]
- 7.Sohn DS. The use of Concentrated Growth Factors as Alternative to Bone Substitutes for Sinus. Augmentation J Oral Implant. 2009;38:25–38. [Google Scholar]
- 8.Papaspyridakkos P, Chen CJ, Singh M, Weber HP, Galluci GO. Success criteria in implant dentistry: A systematic review. J Dent Res. 2012;91:242–8. doi: 10.1177/0022034511431252. [DOI] [PubMed] [Google Scholar]
- 9.Brägger U, Bürgin W, Lang NP, Buser D. Digital subtraction radiography for the assessment of changes in peri-implant bone density. Int J Oral Maxillofac Implants. 1991;6:160–6. [PubMed] [Google Scholar]
- 10.Nidhin R, Vasunni GK, Ajay O, Kurien B. Comparative evaluation of crestal bone levels following Implant placement with flap and flapless techniques in posterior edentulous areas of the mandible – An in vivo study. J Dent Med Sci (IOSR-JDMS) 2014;13:95–8. [Google Scholar]
- 11.Misch CE, Perel ML, Wang H, Sammartino G, Galindo-Moreno P, Trisi P, et al. Implant success, survival, and failure: The international congress of oral implantologists (ICOI) Pisa consensus conference implant dentistry. Implant Dent. 2008;17:5–13. doi: 10.1097/ID.0b013e3181676059. [DOI] [PubMed] [Google Scholar]
- 12.Parithimarkalaignan S, Padmanabhan TV. Osseointegration: An update. J Indian Prosthodont Soc. 2013;13:2–6. doi: 10.1007/s13191-013-0252-z. [DOI] [PMC free article] [PubMed] [Google Scholar]
- 13.Yelamali T, Saikrishn D. Role of platelet rich fibrin and platelet rich plasma in wound healing of extracted third molar sockets: A comparative study. J Maxillofac Oral Surg. 2015;14:410–6. doi: 10.1007/s12663-014-0638-4. [DOI] [PMC free article] [PubMed] [Google Scholar]
- 14.Sohn DS. The Effect of Concentrated Growth Factors on Ridge Augmentation. Dental Inc; 2009. [Google Scholar]
- 15.Mirković S, Djurdjević-Mirković T, Pugkar T. Application of concentrated growth factors in reconstruction of bone defects after removal of large jaw cysts--the two cases report. Vojnosanit Pregl. 2015;72:368–71. doi: 10.2298/vsp1504368m. [DOI] [PubMed] [Google Scholar]
- 16.Sohn DS, Heo JU, Kwak DH, Kim DE, Kim JM, Moon JW, et al. Bone regeneration in the maxillary sinus using an autologous fibrin-rich block with concentrated growth factors alone. Implant Dent. 2011;20:389–95. doi: 10.1097/ID.0b013e31822f7a70. [DOI] [PubMed] [Google Scholar]
- 17.El-Sharkawy H, Kantarci A, Deady J, Hasturk H, Liu H, Alshahat M, et al. Platelet-rich plasma: Growth factors and pro- and anti-inflammatory properties. J Periodontol. 2007;78:661–9. doi: 10.1902/jop.2007.060302. [DOI] [PubMed] [Google Scholar]
- 18.Marx RE, Carlson ER, Eichstaedt RM, Schimmele SR, Strauss JE, Georgeff KR. Platelet-rich plasma: Growth factor enhancement for bone grafts. Oral Surg Oral Med Oral Pathol Oral Radiol Endod. 1998;85:638–46. doi: 10.1016/s1079-2104(98)90029-4. [DOI] [PubMed] [Google Scholar]
- 19.Tischler M. Platelet rich plasma – Utilizing autologous growth factors for dental surgery to enhance bone and soft tissue grafts. N Y State Dent J. 2002;68:22–4. [PubMed] [Google Scholar]
- 20.Manimaran, Saisadan Platelet rich plasma in implant dentistry- current trends. JIDAS. 2010;1:22–4. [Google Scholar]
- 21.Dugrillon A, Eichler H, Kern S, Klüter H. Autologous concentrated platelet-rich plasma (cPRP) for local application in bone regeneration. Int J Oral Maxillofac Surg. 2002;31:615–9. doi: 10.1054/ijom.2002.0322. [DOI] [PubMed] [Google Scholar]
- 22.Okuda K, Kawase T, Momose M, Murata M, Saito Y, Suzuki H, et al. Platelet-rich plasma contains high levels of platelet-derived growth factor and transforming growth factor-β and modulates the proliferation of periodontally related cells in vitro. J Periodontal. 2003;74:849–57. doi: 10.1902/jop.2003.74.6.849. [DOI] [PubMed] [Google Scholar]
- 23.Weibrich G, Hansen T, Kleis W, Buch R, Hitzler WE. Effect ofplatelet concentration in platelet rich plasma on peri-implant bone regeneration. Bone. 2004;34:665–71. doi: 10.1016/j.bone.2003.12.010. [DOI] [PubMed] [Google Scholar]
- 24.Pieri F, Lucarelli E, Corinaldesi G, Iezzi G, Piattelli A, Giardino R, et al. Mesenchymal stem cells and platelet-rich plasma enhance bone formation in sinus grafting: A histomorphometric study in minipig. J Clin Periodontal. 2008;35:539–46. doi: 10.1111/j.1600-051X.2008.01220.x. [DOI] [PubMed] [Google Scholar]
- 25.Naik B, Karunakar P, Jayadev M, Marshal VR. Role of platelet rich fibrin in wound healing: A critical review. J Conserv Dent. 2013;16:284–93. doi: 10.4103/0972-0707.114344. [DOI] [PMC free article] [PubMed] [Google Scholar]
- 26.Kiran NK, Mukunda KS, Tilak TN. Platelet concentrates: A promising innovation in dentistry. J Dent Sci Res. 2011;2:50–61. [Google Scholar]
- 27.Fouad Khoury, Hadi Antoun, Patrick Missika. Text Book of Bone Augmentation in Oral Implantology. Quintessence Publication; 2006. pp. 373–389. [Google Scholar]
- 28.Anitua E. Plama rich in growth factors: Preliminary results of use in the preparation of future sites for implants. Int J Oral Maxillofac Implants. 1999;14:529–35. [PubMed] [Google Scholar]
- 29.Eppley BL, Woodell JE, Higgins J. Platelet quantification and growth factor analysis from platelet-rich plasma: Implications for wound healing. Plast Reconstr Surg. 2004;114:1502–8. doi: 10.1097/01.prs.0000138251.07040.51. [DOI] [PubMed] [Google Scholar]
- 30.Mansour P, Kim P. Use of Concentrated Growth Factor (CGF) in implantology. Australasian Dental Practice. 2010;21:162–76. [Google Scholar]


