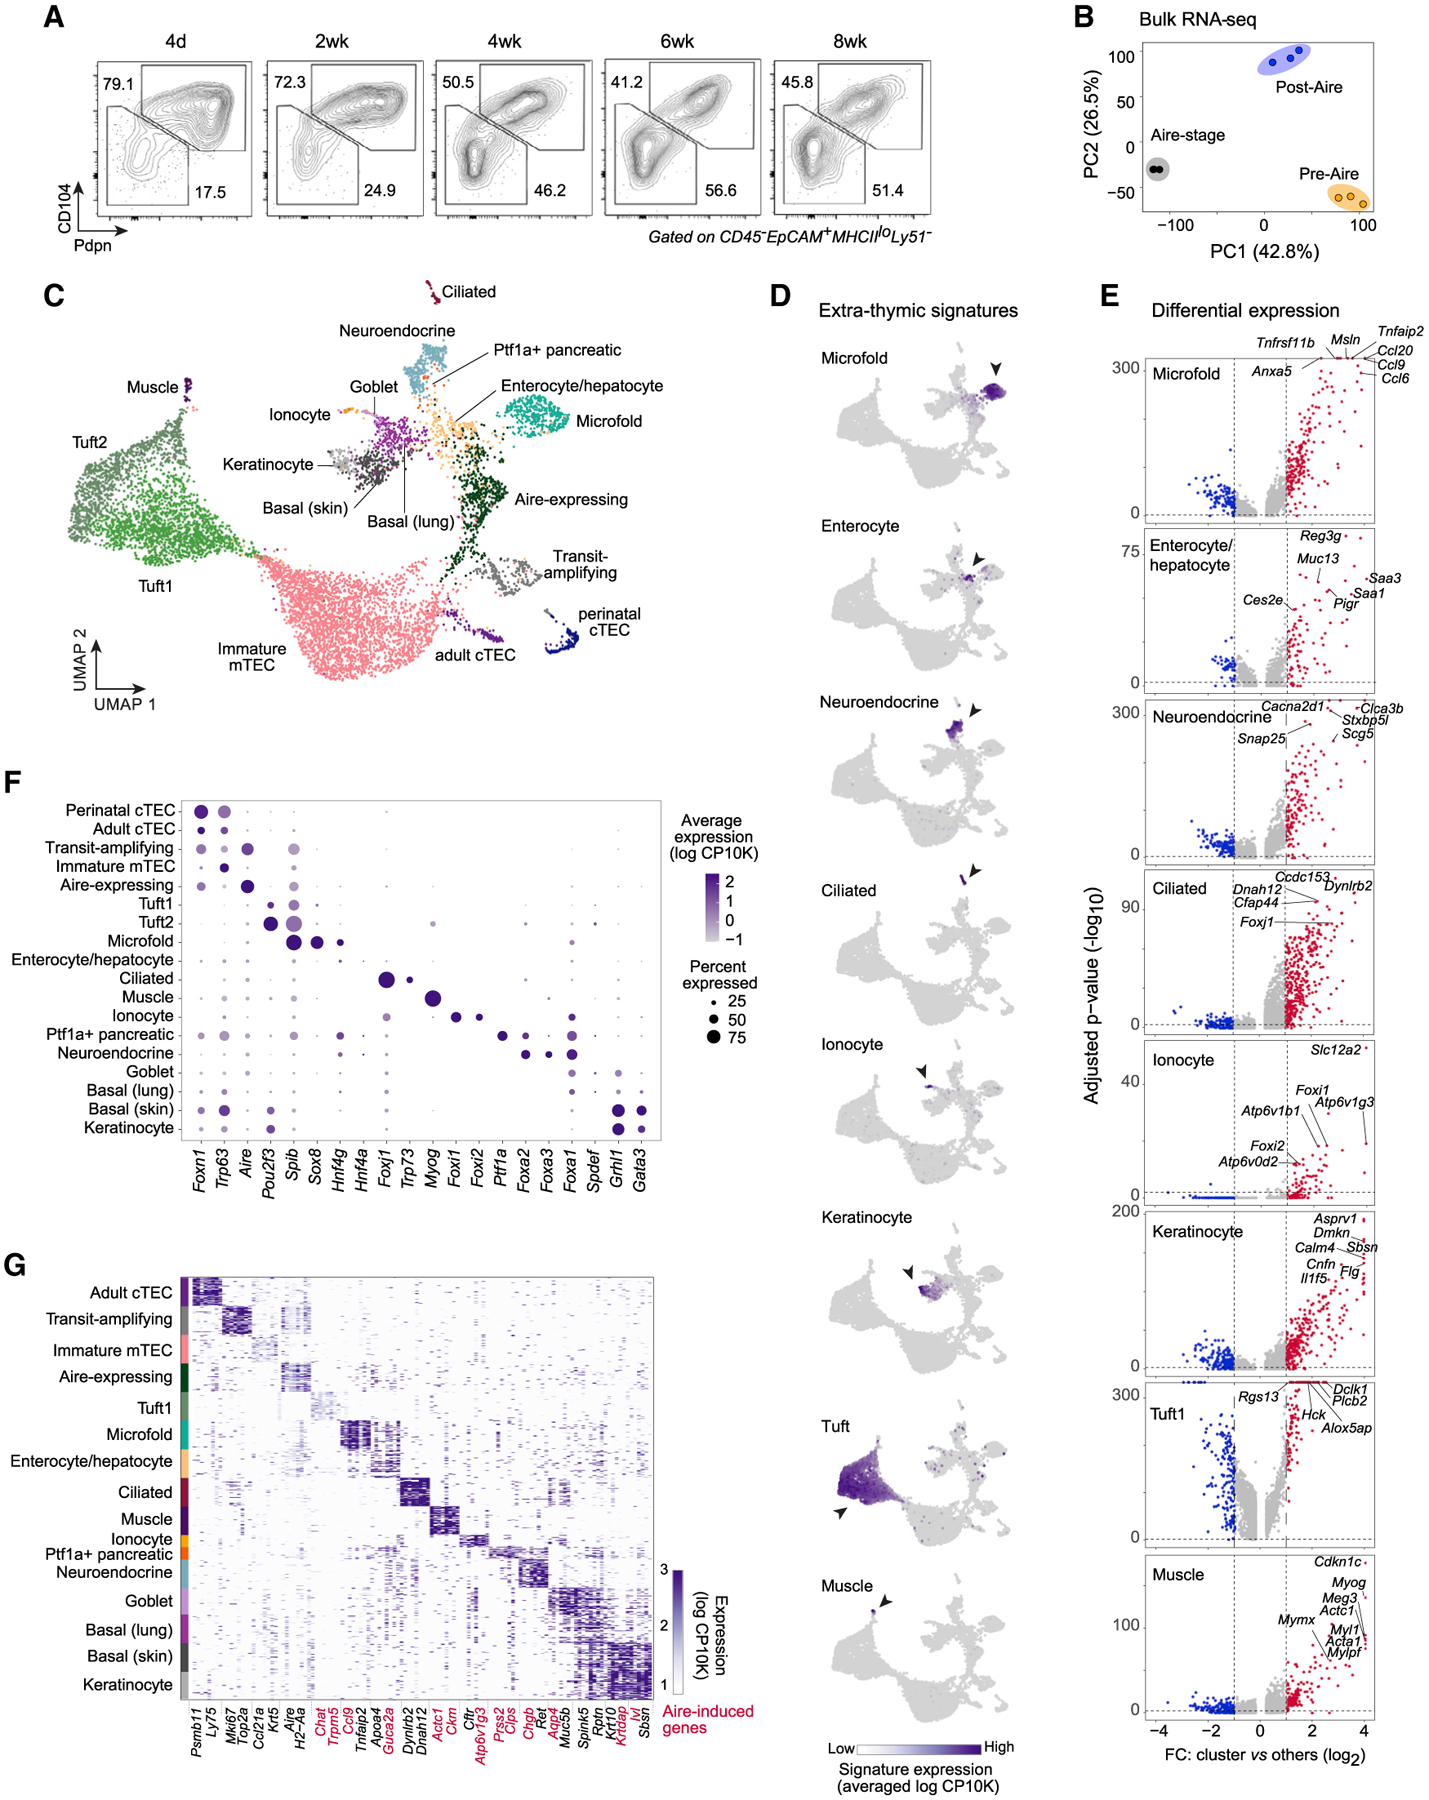
Figure 3. Mimetic cells comprise a diverse mTEC compartment with biologically logical PTA expression.

(A) Representative flow plots showing Pdpn and CD104 expression in mTEClo across mouse development.
(B) PCA of bulk RNA-seq of pre-Aire mTEClo, Aire-stage mTEChi, and post-Aire mTEClo (n = 3 for each). Each dot is one biological replicate.
(C) Merged UMAP of scRNA-seq of Pdpn–CD104– mTEClo from perinatal (n = 3) and adult (n = 3) mice.
(D) UMAPs of gene-signature expression from the indicated extra-thymic cell types in mTECs, assayed by scRNA-seq. Log CP10K, natural log1p of counts per 10,000 counts.
(E) Volcano plots of scRNA-seq of the indicated mTEC subtypes versus all other cells. Per-gene p values were BH-corrected. FC, fold change.
(F) Cluster-level expression of transcripts encoding various TFs, assayed by scRNA-seq.
(G) Heatmap of expression of transcripts encoding marker genes for each mTEC subtype, assayed by scRNA-seq. For each subtype, up to 50 randomly sampled cells are shown. Rows are cells, columns are genes, and two genes per subtype are labeled. Aire-induced genes are highlighted in red.
See also Figures S3 and S4 and Tables S1 and S2.
