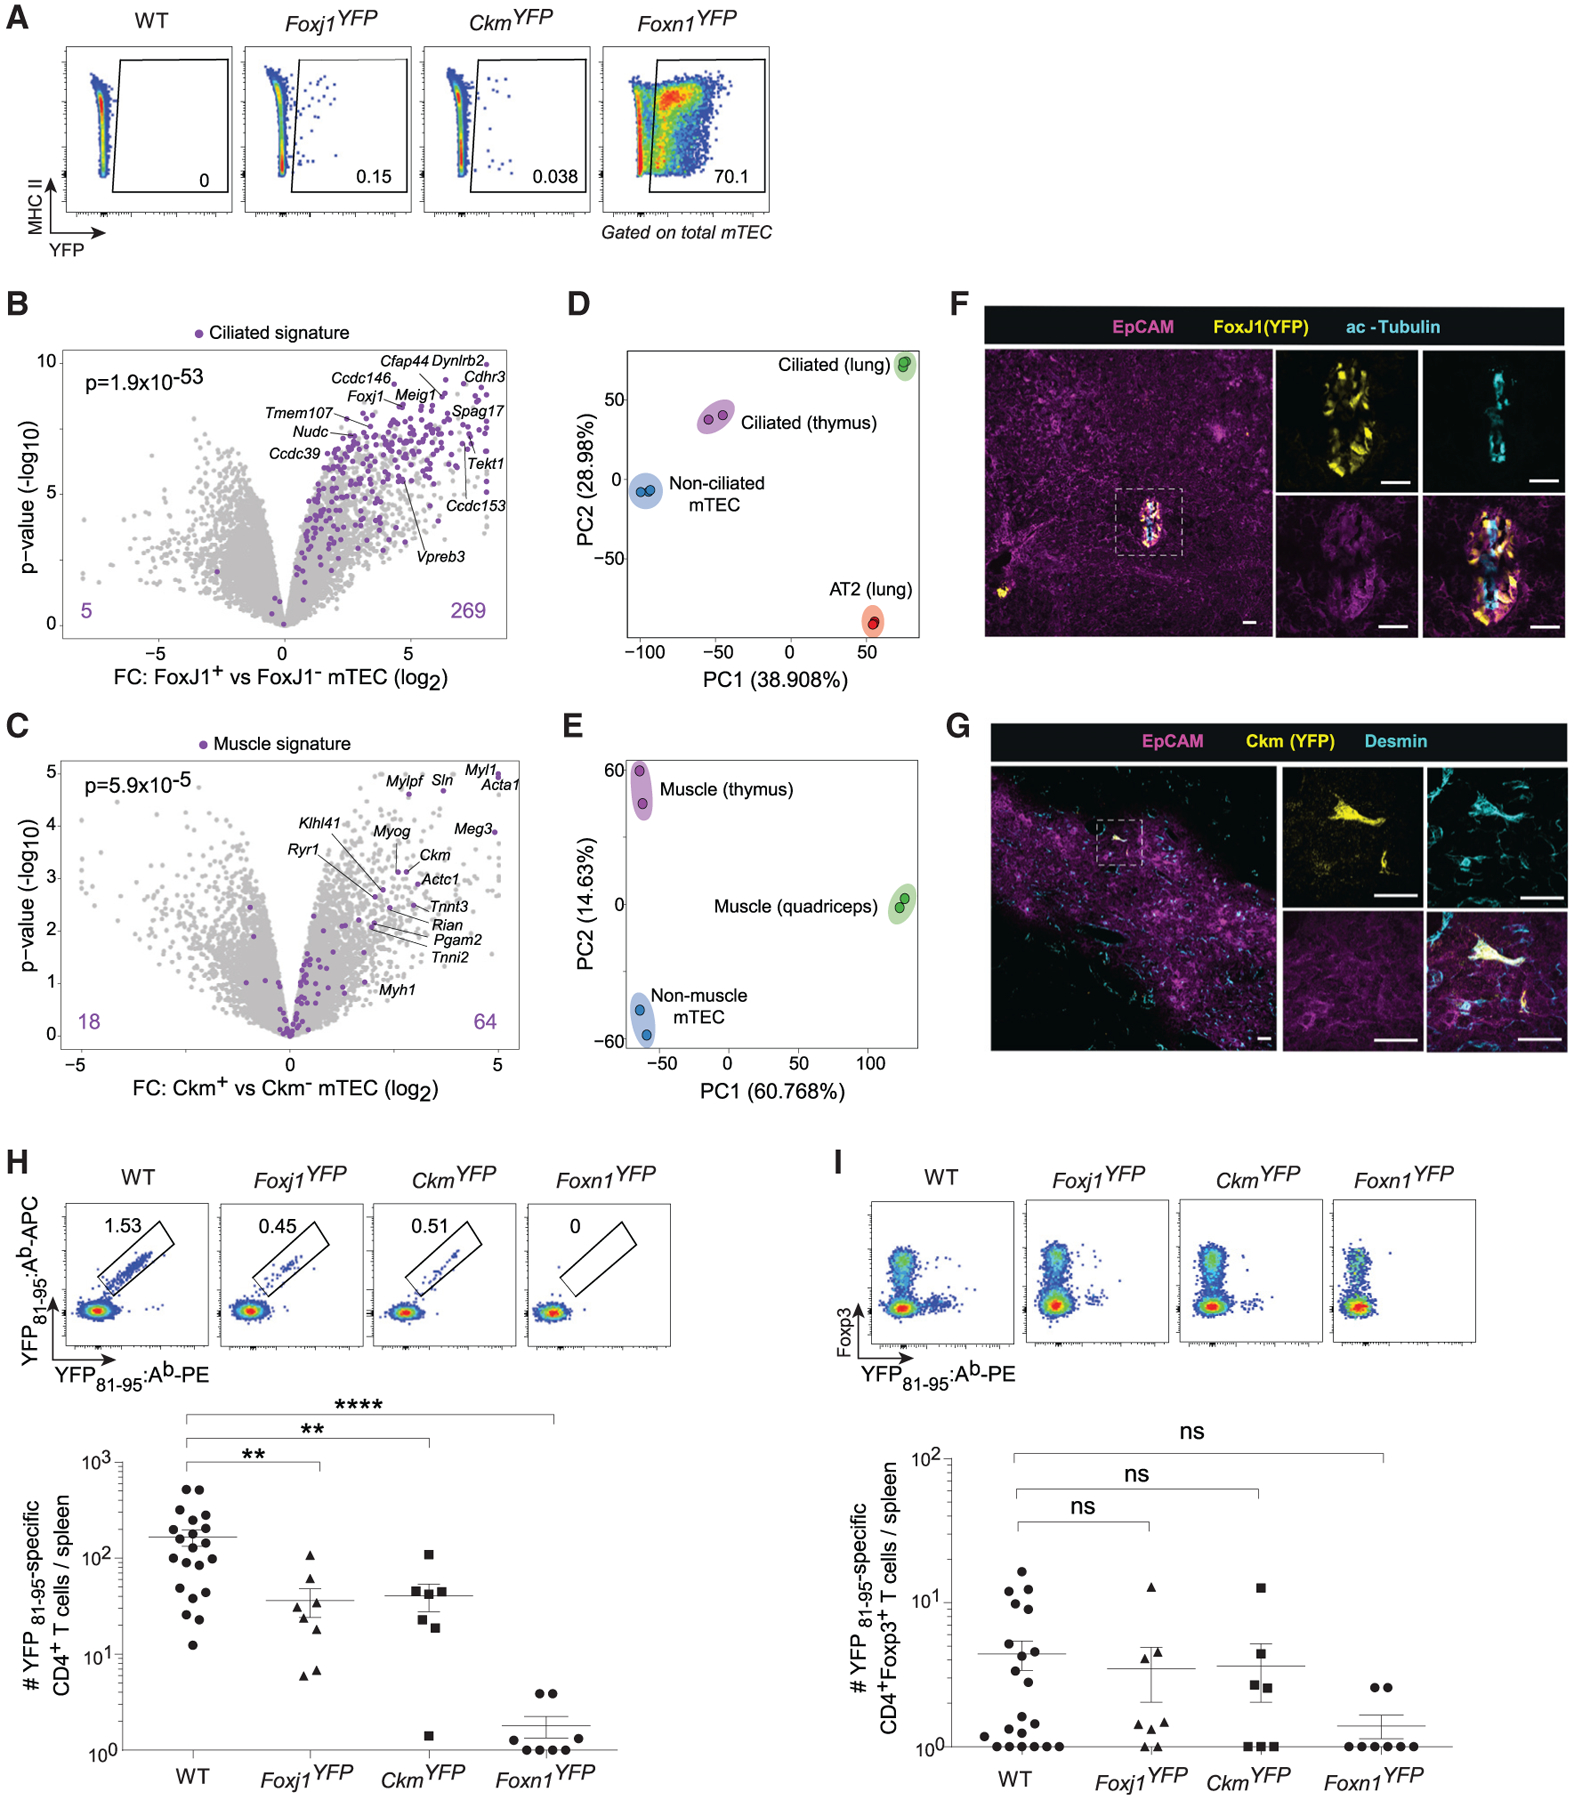
Figure 7. Expression of a model antigen in mimetic cells suffices to induce T cell tolerance.

(A) Representative flow plots showing YFP expression in mTECs from the indicated strains.
(B and C) Volcano plots of bulk RNA-seq of purified YFP+ versus YFP– mTECs from (B) Foxj1YFP and (C) CkmYFP mice. Signature p values were calculated by chi-square tests.
(D and E) PCA of bulk RNA-seq of (D) non-ciliated mTEC (n = 3), ciliated mTEC (n = 2), ciliated airway cells (n = 3), and alveolar type 2 (AT2) lung epithelial cells (n = 3), and (E) non-muscle mTEC (n = 2), muscle mTEC (n = 2), and quadriceps skeletal muscle (n = 2). Each dot is one biological replicate.
(F and G) Immunofluorescence of thymic sections from (F) Foxj1YFP and (G) CkmYFP mice, stained for the indicated markers. Scale bars, 30 μm.
(H and I) Representative flow plots (top) and summarized data (bottom) of the number of YFP81–95‒specific CD4+ T cells (H) and CD4+Foxp3+ Tregs (I) elicited in the indicated strains. For summarized data in (H) and (I), each dot is one mouse, data are pooled from 6 independent experiments, bars show mean ± SEM, and p values were calculated by one-way ANOVA with Dunnett’s test on log-transformed cell numbers. Mice with zero antigen-specific T cells were assigned a value of 1 to allow for log-transformation.
See also Table S4.
